 13
13peptides
spectra
0.000 | 0.000
0.000 | 0.000
0.006 | 0.024
0.000 | 0.009
0.211 | 0.232
0.000 | 0.000
0.751 | 0.765
0.000 | 0.000
| Plot | Mito | Lyso | Perox | ER | Golgi | PM | Cytosol | Nucleus | |||||
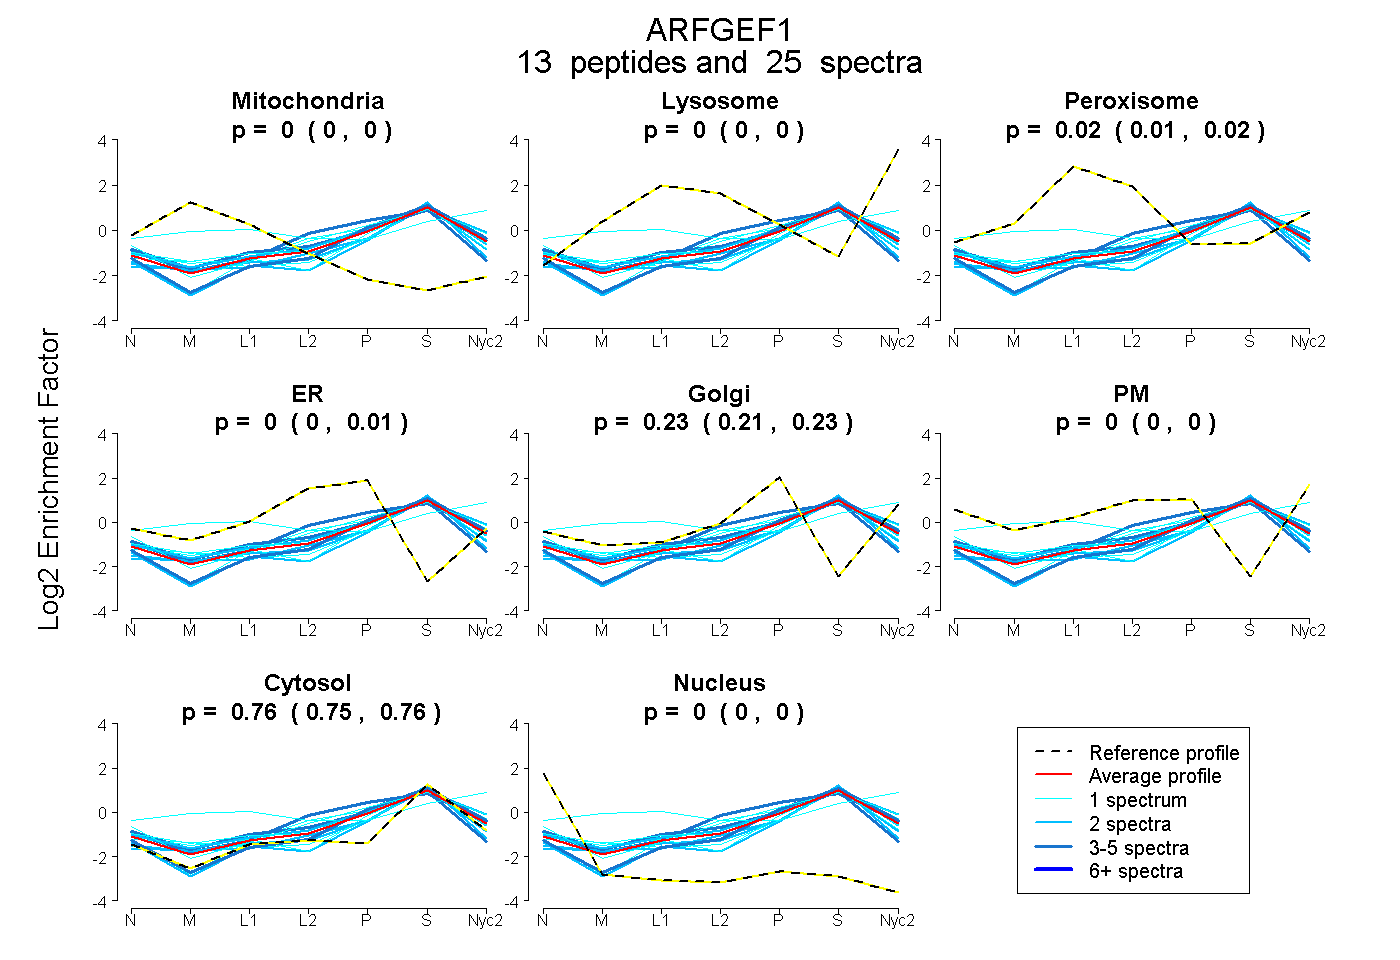
| Expt A |
13 peptides |
25 spectra |
|
0.000 0.000 | 0.000 |
0.000 0.000 | 0.000 |
0.016 0.006 | 0.024 |
0.000 0.000 | 0.009 |
0.226 0.211 | 0.232 |
0.000 0.000 | 0.000 |
0.758 0.751 | 0.765 |
0.000 0.000 | 0.000 |
| 1 spectrum, LFLEGFR | 0.026 | 0.000 | 0.000 | 0.000 | 0.175 | 0.000 | 0.799 | 0.000 | ||
| 1 spectrum, EIIEQGIDLFNK | 0.000 | 0.007 | 0.000 | 0.101 | 0.110 | 0.000 | 0.781 | 0.000 | ||
| 3 spectra, AFNSNNEQR | 0.000 | 0.007 | 0.000 | 0.232 | 0.096 | 0.000 | 0.664 | 0.000 | ||
| 1 spectrum, LSMKPLSDGPPDPK | 0.037 | 0.000 | 0.000 | 0.000 | 0.182 | 0.000 | 0.782 | 0.000 | ||
| 3 spectra, VDTQDQGMYR | 0.000 | 0.000 | 0.000 | 0.000 | 0.192 | 0.000 | 0.808 | 0.000 | ||
| 2 spectra, DFVSALR | 0.002 | 0.000 | 0.000 | 0.000 | 0.159 | 0.000 | 0.839 | 0.000 | ||
| 2 spectra, MYTDESR | 0.000 | 0.072 | 0.000 | 0.000 | 0.226 | 0.000 | 0.702 | 0.000 | ||
| 2 spectra, DAVDFDVR | 0.000 | 0.000 | 0.000 | 0.000 | 0.048 | 0.000 | 0.928 | 0.024 | ||
| 2 spectra, IWEVIGDHFNK | 0.000 | 0.004 | 0.000 | 0.000 | 0.162 | 0.000 | 0.834 | 0.000 | ||
| 1 spectrum, MENQALQEAK | 0.101 | 0.274 | 0.068 | 0.000 | 0.000 | 0.134 | 0.422 | 0.000 | ||
| 5 spectra, LLDCLLESHR | 0.000 | 0.000 | 0.000 | 0.244 | 0.000 | 0.000 | 0.756 | 0.000 | ||
| 1 spectrum, TNEMFINAIK | 0.000 | 0.017 | 0.061 | 0.000 | 0.242 | 0.000 | 0.679 | 0.000 | ||
| 1 spectrum, VSAWEEVQQR | 0.000 | 0.000 | 0.000 | 0.000 | 0.245 | 0.066 | 0.688 | 0.000 |
| Plot | Mito | Lyso or Perox | ER | Golgi | PM | Cytosol | Nucleus | ||||||
| Expt B |
8 peptides |
14 spectra |
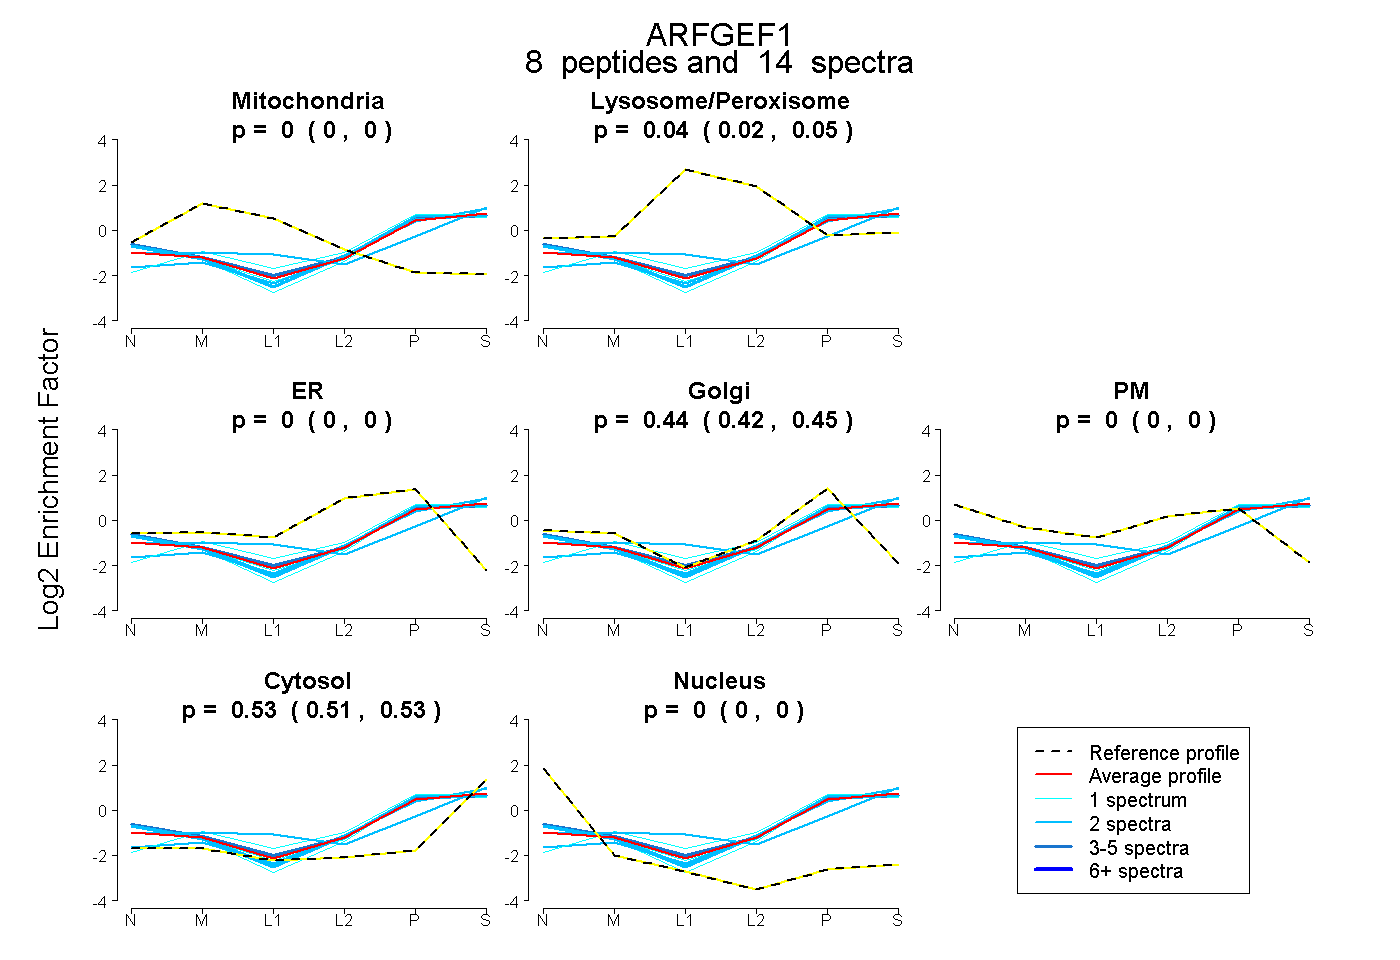 |
0.000 0.000 | 0.000 |
0.039 0.025 | 0.052 |
0.000 0.000 | 0.000 |
0.435 0.421 | 0.448 |
0.000 0.000 | 0.000 |
0.525 0.514 | 0.534 |
0.000 0.000 | 0.000 |
|||
| Plot | Lyso | Other | |||||||||||
| Expt C |
6 peptides |
16 spectra |
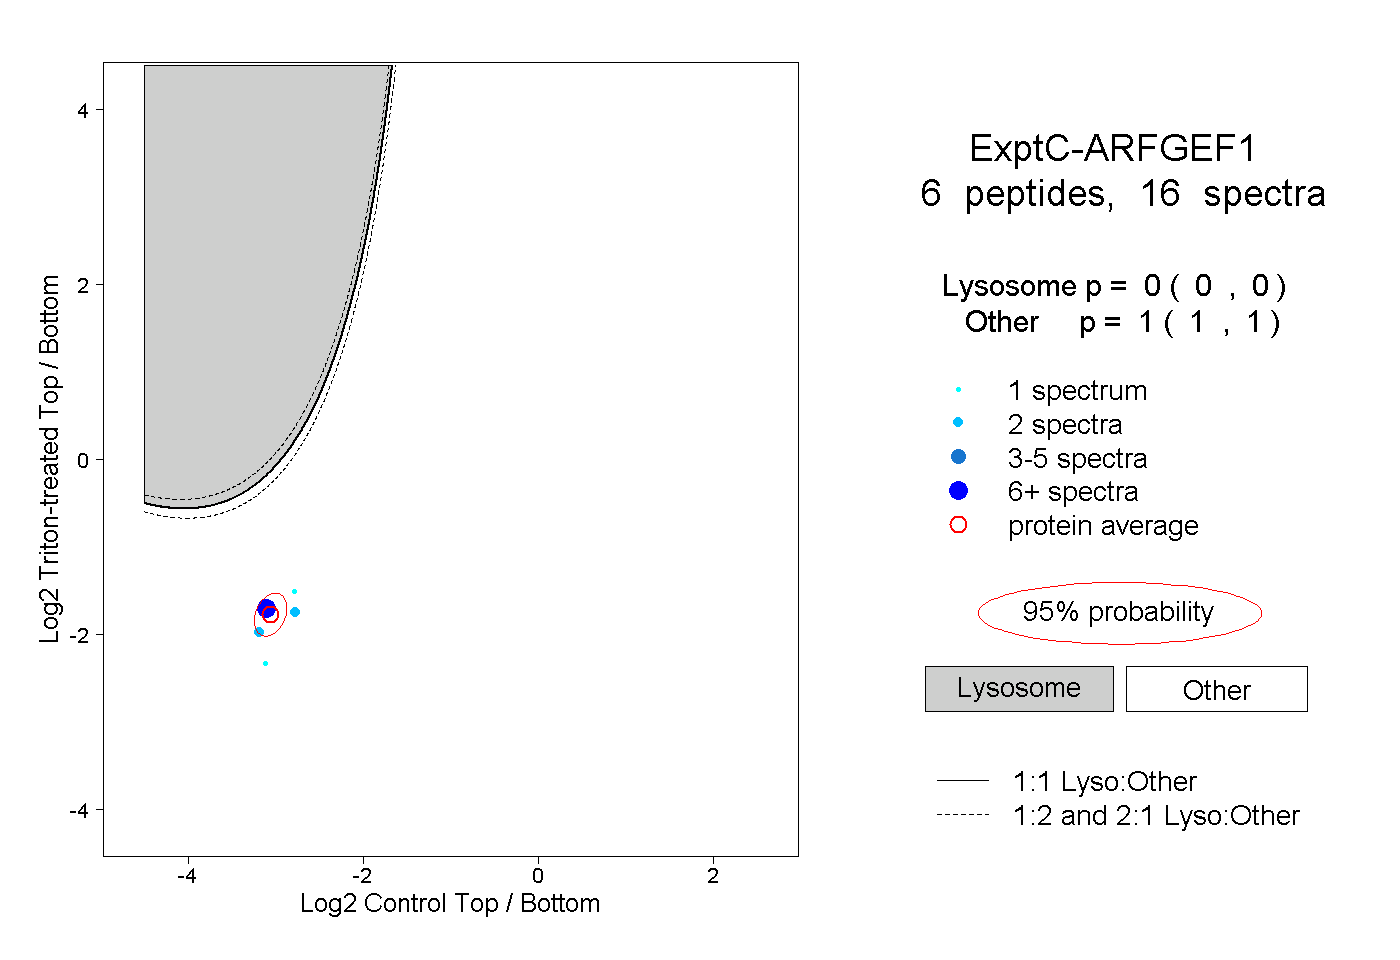 |
0.000 0.000 | 0.000 |
1.000 1.000 | 1.000 |
||||||||
| Plot | Lyso | Other | |||||||||||
| Expt D |
1 peptide |
1 spectrum |
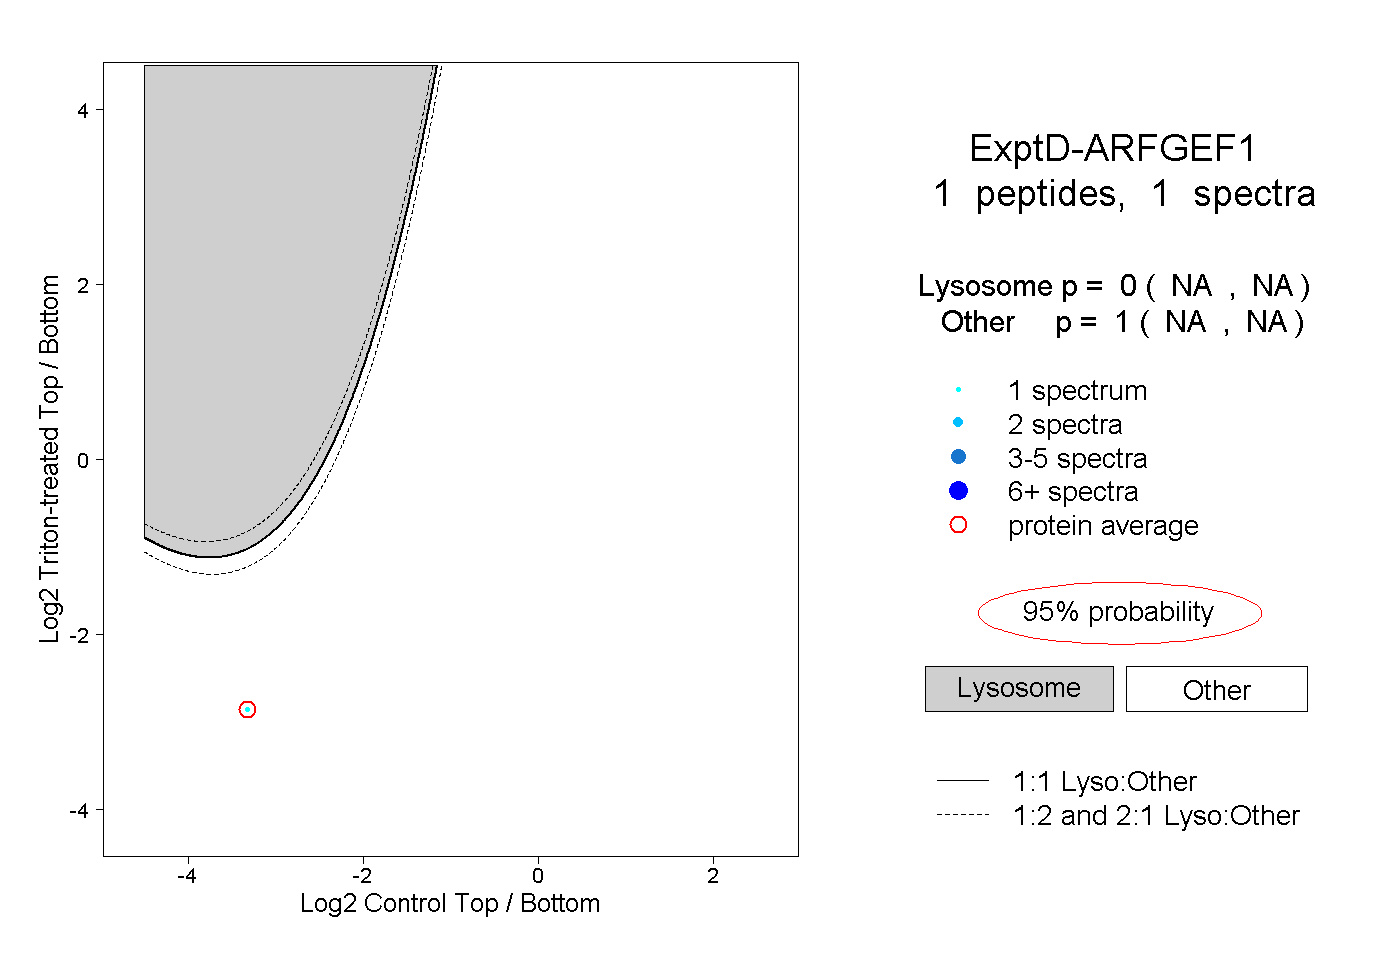 |
0.000 NA | NA |
1.000 NA | NA |