 5
5peptides
spectra
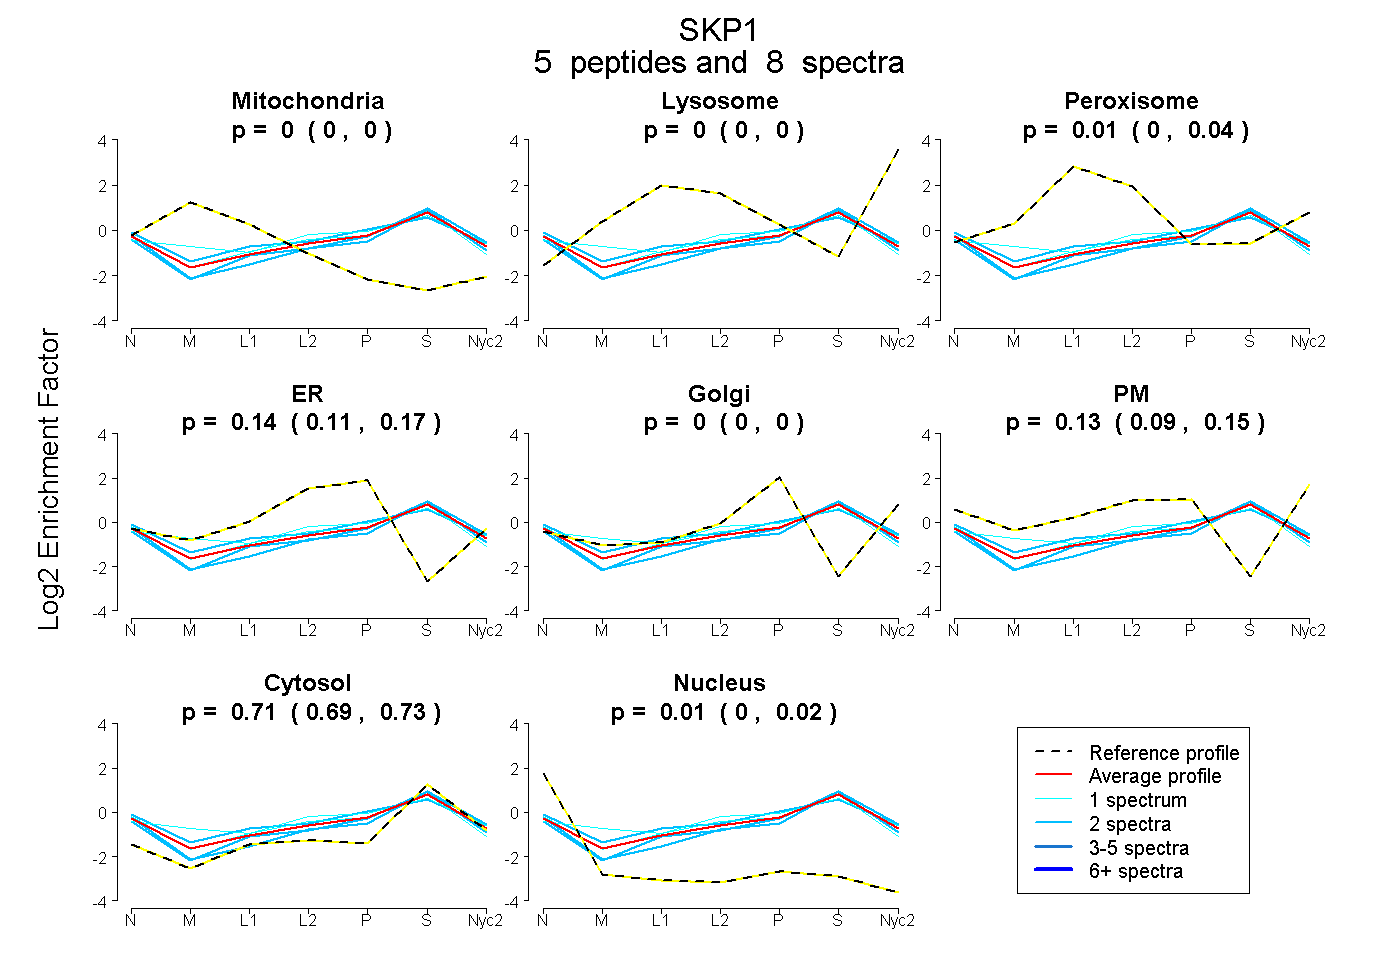
0.000 | 0.000
0.000 | 0.000
0.000 | 0.036
0.111 | 0.168
0.000 | 0.000
0.091 | 0.154
0.691 | 0.726
0.000 | 0.019
2peptides
spectra
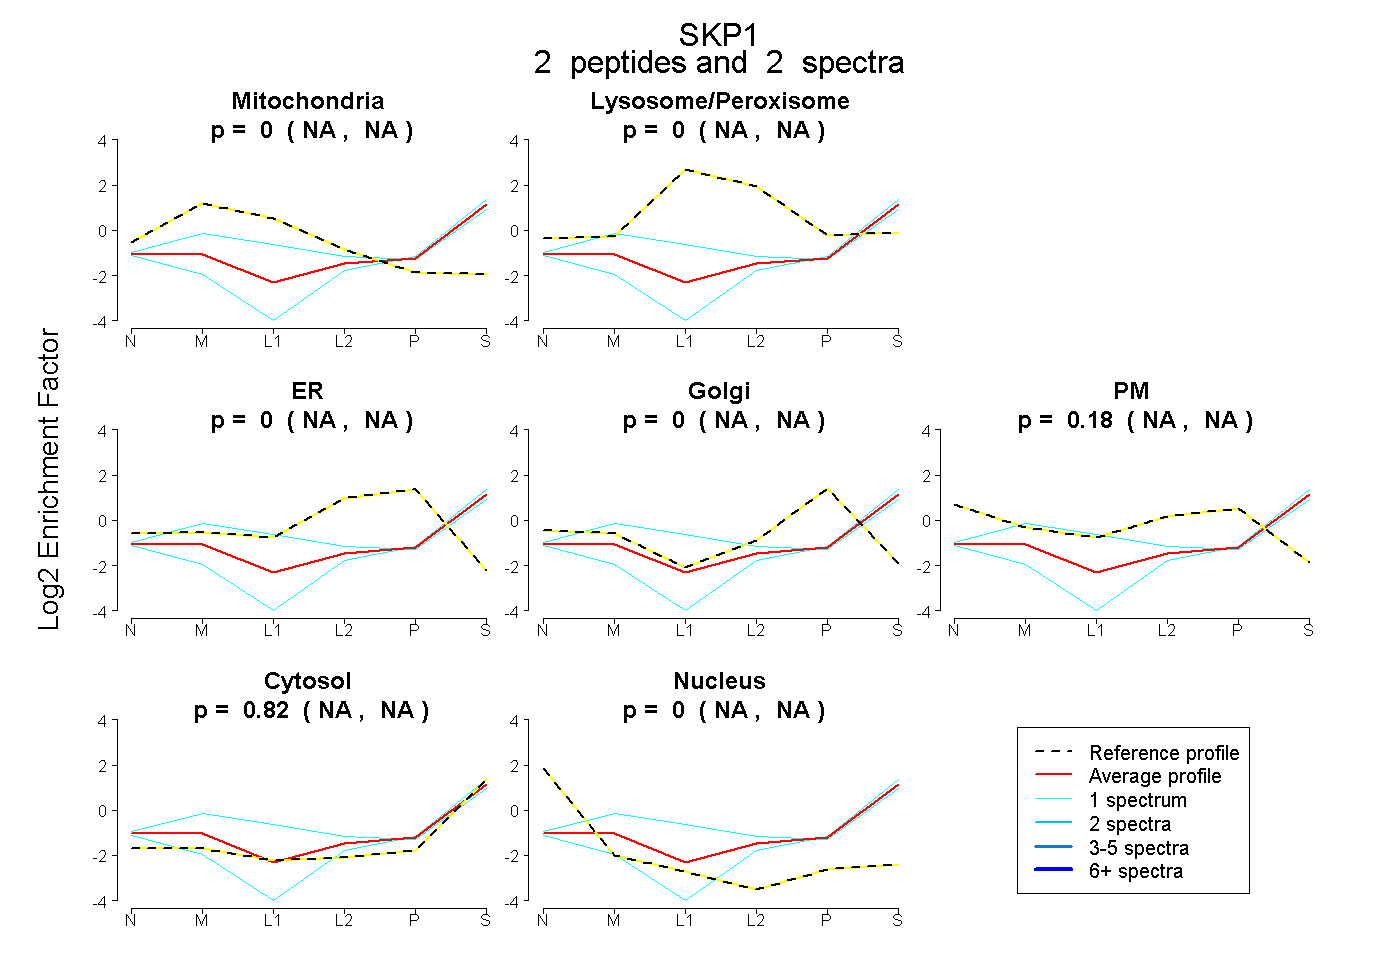
NA | NA
NA | NA
NA | NA
NA | NA
NA | NA
NA | NA
NA | NA
5peptides
spectra
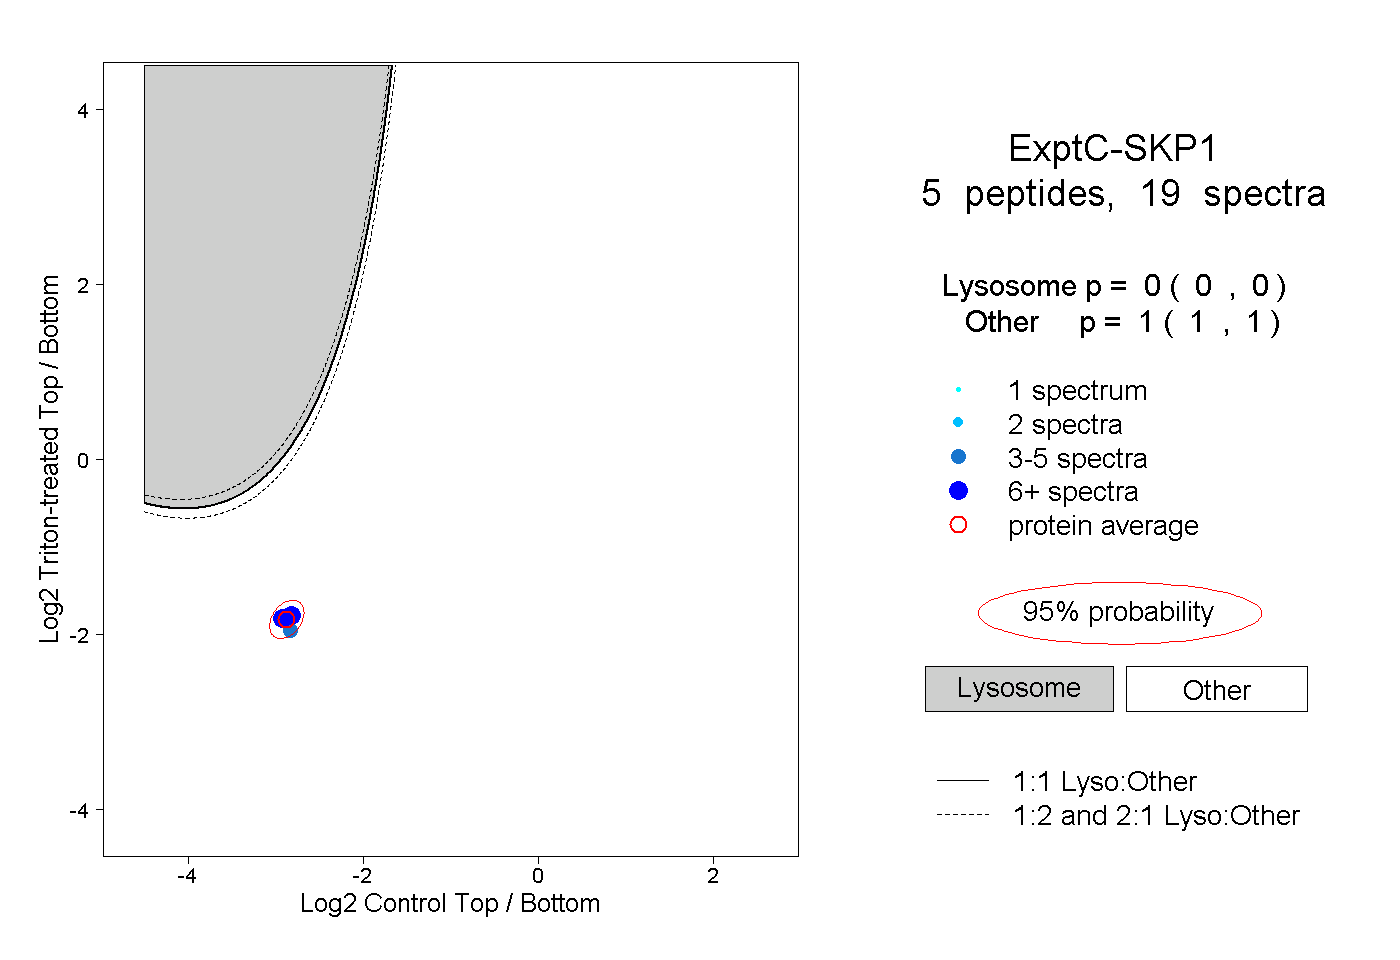
0.000 | 0.000
1.000 | 1.000