 5
5peptides
spectra
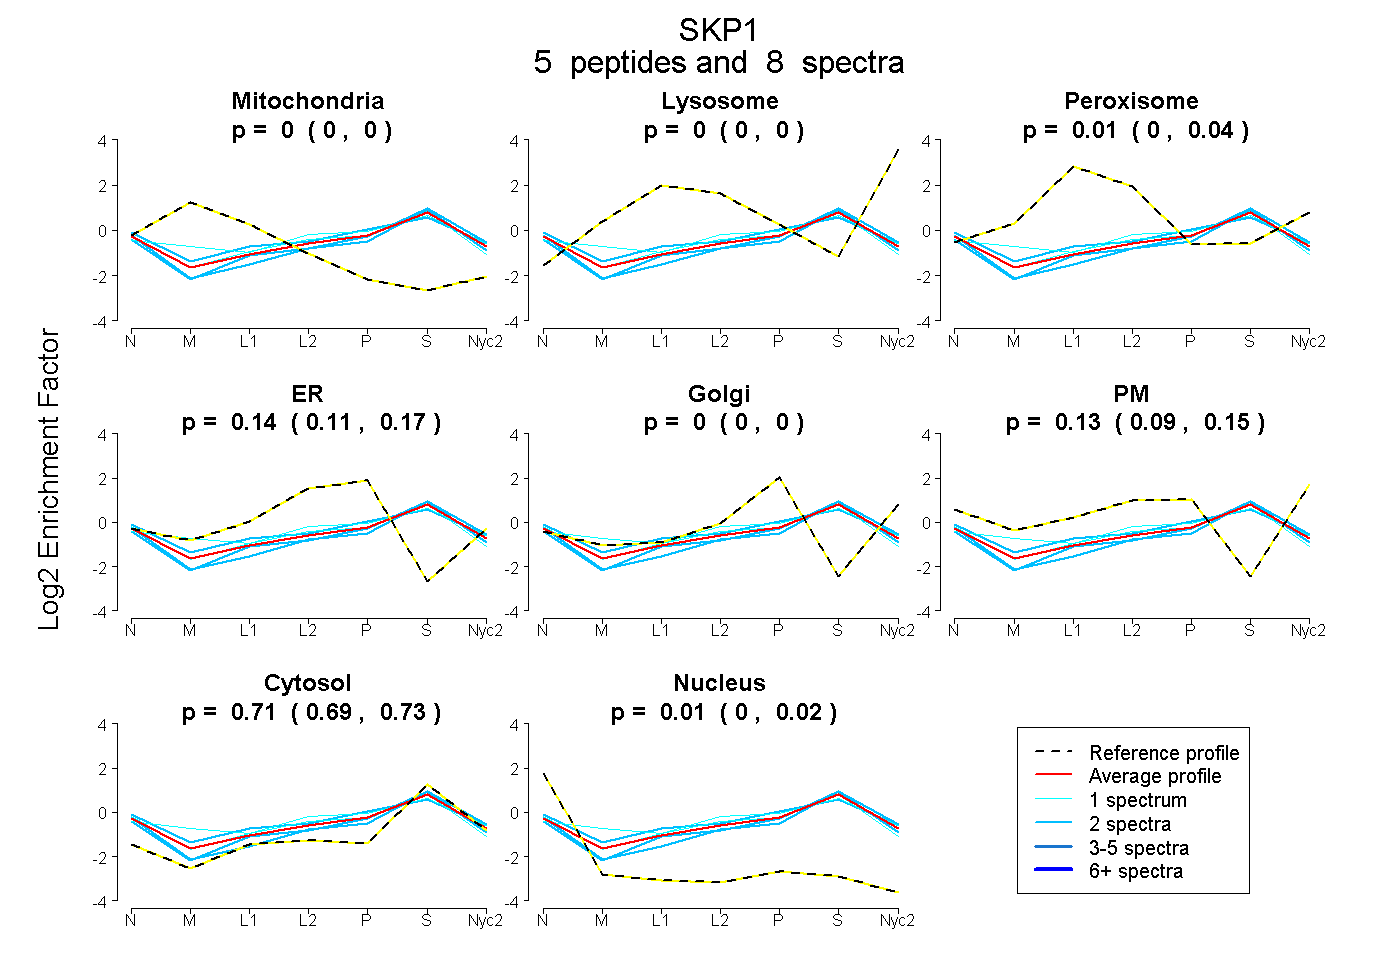
0.000 | 0.000
0.000 | 0.000
0.000 | 0.036
0.111 | 0.168
0.000 | 0.000
0.091 | 0.154
0.691 | 0.726
0.000 | 0.019
2peptides
spectra
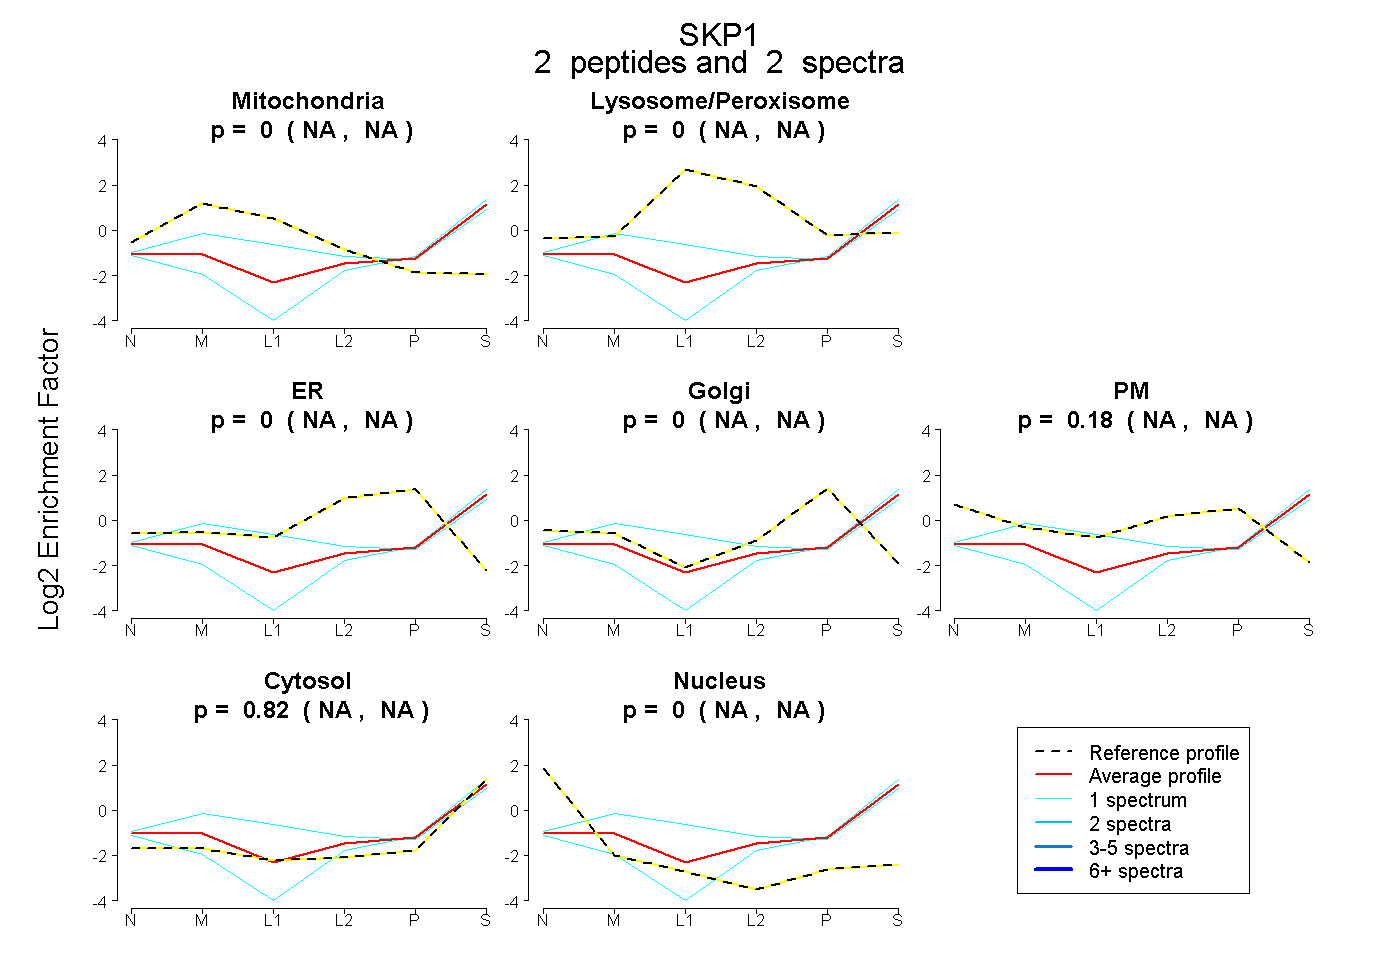
NA | NA
NA | NA
NA | NA
NA | NA
NA | NA
NA | NA
NA | NA
| Plot | Mito | Lyso | Perox | ER | Golgi | PM | Cytosol | Nucleus | |||||
| Expt A |
5 peptides |
8 spectra |
|
0.000 0.000 | 0.000 |
0.000 0.000 | 0.000 |
0.012 0.000 | 0.036 |
0.141 0.111 | 0.168 |
0.000 0.000 | 0.000 |
0.127 0.091 | 0.154 |
0.711 0.691 | 0.726 |
0.008 0.000 | 0.019 |
||
| Plot | Mito | Lyso or Perox | ER | Golgi | PM | Cytosol | Nucleus | ||||||
| Expt B |
2 peptides |
2 spectra |
|
0.000 NA | NA |
0.000 NA | NA |
0.000 NA | NA |
0.000 NA | NA |
0.185 NA | NA |
0.815 NA | NA |
0.000 NA | NA |
| 1 spectrum, TDDIPVWDQEFLK | 0.211 | 0.206 | 0.000 | 0.000 | 0.000 | 0.583 | 0.000 | |||
| 1 spectrum, NDFTEEEEAQVR | 0.000 | 0.000 | 0.000 | 0.083 | 0.000 | 0.881 | 0.037 |
| Plot | Lyso | Other | |||||||||||
| Expt C |
5 peptides |
19 spectra |
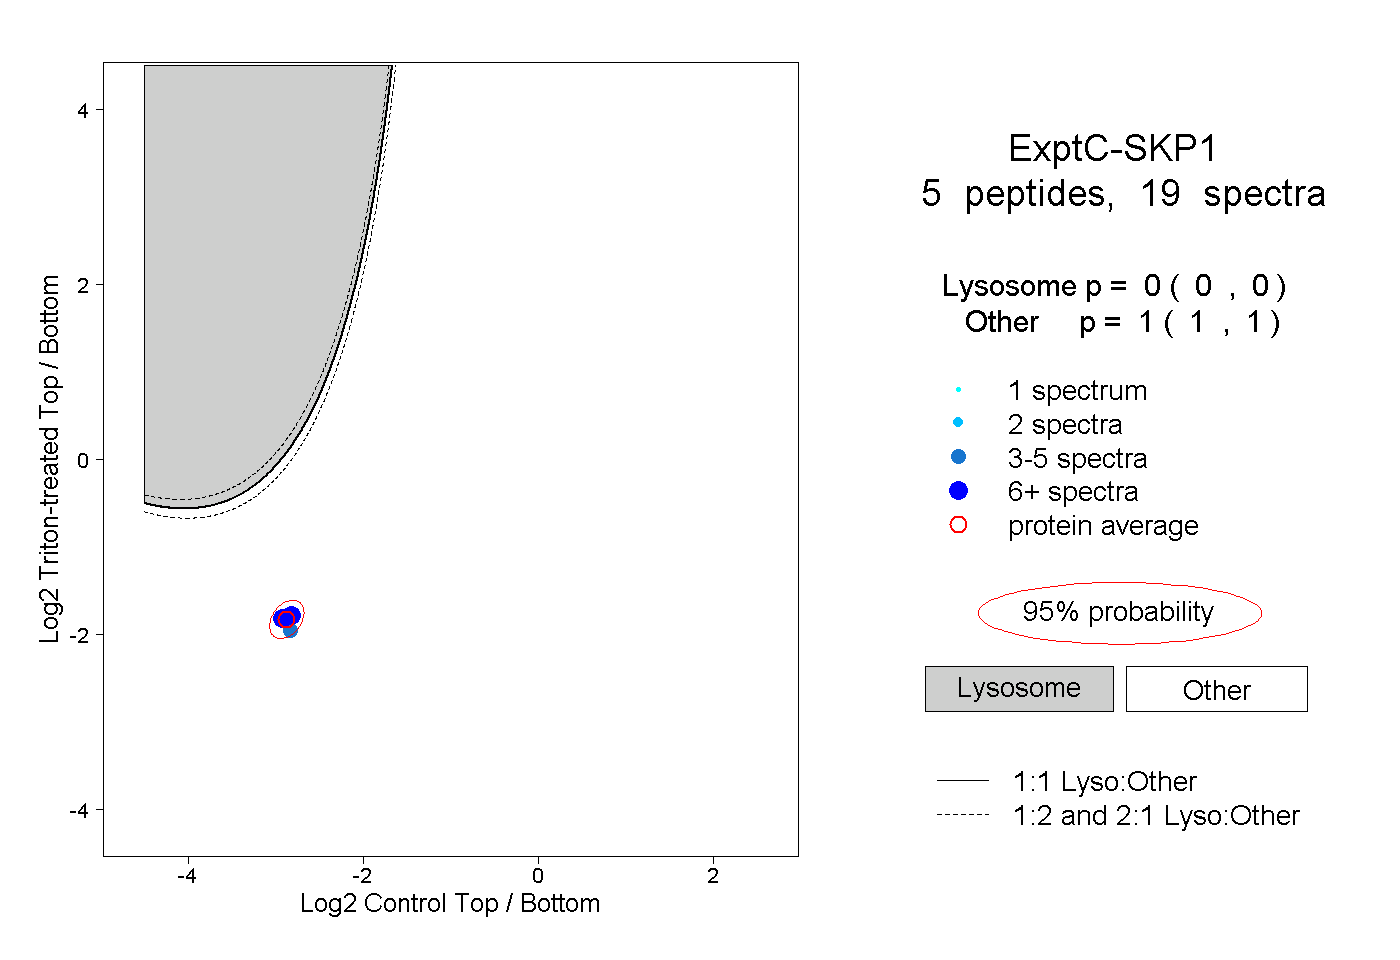 |
0.000 0.000 | 0.000 |
1.000 1.000 | 1.000 |