 5
5peptides
spectra
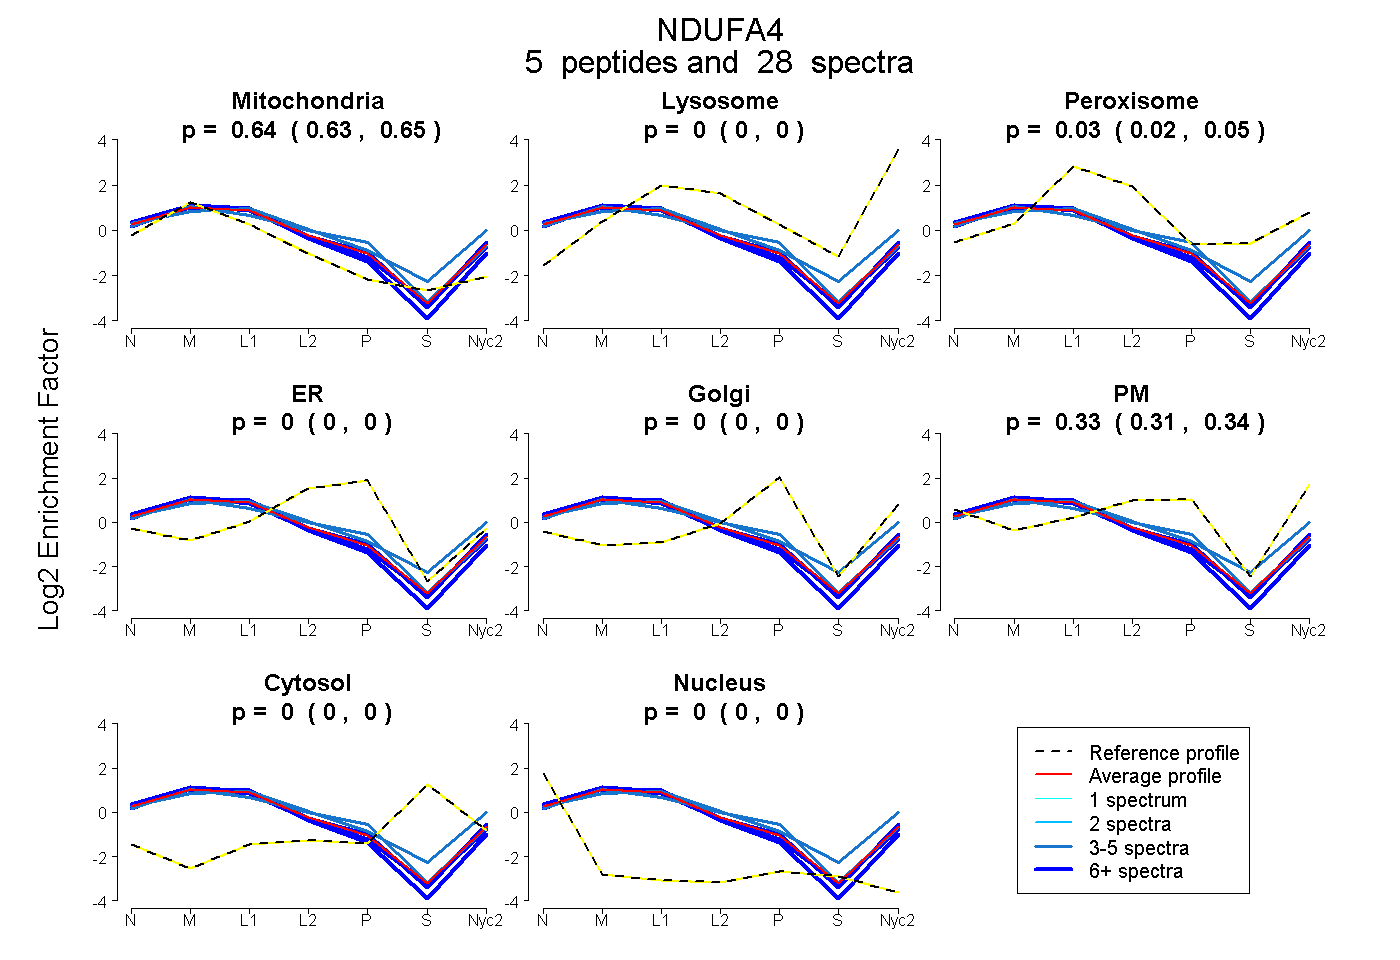
0.627 | 0.646
0.000 | 0.001
0.020 | 0.047
0.000 | 0.000
0.000 | 0.000
0.314 | 0.340
0.000 | 0.000
0.000 | 0.000
4peptides
spectra
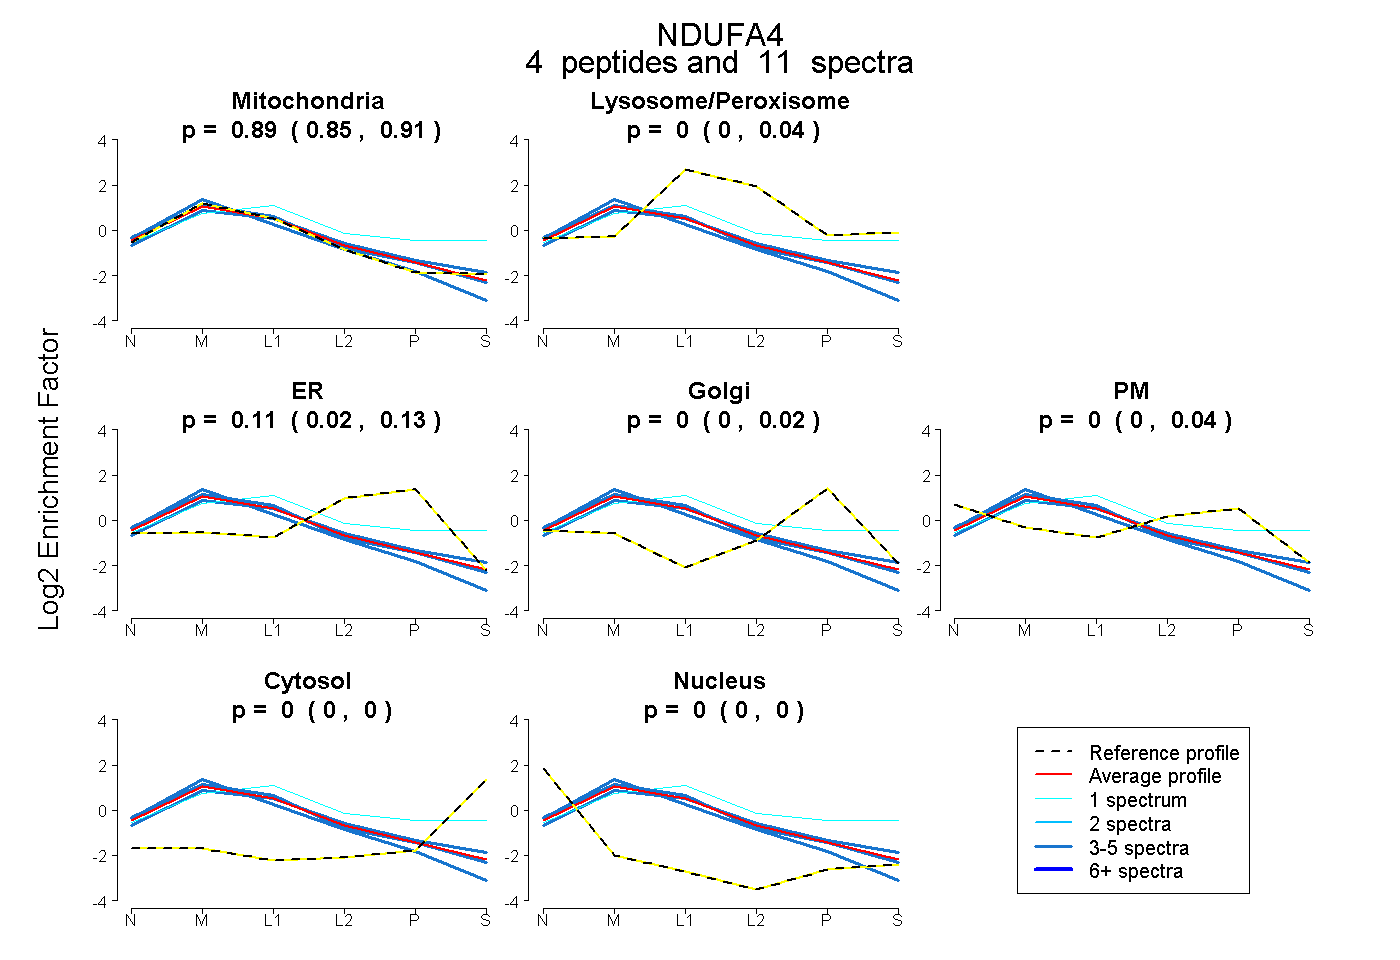
0.847 | 0.908
0.000 | 0.040
0.019 | 0.135
0.000 | 0.022
0.000 | 0.041
0.000 | 0.000
0.000 | 0.000
5peptides
spectra
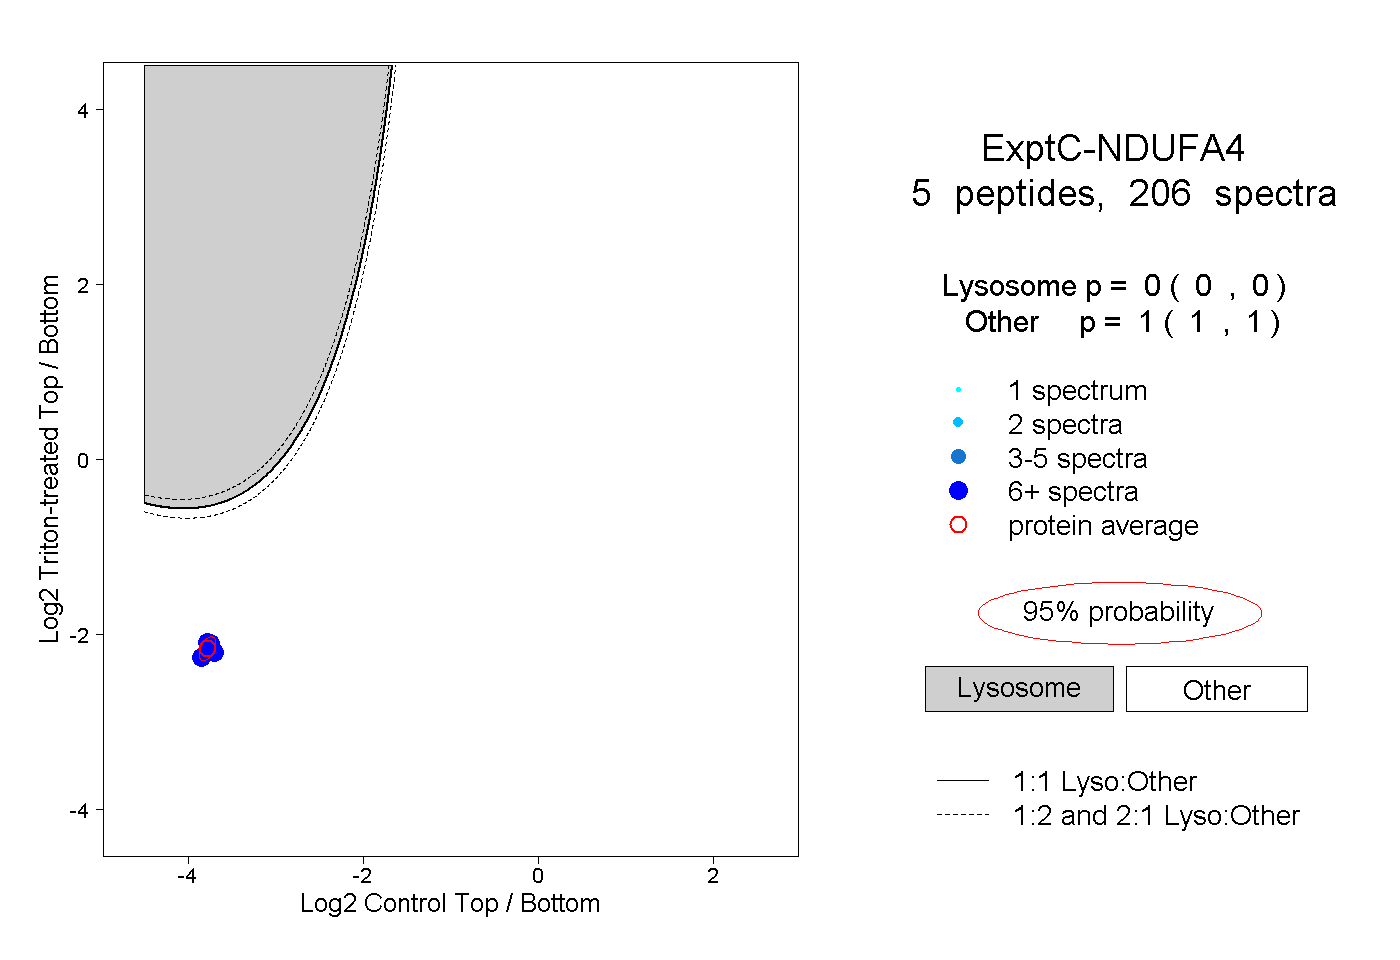
0.000 | 0.000
1.000 | 1.000
3peptides
spectra
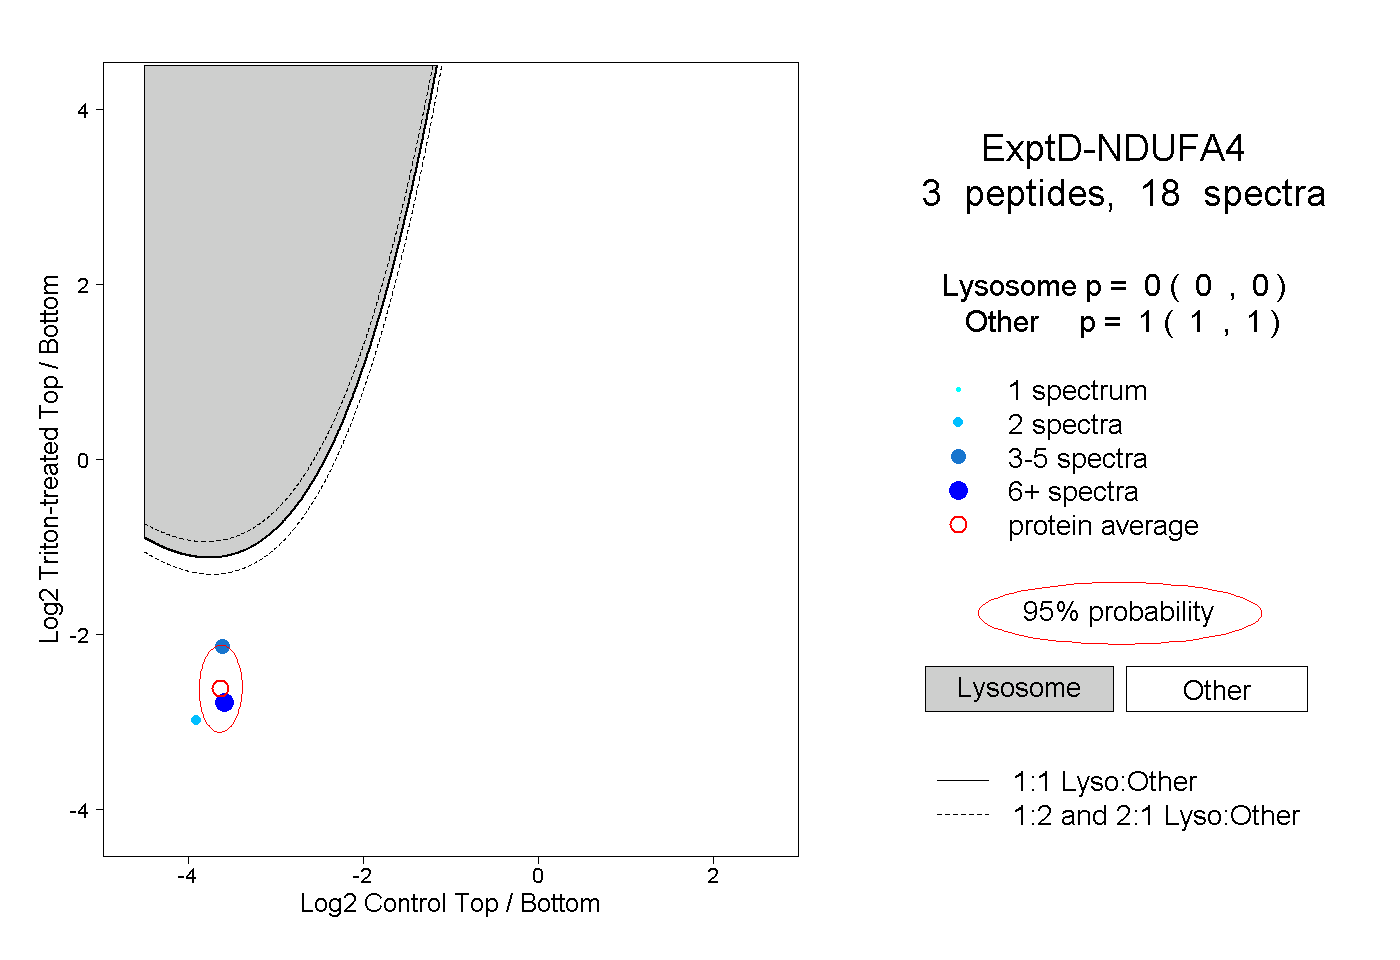
0.000 | 0.000
1.000 | 1.000