 5
5peptides
spectra
0.627 | 0.646
0.000 | 0.001
0.020 | 0.047
0.000 | 0.000
0.000 | 0.000
0.314 | 0.340
0.000 | 0.000
0.000 | 0.000
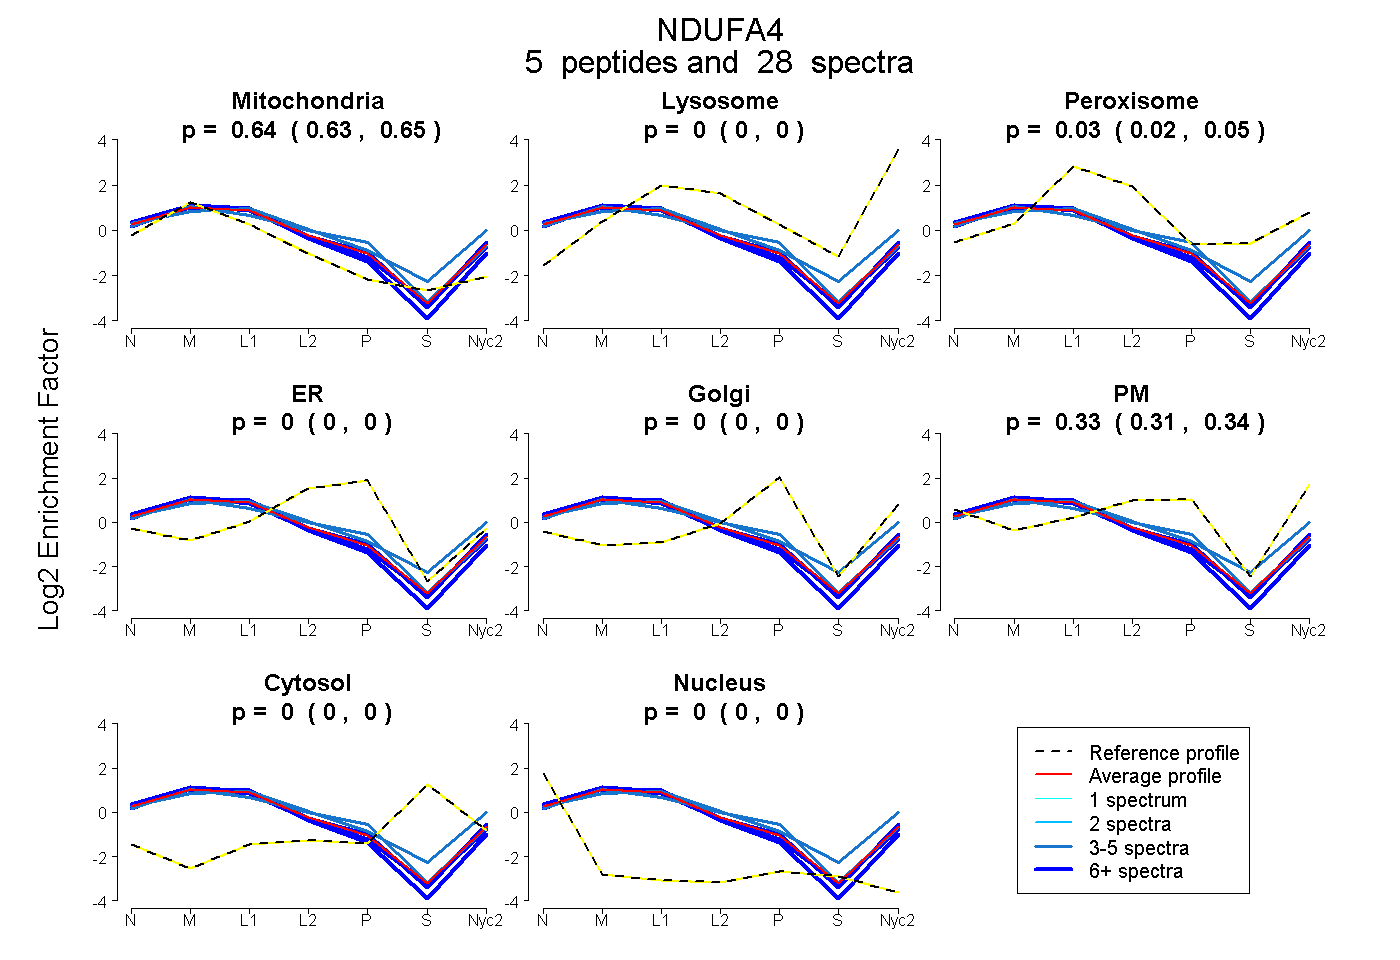
| Plot | Mito | Lyso | Perox | ER | Golgi | PM | Cytosol | Nucleus | |||||
| Expt A |
5 peptides |
28 spectra |
|
0.637 0.627 | 0.646 |
0.000 0.000 | 0.001 |
0.035 0.020 | 0.047 |
0.000 0.000 | 0.000 |
0.000 0.000 | 0.000 |
0.328 0.314 | 0.340 |
0.000 0.000 | 0.000 |
0.000 0.000 | 0.000 |
| 6 spectra, LGPNEQYK | 0.631 | 0.003 | 0.012 | 0.000 | 0.000 | 0.354 | 0.000 | 0.000 | ||
| 7 spectra, LALFNPDVSWDR | 0.742 | 0.000 | 0.000 | 0.000 | 0.000 | 0.258 | 0.000 | 0.000 | ||
| 5 spectra, QILGQAK | 0.490 | 0.040 | 0.159 | 0.000 | 0.000 | 0.311 | 0.000 | 0.000 | ||
| 3 spectra, NNPEPWNK | 0.582 | 0.000 | 0.001 | 0.103 | 0.000 | 0.314 | 0.000 | 0.000 | ||
| 7 spectra, FYSVNVDYSK | 0.689 | 0.015 | 0.023 | 0.000 | 0.000 | 0.273 | 0.000 | 0.000 |
| Plot | Mito | Lyso or Perox | ER | Golgi | PM | Cytosol | Nucleus | ||||||
| Expt B |
4 peptides |
11 spectra |
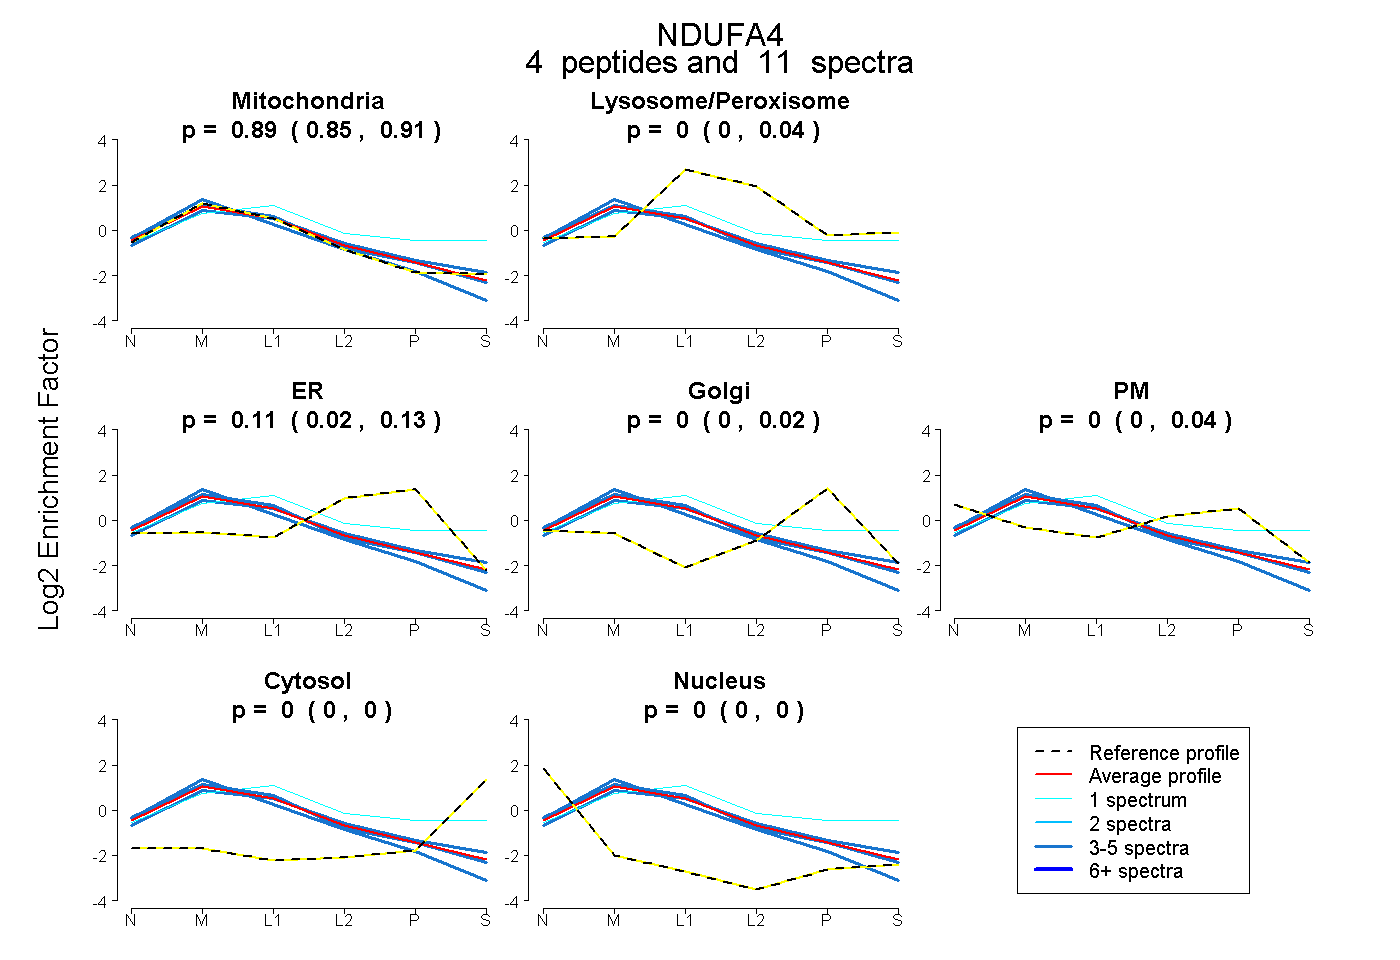 |
0.888 0.847 | 0.908 |
0.000 0.000 | 0.040 |
0.112 0.019 | 0.135 |
0.000 0.000 | 0.022 |
0.000 0.000 | 0.041 |
0.000 0.000 | 0.000 |
0.000 0.000 | 0.000 |
|||
| Plot | Lyso | Other | |||||||||||
| Expt C |
5 peptides |
206 spectra |
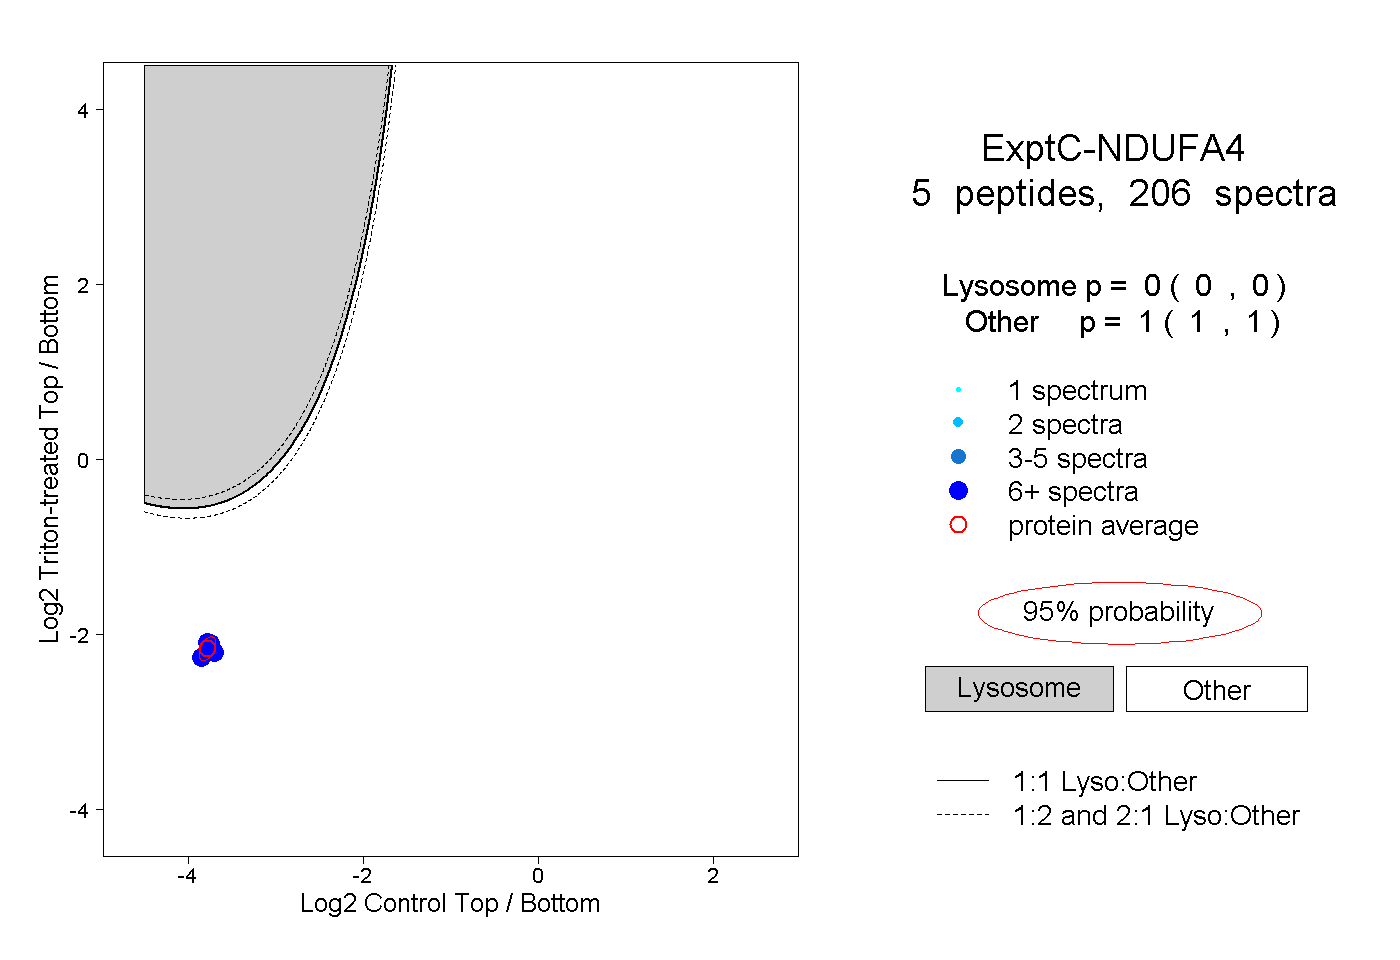 |
0.000 0.000 | 0.000 |
1.000 1.000 | 1.000 |
||||||||
| Plot | Lyso | Other | |||||||||||
| Expt D |
3 peptides |
18 spectra |
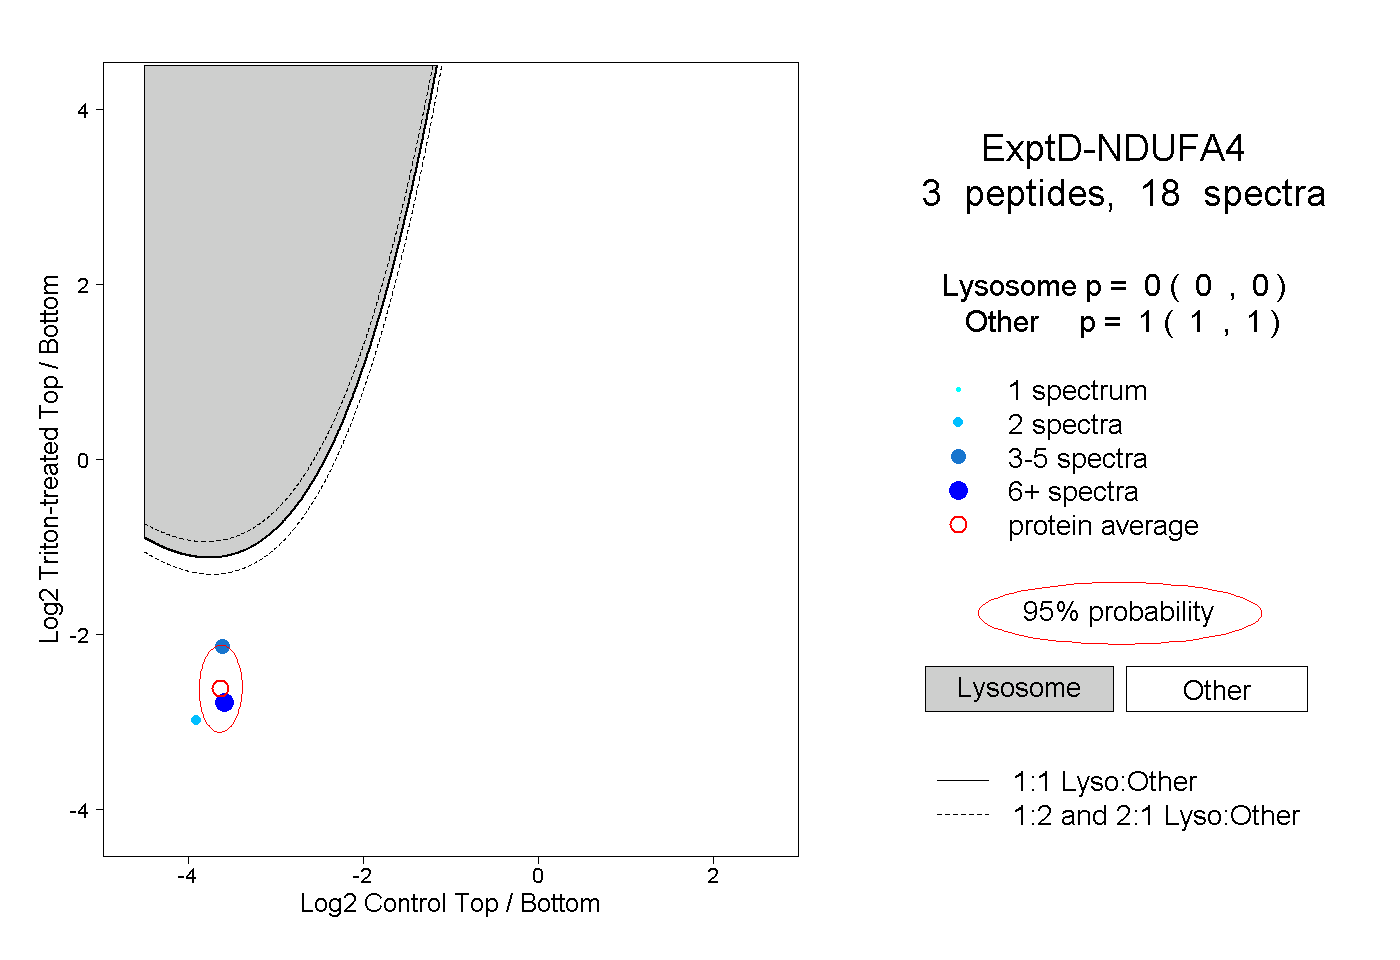 |
0.000 0.000 | 0.000 |
1.000 1.000 | 1.000 |