NDUFA4
[ENSRNOP00000007567]
Main page
| | | Plot |
Mito |
Lyso |
|
Perox |
ER |
Golgi |
PM |
Cytosol |
Nucleus |
|
| Expt A |
 5
5
peptides |
28
spectra |
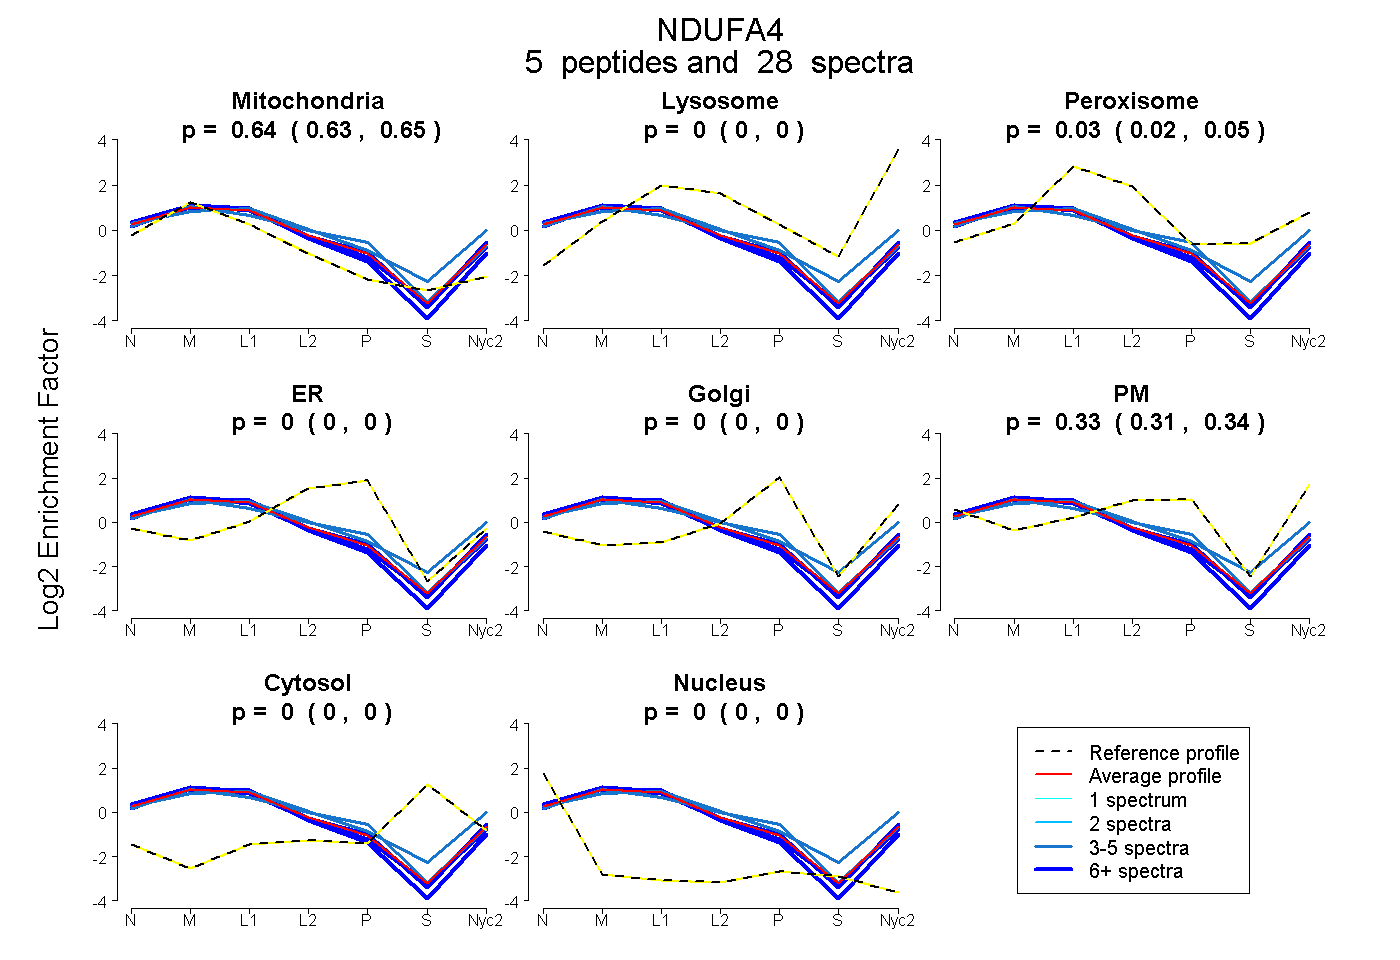 |
0.637
0.627 | 0.646 |
0.000
0.000 | 0.001 |
|
0.035
0.020 | 0.047 |
0.000
0.000 | 0.000 |
0.000
0.000 | 0.000 |
0.328
0.314 | 0.340 |
0.000
0.000 | 0.000 |
0.000
0.000 | 0.000 |
|
| | | Plot |
Mito |
|
Lyso or Perox |
|
ER |
Golgi |
PM |
Cytosol |
Nucleus |
|
| Expt B |
4
peptides |
11
spectra |
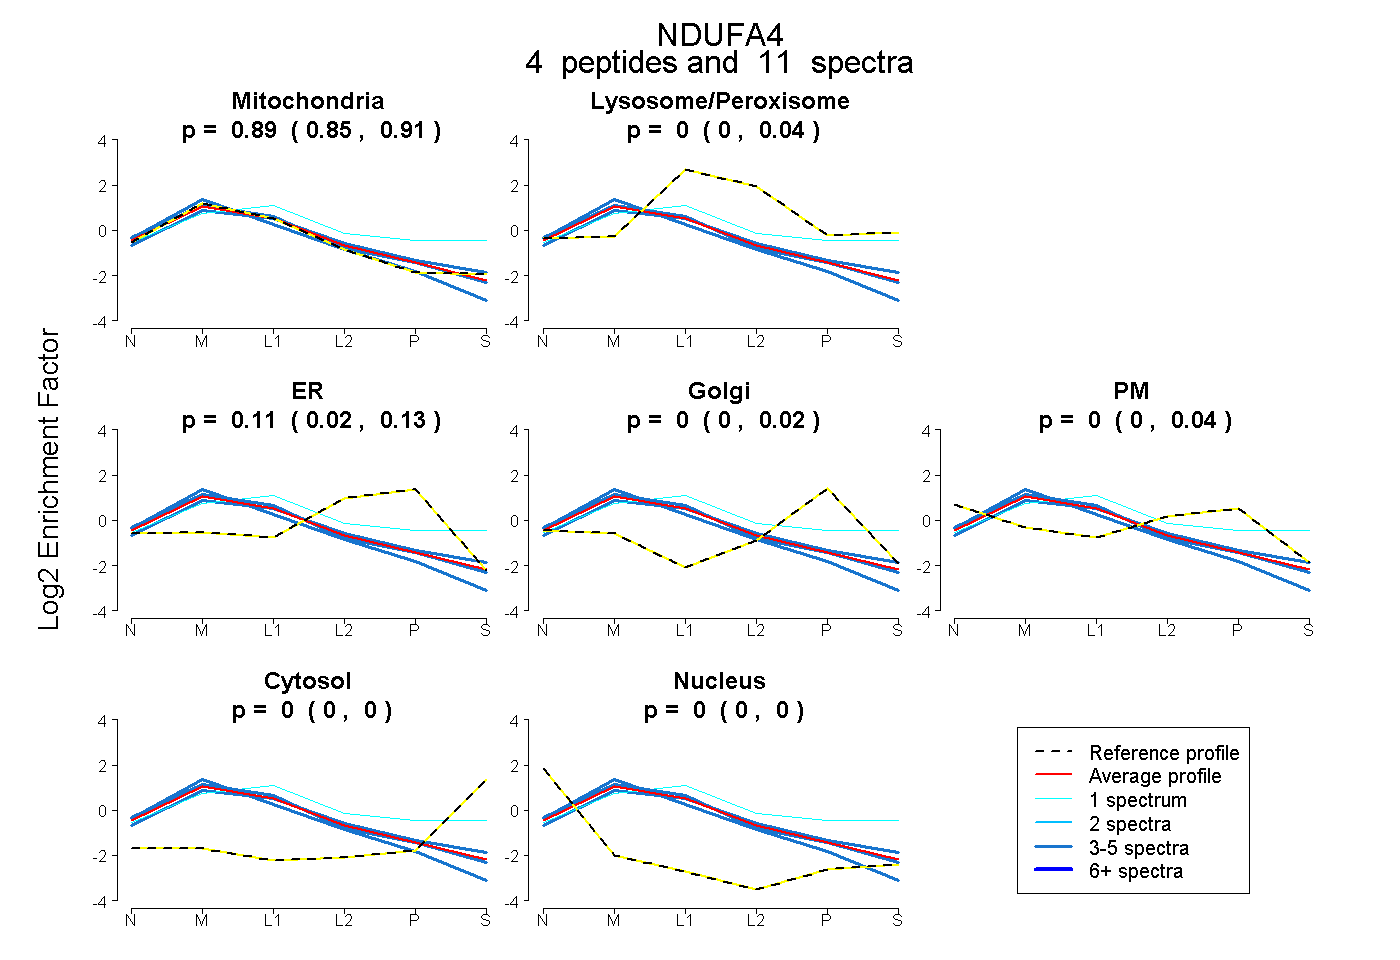 |
0.888
0.847 | 0.908 |
|
0.000
0.000 | 0.040 |
|
0.112
0.019 | 0.135 |
0.000
0.000 | 0.022 |
0.000
0.000 | 0.041 |
0.000
0.000 | 0.000 |
0.000
0.000 | 0.000 |
|
| 4 spectra, LGPNEQYK |
0.818 |
|
0.066 |
|
0.068 |
0.048 |
0.000 |
0.000 |
0.000 |
|
| 3 spectra, QILGQAK |
0.893 |
|
0.000 |
|
0.031 |
0.000 |
0.076 |
0.000 |
0.000 |
|
| 1 spectrum, NNPEPWNK |
0.406 |
|
0.417 |
|
0.000 |
0.095 |
0.000 |
0.082 |
0.000 |
|
| 3 spectra, FYSVNVDYSK |
0.942 |
|
0.000 |
|
0.021 |
0.000 |
0.000 |
0.000 |
0.038 |
|
| | | Plot |
|
Lyso |
|
|
|
|
|
|
|
Other |
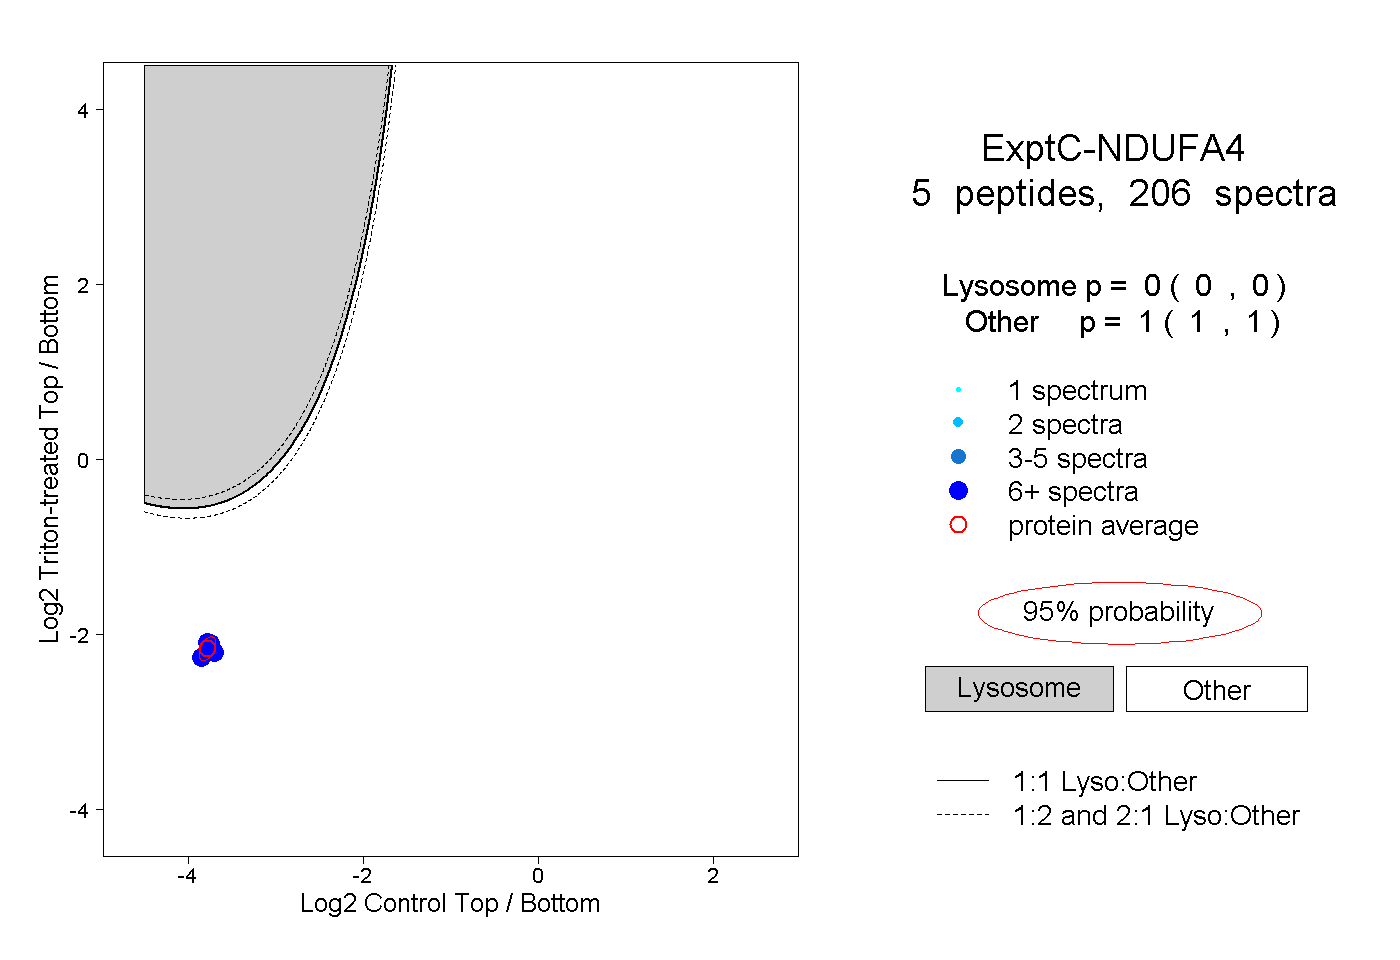
| Expt C |
5
peptides |
206
spectra |
 |
|
0.000
0.000 | 0.000 |
|
|
|
|
|
|
|
1.000
1.000 | 1.000 |
| | | Plot |
|
Lyso |
|
|
|
|
|
|
|
Other |
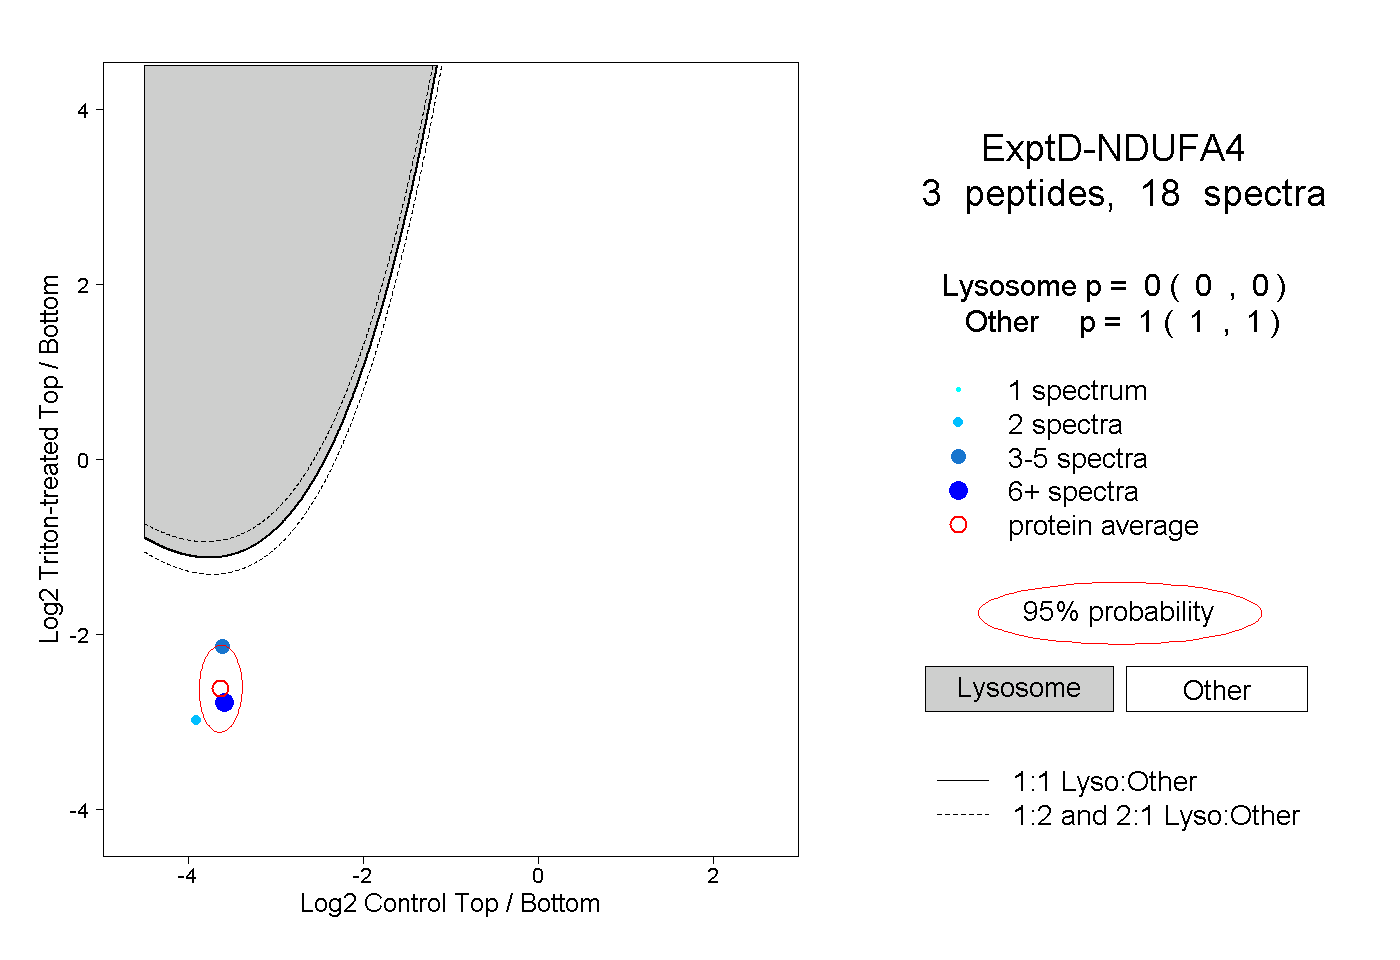
| Expt D |
3
peptides |
18
spectra |
 |
|
0.000
0.000 | 0.000 |
|
|
|
|
|
|
|
1.000
1.000 | 1.000 |