 25
25peptides
spectra
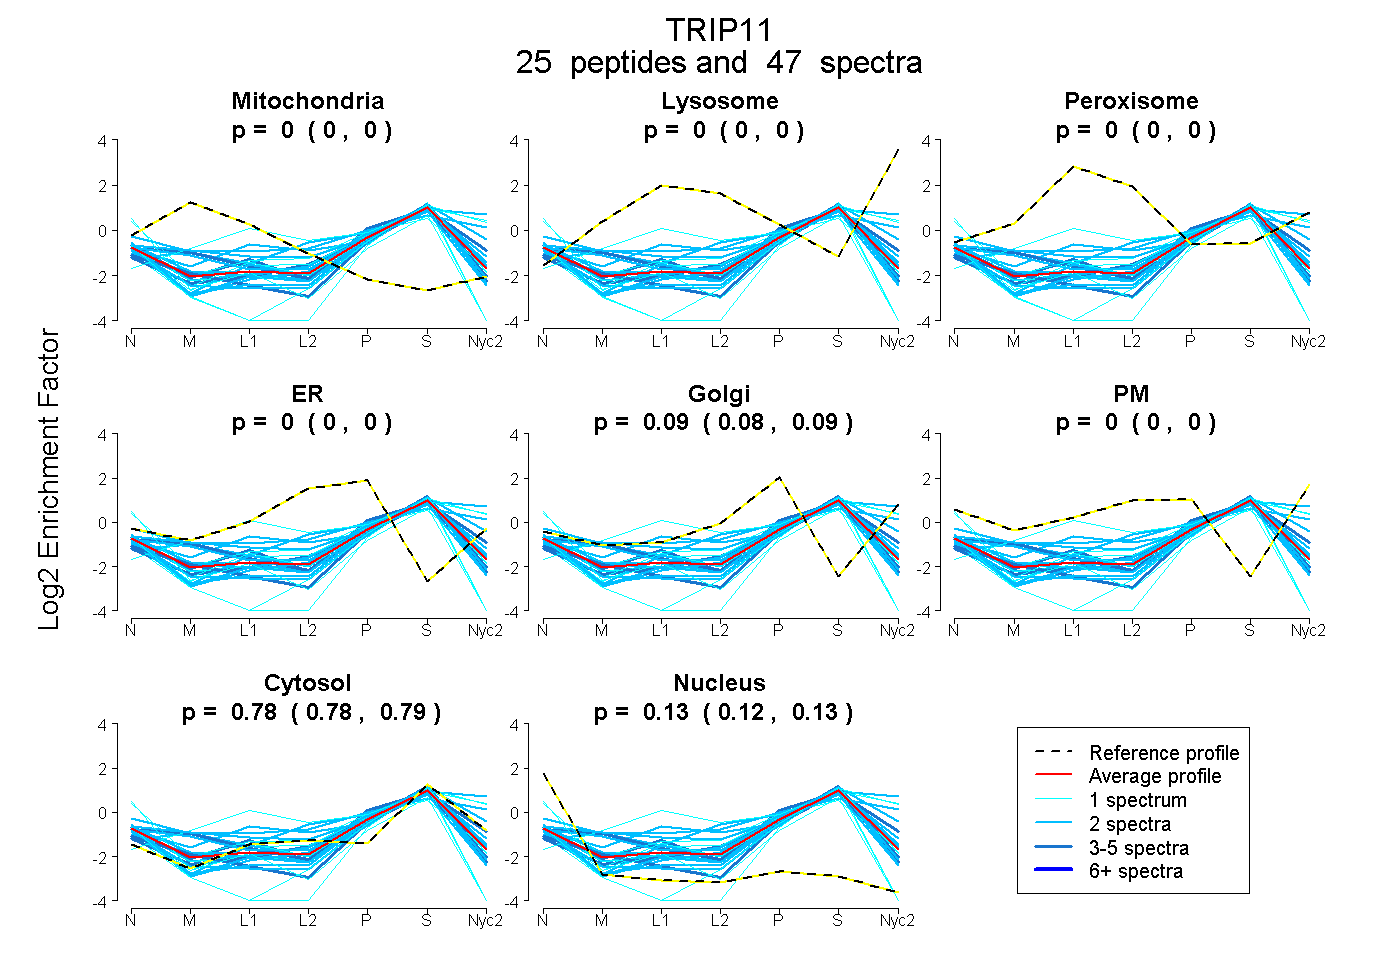
0.000 | 0.000
0.000 | 0.000
0.000 | 0.000
0.000 | 0.000
0.082 | 0.092
0.000 | 0.000
0.781 | 0.787
0.122 | 0.133
7peptides
spectra
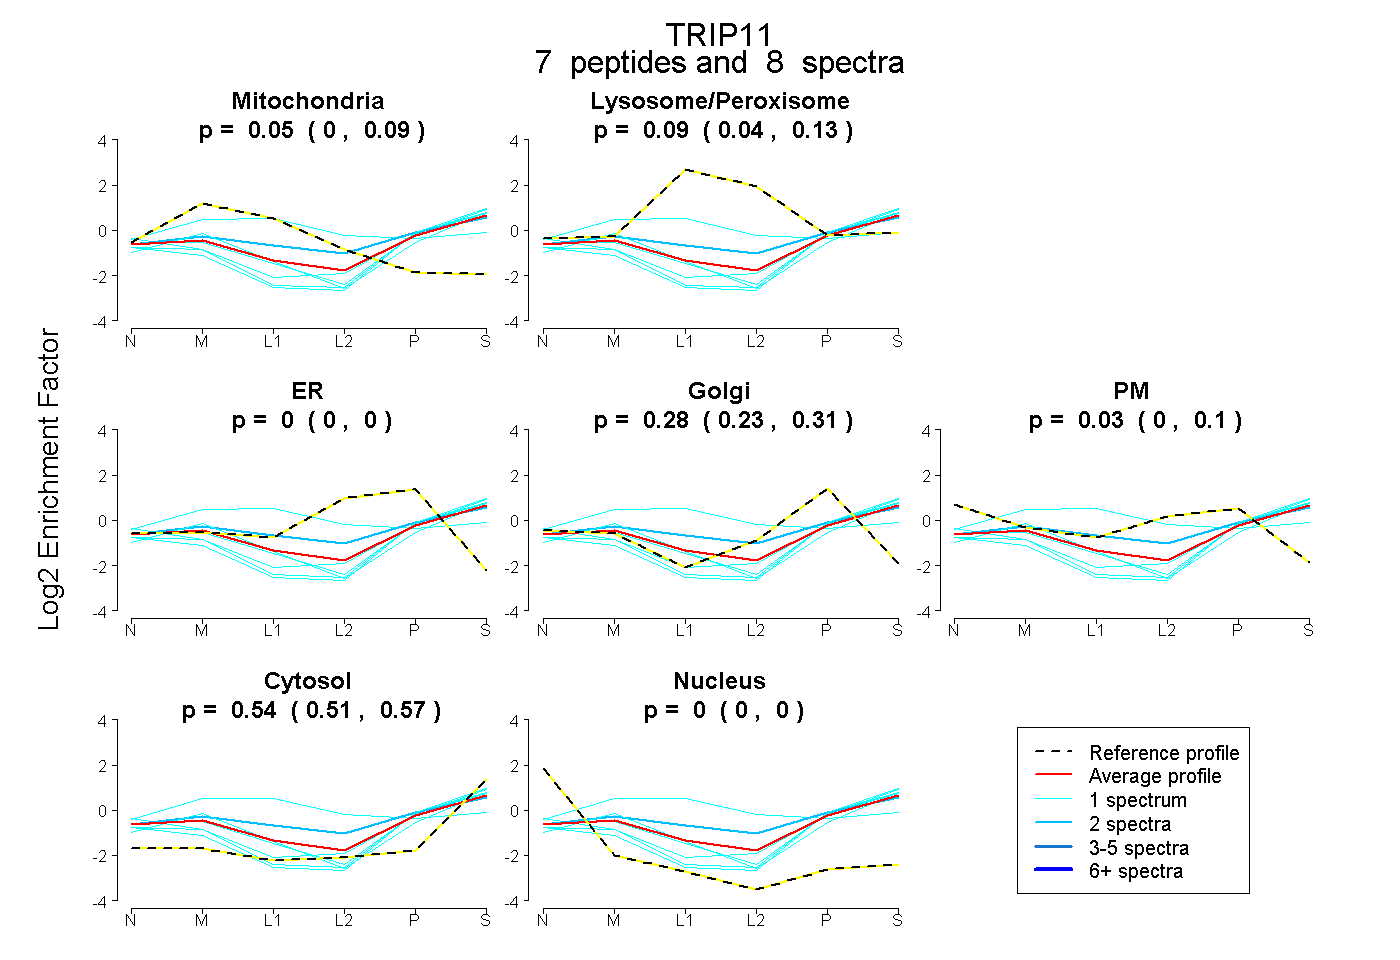
0.003 | 0.090
0.037 | 0.135
0.000 | 0.000
0.233 | 0.309
0.000 | 0.102
0.513 | 0.568
0.000 | 0.000
8peptides
spectra
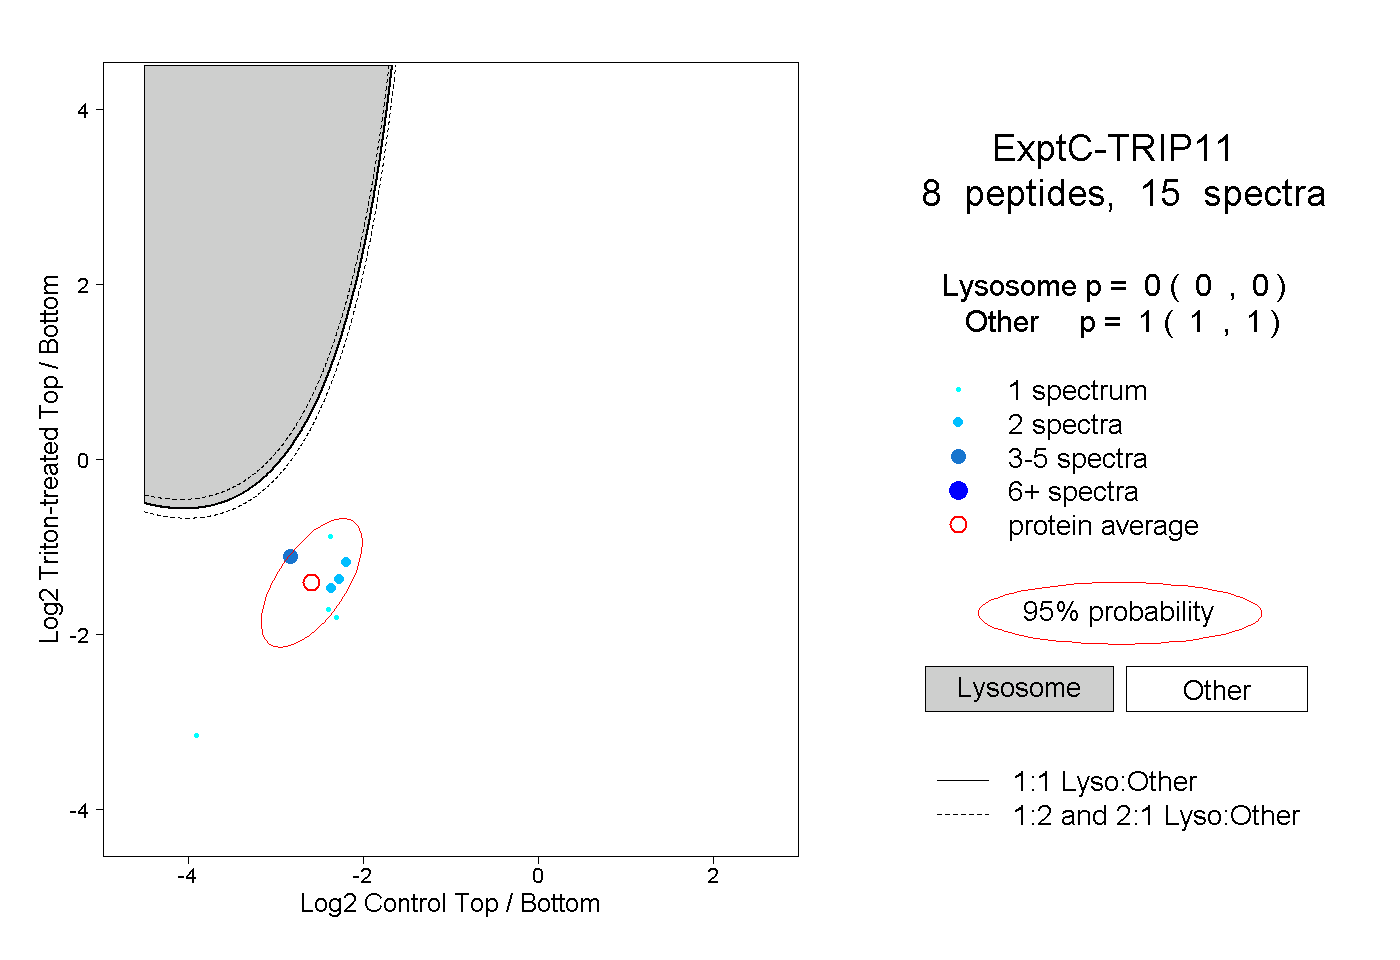
0.000 | 0.000
1.000 | 1.000
1peptide
spectrum
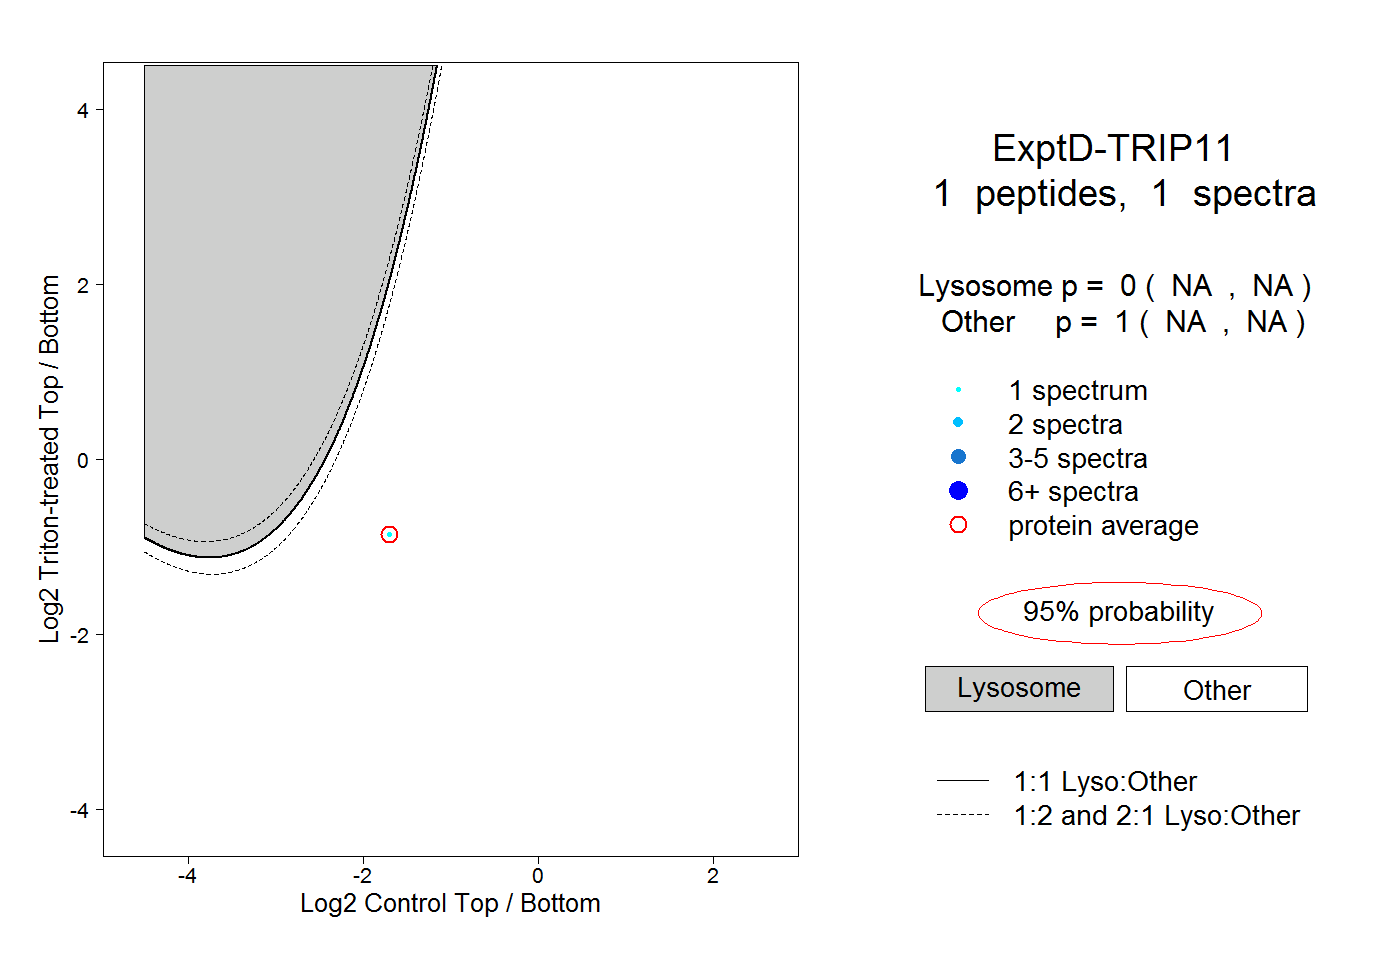
NA | NA
NA | NA