TRIP11
[ENSRNOP00000007061]
Main page
| | | Plot |
Mito |
Lyso |
|
Perox |
ER |
Golgi |
PM |
Cytosol |
Nucleus |
|
| Expt A |
 25
25
peptides |
47
spectra |
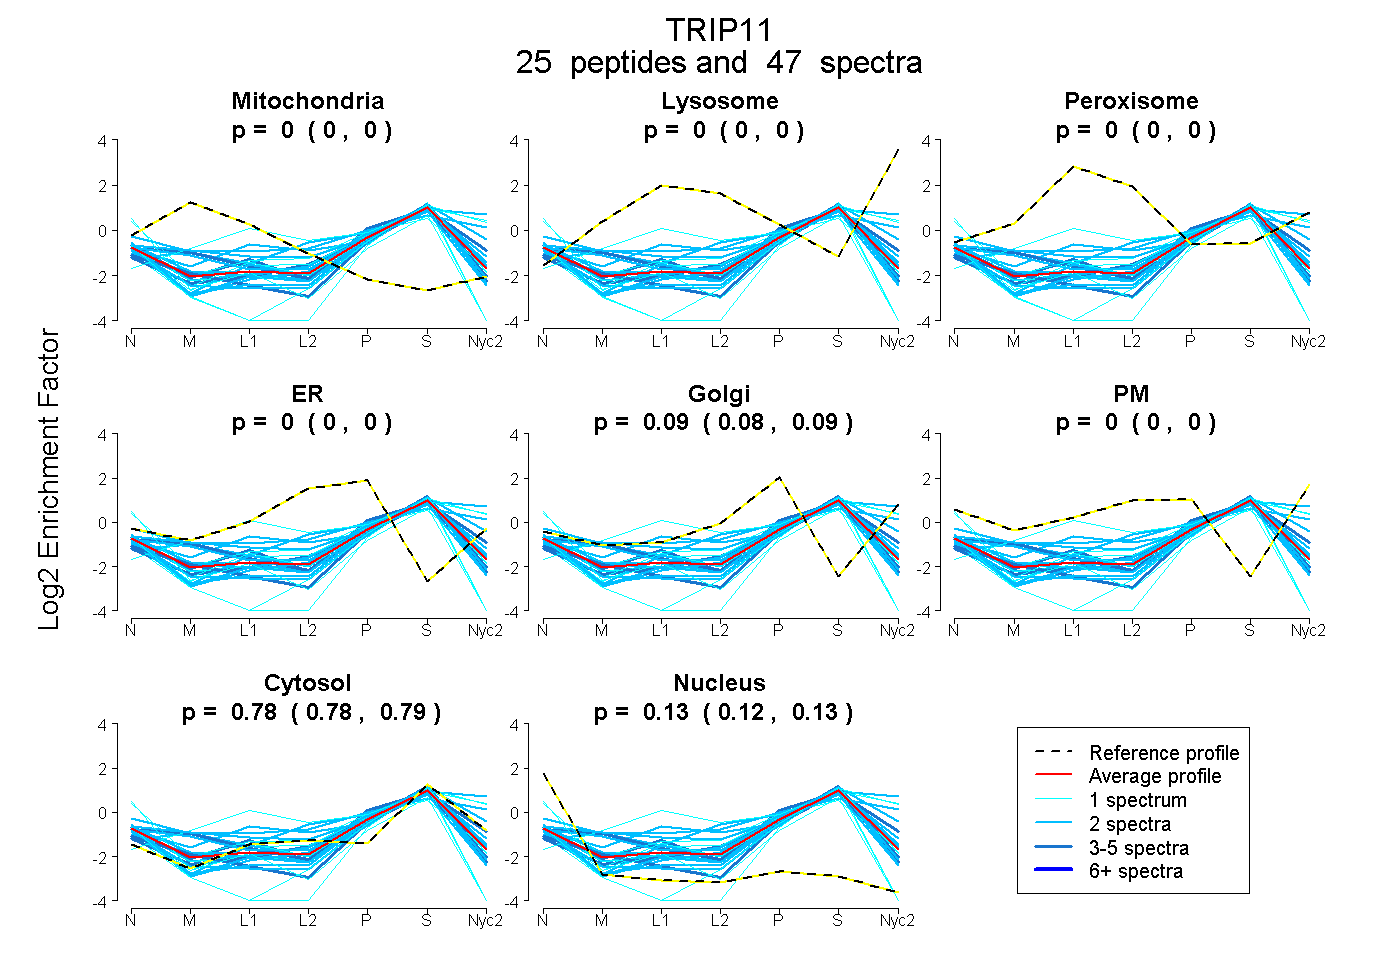 |
0.000
0.000 | 0.000 |
0.000
0.000 | 0.000 |
|
0.000
0.000 | 0.000 |
0.000
0.000 | 0.000 |
0.088
0.082 | 0.092 |
0.000
0.000 | 0.000 |
0.785
0.781 | 0.787 |
0.128
0.122 | 0.133 |
|
| | | Plot |
Mito |
|
Lyso or Perox |
|
ER |
Golgi |
PM |
Cytosol |
Nucleus |
|
| Expt B |
7
peptides |
8
spectra |
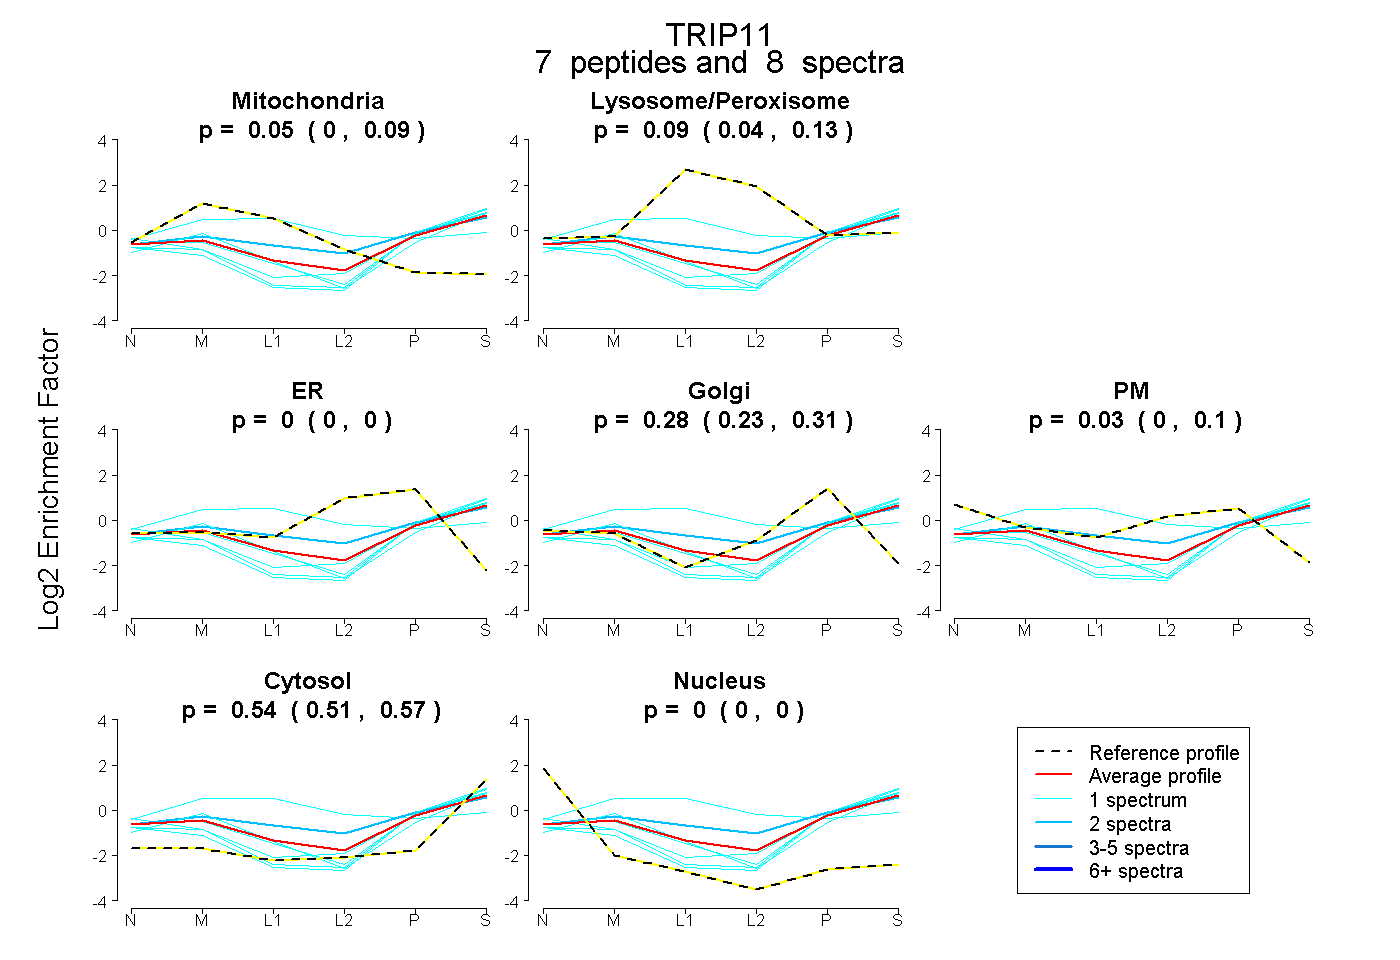 |
0.055
0.003 | 0.090 |
|
0.093
0.037 | 0.135 |
|
0.000
0.000 | 0.000 |
0.283
0.233 | 0.309 |
0.027
0.000 | 0.102 |
0.542
0.513 | 0.568 |
0.000
0.000 | 0.000 |
|
| 2 spectra, NLFIGHFHTPK |
0.036 |
|
0.267 |
|
0.000 |
0.268 |
0.000 |
0.429 |
0.000 |
|
| 1 spectrum, EALAAEDR |
0.000 |
|
0.000 |
|
0.000 |
0.309 |
0.041 |
0.650 |
0.000 |
|
| 1 spectrum, VEDLVDQLSK |
0.192 |
|
0.000 |
|
0.000 |
0.186 |
0.000 |
0.622 |
0.000 |
|
| 1 spectrum, AVPVPEPR |
0.000 |
|
0.000 |
|
0.000 |
0.334 |
0.000 |
0.598 |
0.068 |
|
| 1 spectrum, AGELNQLLNAVK |
0.285 |
|
0.394 |
|
0.000 |
0.149 |
0.000 |
0.172 |
0.000 |
|
| 1 spectrum, ALAFEQLLK |
0.083 |
|
0.019 |
|
0.000 |
0.316 |
0.000 |
0.583 |
0.000 |
|
| 1 spectrum, QNEEELSTVR |
0.000 |
|
0.000 |
|
0.000 |
0.295 |
0.000 |
0.679 |
0.026 |
|
| | | Plot |
|
Lyso |
|
|
|
|
|
|
|
Other |
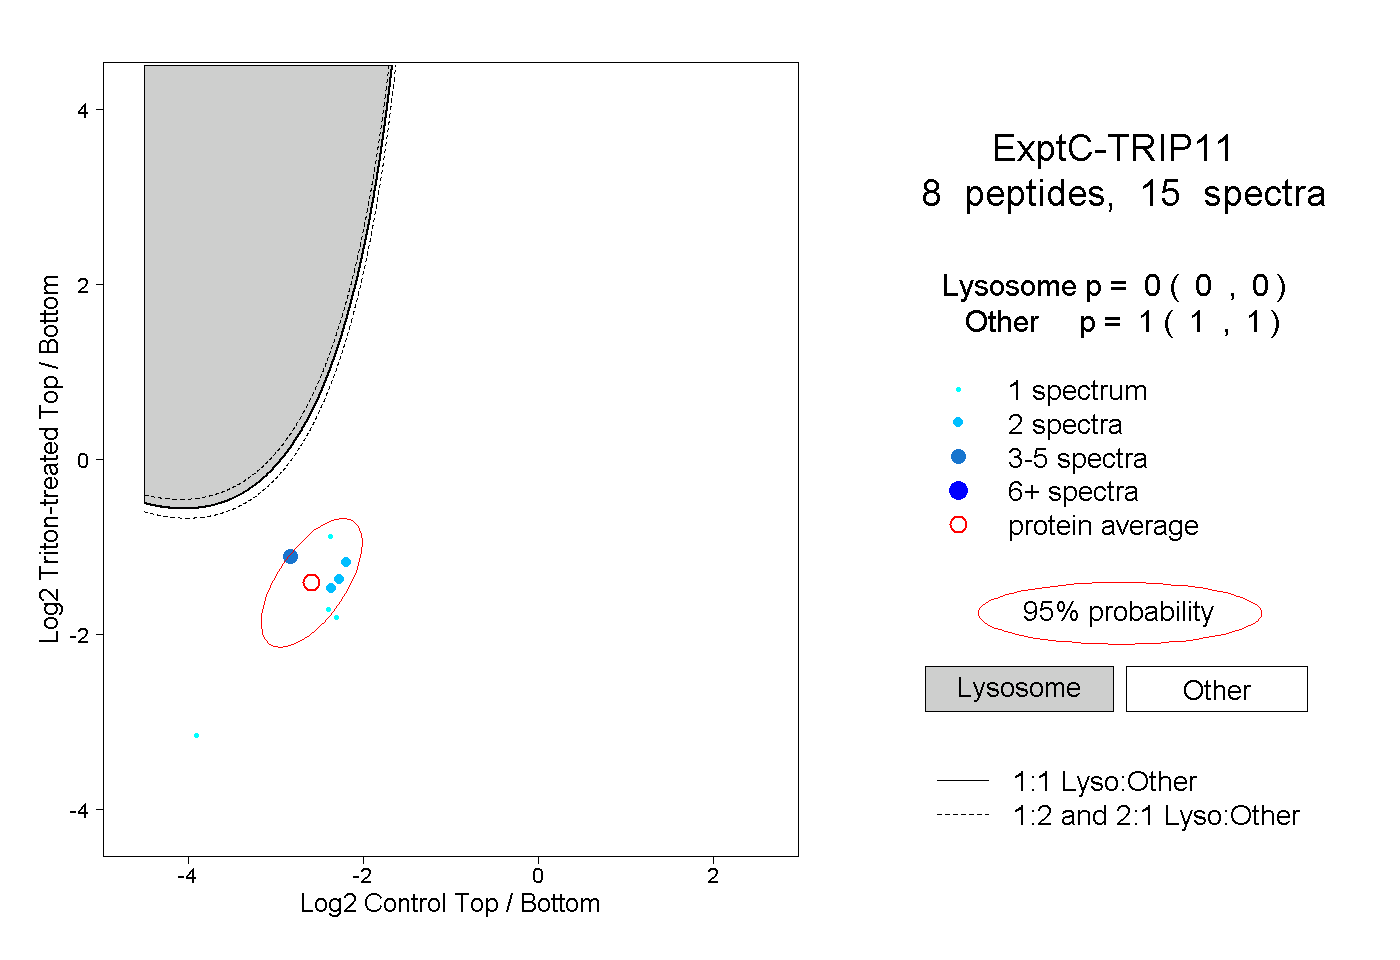
| Expt C |
8
peptides |
15
spectra |
 |
|
0.000
0.000 | 0.000 |
|
|
|
|
|
|
|
1.000
1.000 | 1.000 |
| | | Plot |
|
Lyso |
|
|
|
|
|
|
|
Other |
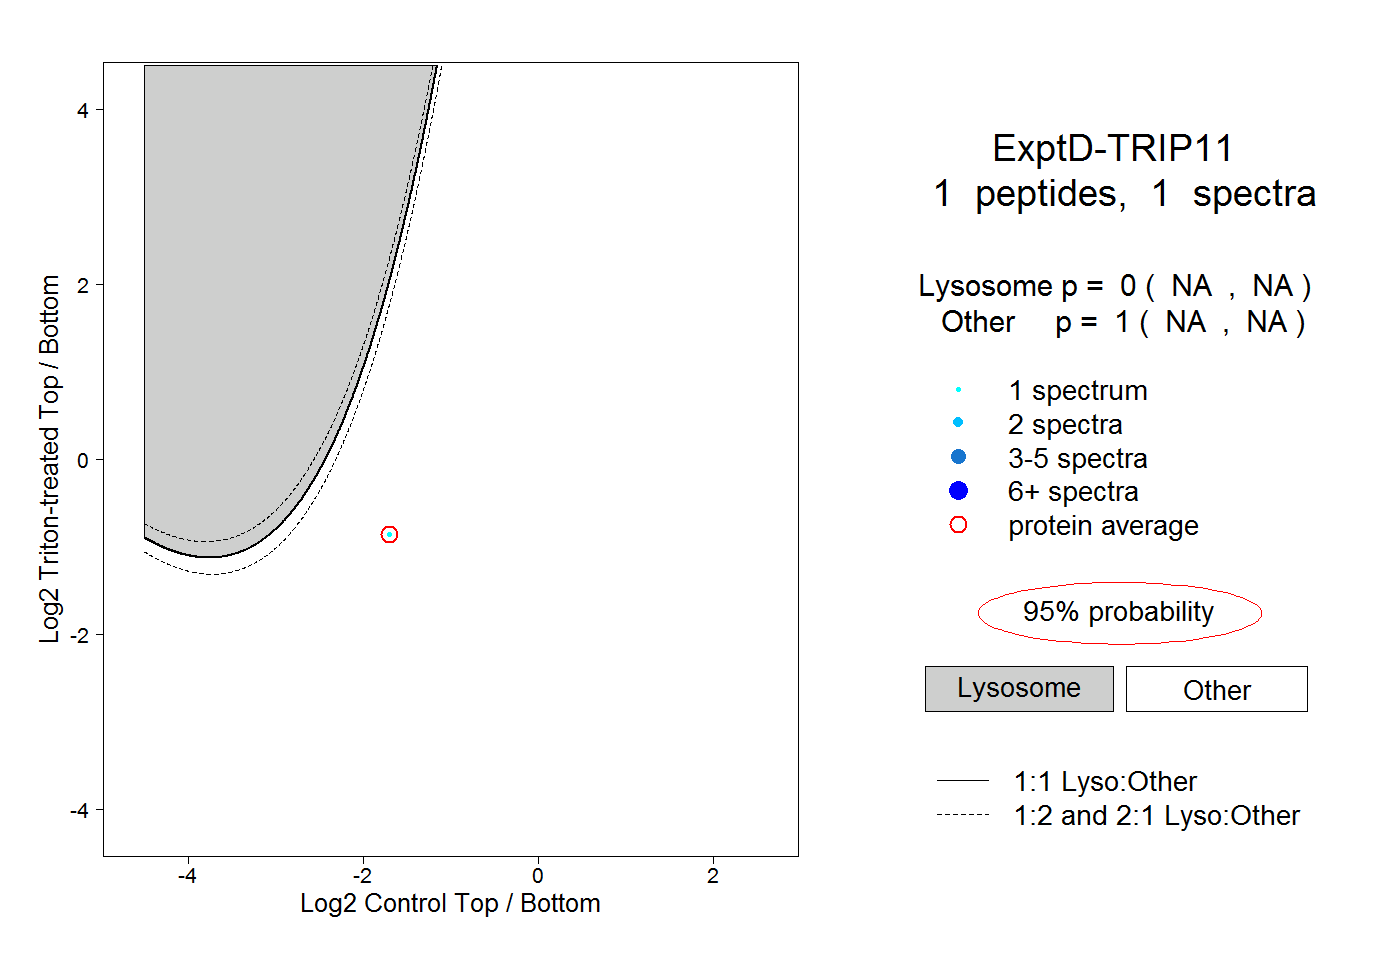
| Expt D |
1
peptide |
1
spectrum |
 |
|
0.000
NA | NA |
|
|
|
|
|
|
|
1.000
NA | NA |