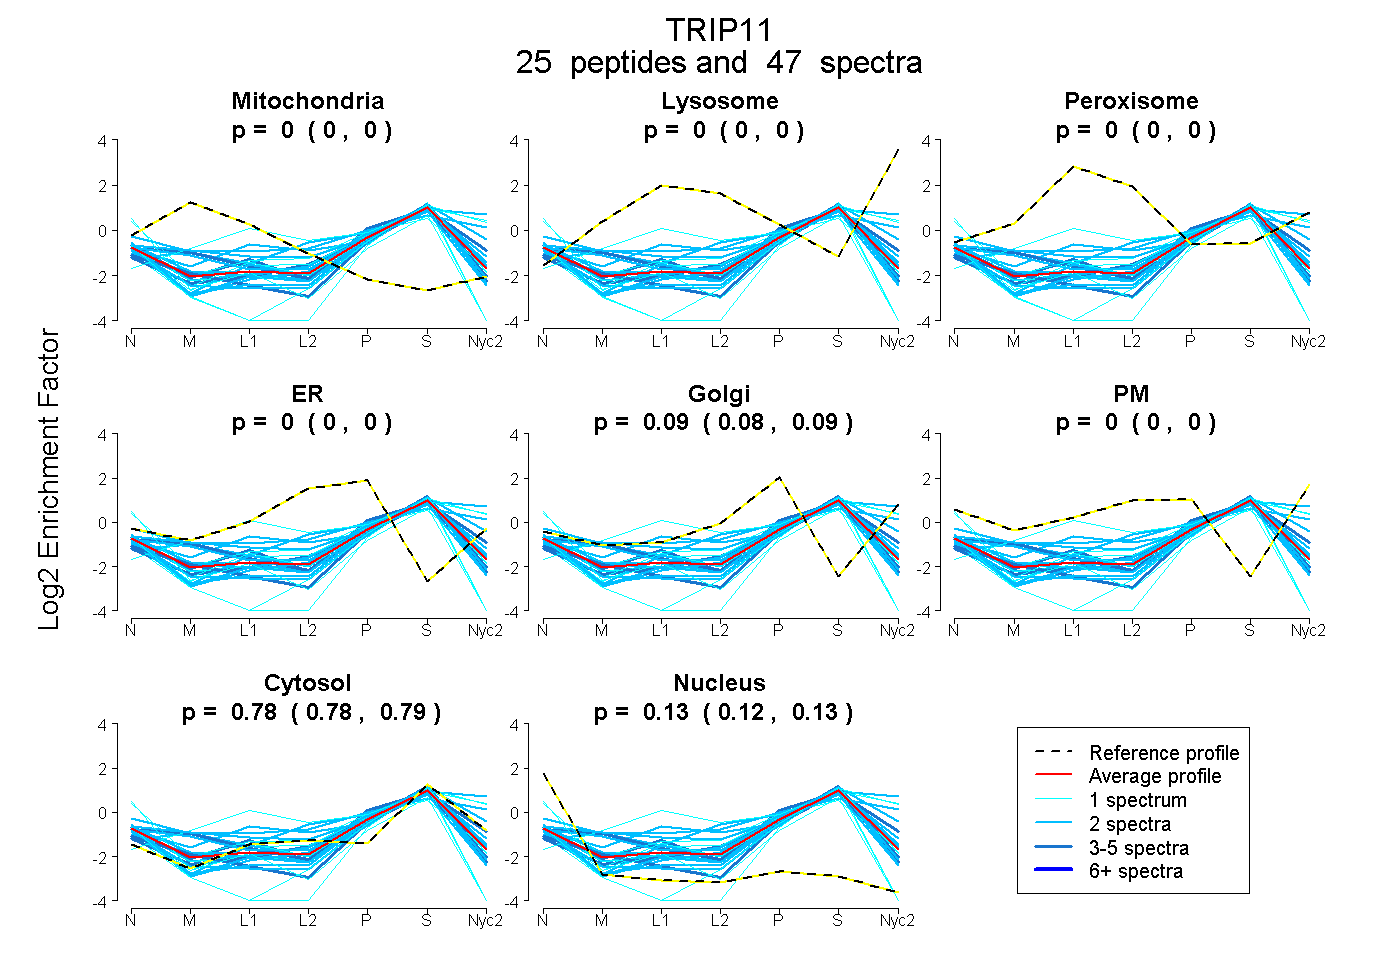
 25
25peptides
spectra
0.000 | 0.000
0.000 | 0.000
0.000 | 0.000
0.000 | 0.000
0.082 | 0.092
0.000 | 0.000
0.781 | 0.787
0.122 | 0.133
| Plot | Mito | Lyso | Perox | ER | Golgi | PM | Cytosol | Nucleus | |||||
| Expt A |
25 peptides |
47 spectra |
|
0.000 0.000 | 0.000 |
0.000 0.000 | 0.000 |
0.000 0.000 | 0.000 |
0.000 0.000 | 0.000 |
0.088 0.082 | 0.092 |
0.000 0.000 | 0.000 |
0.785 0.781 | 0.787 |
0.128 0.122 | 0.133 |
| 2 spectra, VMVVLSEK | 0.213 | 0.000 | 0.000 | 0.088 | 0.000 | 0.000 | 0.663 | 0.036 | ||
| 1 spectrum, QTALQDELLR | 0.000 | 0.000 | 0.000 | 0.000 | 0.180 | 0.000 | 0.820 | 0.000 | ||
| 2 spectra, LSDSMAASSEGER | 0.000 | 0.000 | 0.000 | 0.000 | 0.134 | 0.000 | 0.800 | 0.066 | ||
| 2 spectra, EAALIK | 0.000 | 0.197 | 0.000 | 0.000 | 0.163 | 0.000 | 0.641 | 0.000 | ||
| 1 spectrum, QDSQTENSDIFQETK | 0.000 | 0.300 | 0.083 | 0.000 | 0.012 | 0.000 | 0.605 | 0.000 | ||
| 3 spectra, NLFIGHFHTPK | 0.000 | 0.000 | 0.000 | 0.000 | 0.000 | 0.000 | 0.790 | 0.210 | ||
| 2 spectra, EALAAEDR | 0.084 | 0.000 | 0.052 | 0.109 | 0.000 | 0.000 | 0.755 | 0.000 | ||
| 1 spectrum, VSVLEEK | 0.000 | 0.000 | 0.000 | 0.000 | 0.000 | 0.000 | 0.518 | 0.482 | ||
| 2 spectra, LQNLLK | 0.089 | 0.000 | 0.000 | 0.000 | 0.148 | 0.000 | 0.731 | 0.033 | ||
| 2 spectra, DVEIQALHAR | 0.000 | 0.000 | 0.015 | 0.000 | 0.022 | 0.339 | 0.624 | 0.000 | ||
| 3 spectra, HVILIK | 0.000 | 0.000 | 0.000 | 0.034 | 0.000 | 0.000 | 0.862 | 0.104 | ||
| 4 spectra, EAQQSALR | 0.174 | 0.000 | 0.000 | 0.000 | 0.021 | 0.000 | 0.721 | 0.084 | ||
| 2 spectra, QNEEELSTVR | 0.000 | 0.000 | 0.000 | 0.000 | 0.000 | 0.000 | 0.791 | 0.209 | ||
| 2 spectra, VEDLVDQLSK | 0.000 | 0.000 | 0.000 | 0.000 | 0.000 | 0.000 | 0.775 | 0.225 | ||
| 2 spectra, AVPVPEPR | 0.014 | 0.000 | 0.000 | 0.000 | 0.016 | 0.000 | 0.774 | 0.197 | ||
| 1 spectrum, WMAGWLGGGSK | 0.000 | 0.000 | 0.000 | 0.000 | 0.000 | 0.000 | 0.739 | 0.261 | ||
| 2 spectra, LTEISR | 0.000 | 0.000 | 0.000 | 0.000 | 0.124 | 0.000 | 0.865 | 0.011 | ||
| 2 spectra, AAILEWEK | 0.000 | 0.000 | 0.000 | 0.000 | 0.003 | 0.000 | 0.813 | 0.185 | ||
| 1 spectrum, LESELGHWR | 0.000 | 0.000 | 0.000 | 0.214 | 0.000 | 0.000 | 0.601 | 0.185 | ||
| 3 spectra, ALAFEQLLK | 0.000 | 0.000 | 0.000 | 0.000 | 0.190 | 0.000 | 0.753 | 0.056 | ||
| 2 spectra, EEEINHLK | 0.000 | 0.000 | 0.000 | 0.000 | 0.023 | 0.000 | 0.814 | 0.163 | ||
| 1 spectrum, EENNHLQEELER | 0.000 | 0.000 | 0.000 | 0.000 | 0.000 | 0.000 | 0.564 | 0.436 | ||
| 1 spectrum, LSHEYEVIK | 0.000 | 0.000 | 0.000 | 0.029 | 0.000 | 0.000 | 0.714 | 0.257 | ||
| 2 spectra, QQSSSYR | 0.000 | 0.000 | 0.000 | 0.000 | 0.034 | 0.000 | 0.800 | 0.167 | ||
| 1 spectrum, AQLQEER | 0.000 | 0.000 | 0.000 | 0.000 | 0.038 | 0.000 | 0.799 | 0.164 |
| Plot | Mito | Lyso or Perox | ER | Golgi | PM | Cytosol | Nucleus | ||||||
| Expt B |
7 peptides |
8 spectra |
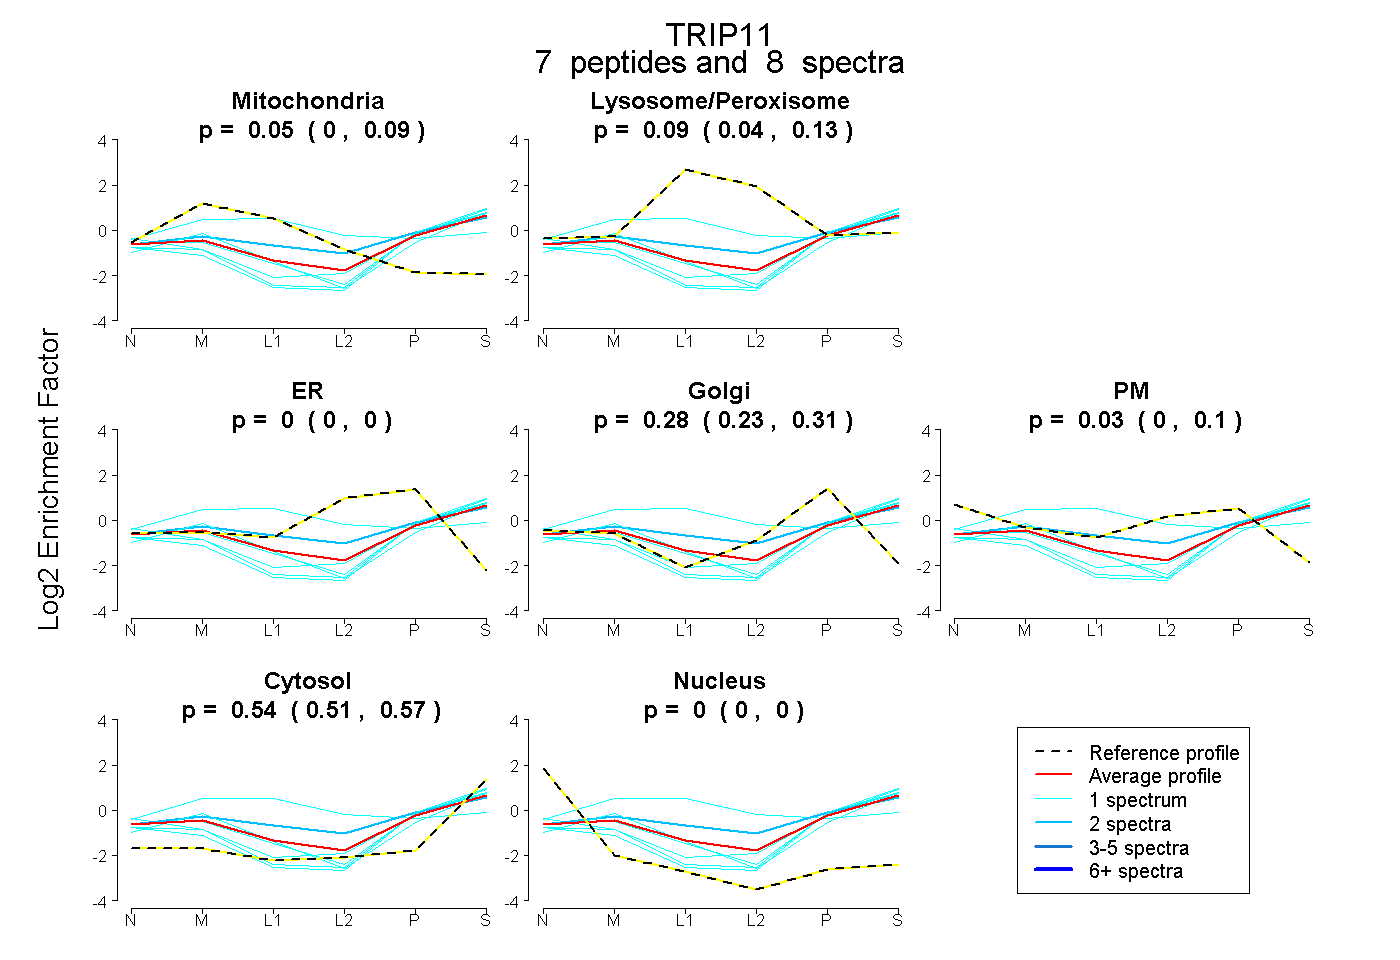 |
0.055 0.003 | 0.090 |
0.093 0.037 | 0.135 |
0.000 0.000 | 0.000 |
0.283 0.233 | 0.309 |
0.027 0.000 | 0.102 |
0.542 0.513 | 0.568 |
0.000 0.000 | 0.000 |
|||
| Plot | Lyso | Other | |||||||||||
| Expt C |
8 peptides |
15 spectra |
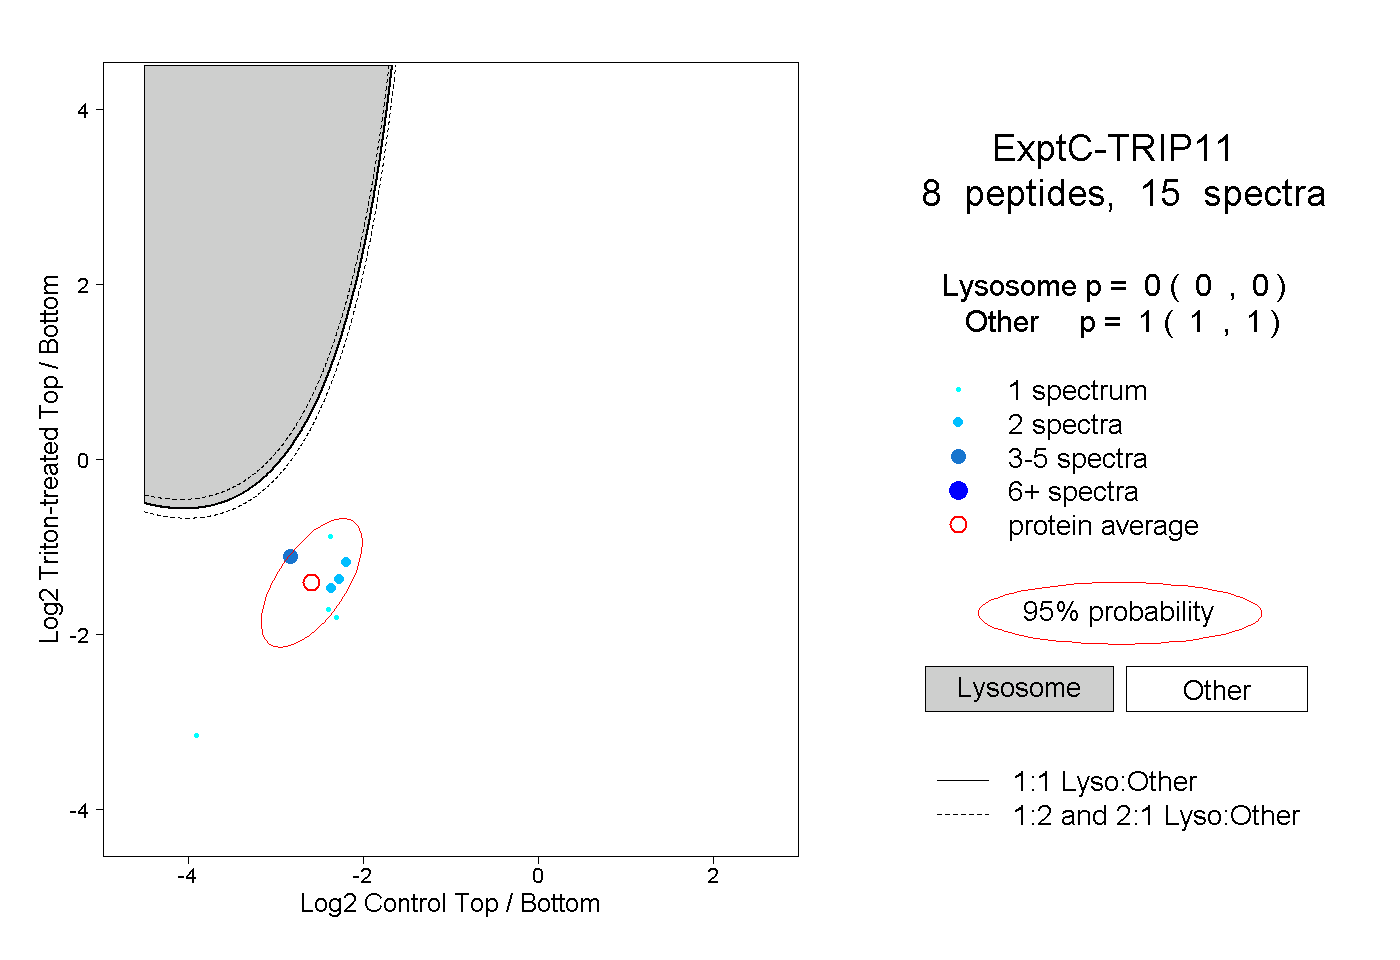 |
0.000 0.000 | 0.000 |
1.000 1.000 | 1.000 |
||||||||
| Plot | Lyso | Other | |||||||||||
| Expt D |
1 peptide |
1 spectrum |
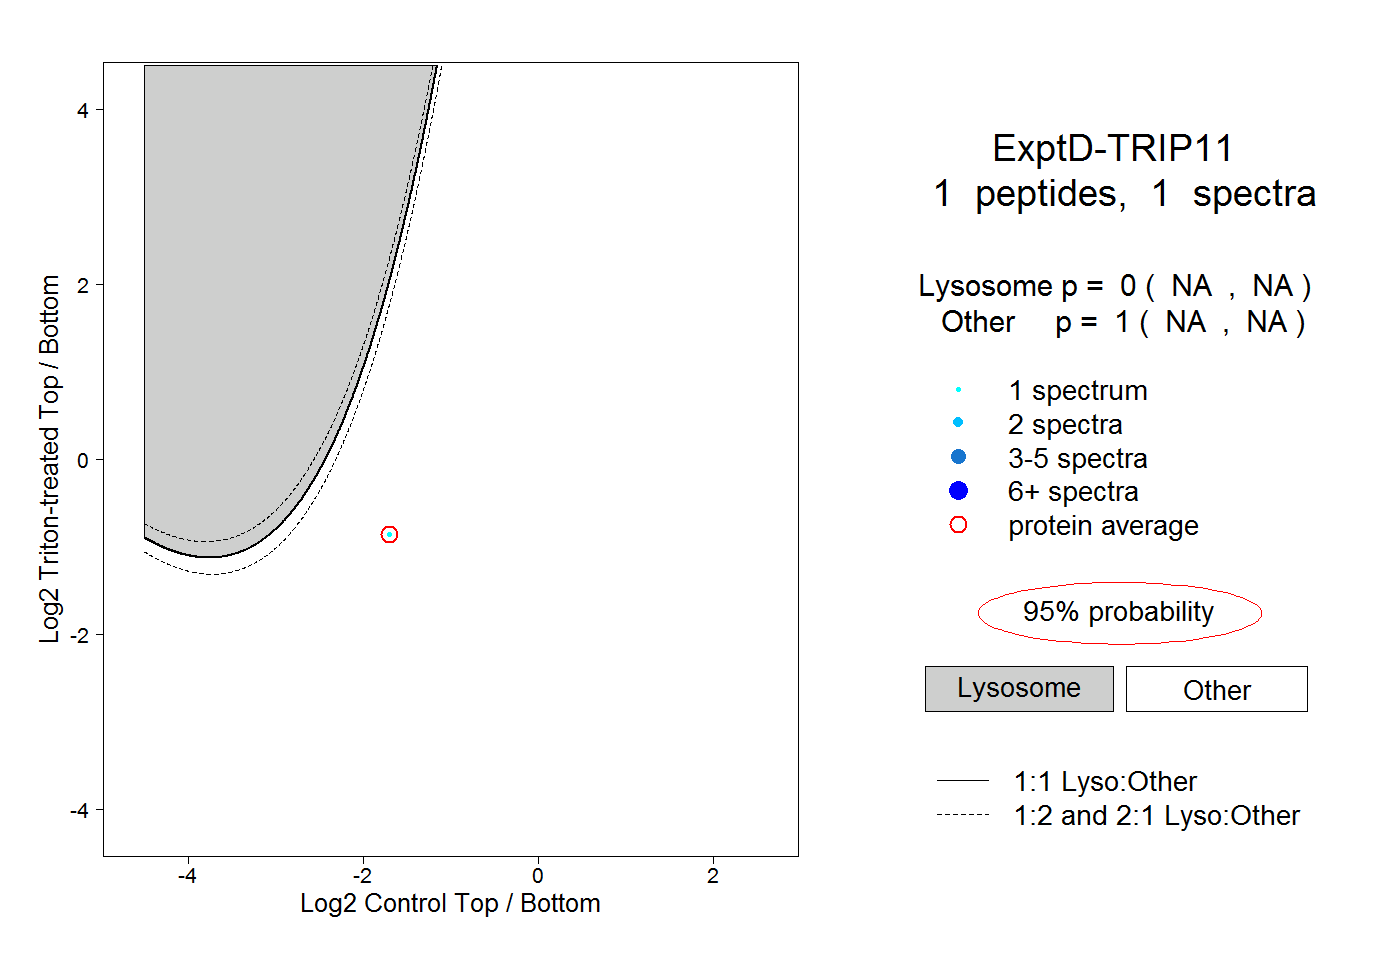 |
0.000 NA | NA |
1.000 NA | NA |