 21
21peptides
spectra

0.000 | 0.000
0.019 | 0.035
0.000 | 0.000
0.000 | 0.000
0.236 | 0.251
0.714 | 0.740
0.000 | 0.003
0.000 | 0.000
3peptides
spectra
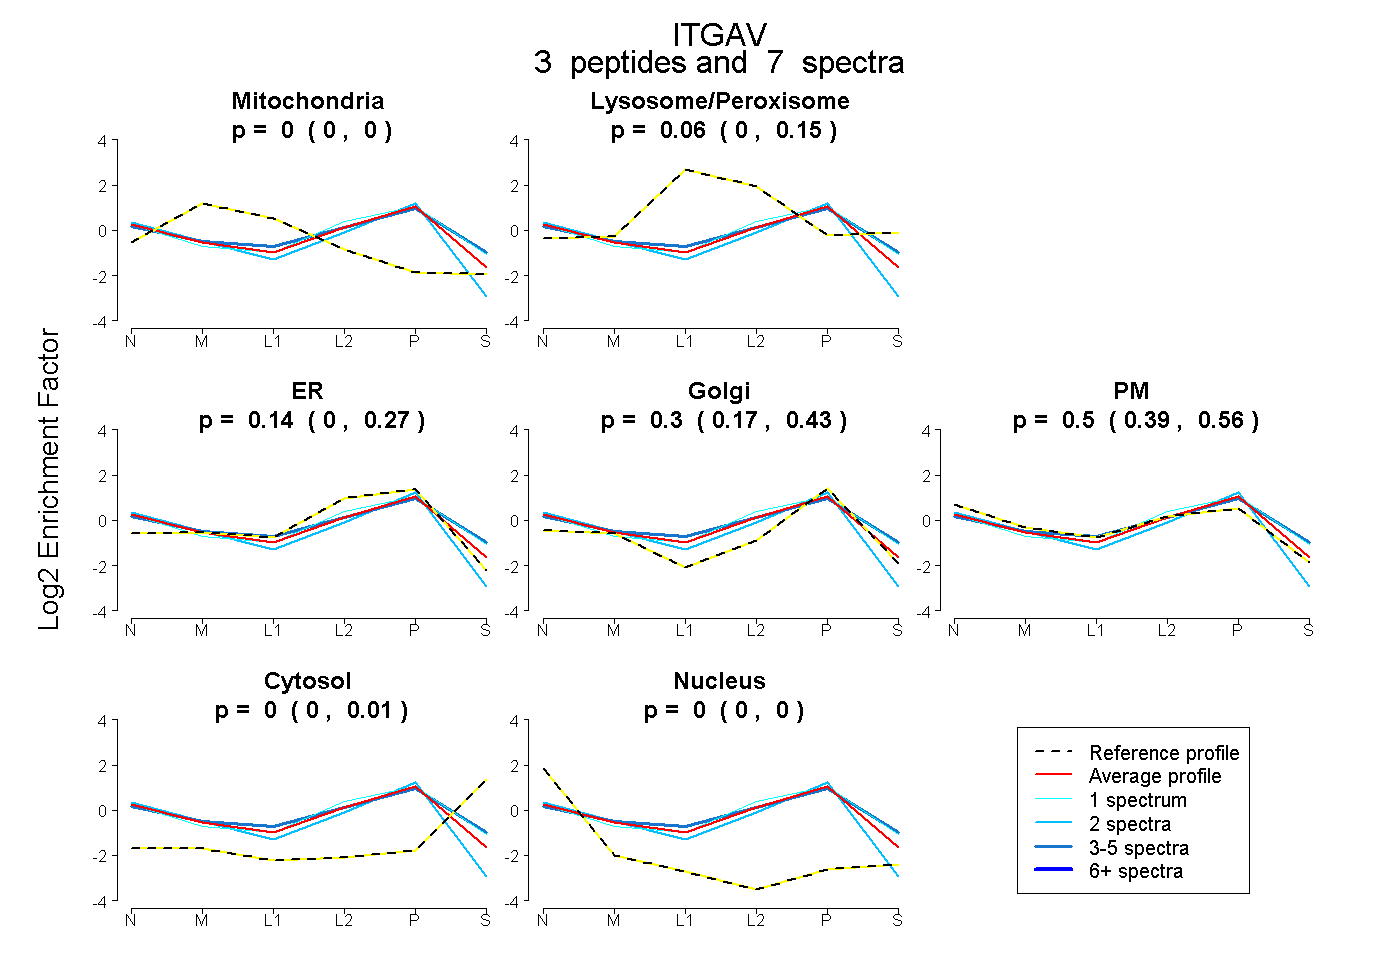
0.000 | 0.000
0.000 | 0.147
0.000 | 0.270
0.168 | 0.433
0.395 | 0.564
0.000 | 0.006
0.000 | 0.000
16peptides
spectra
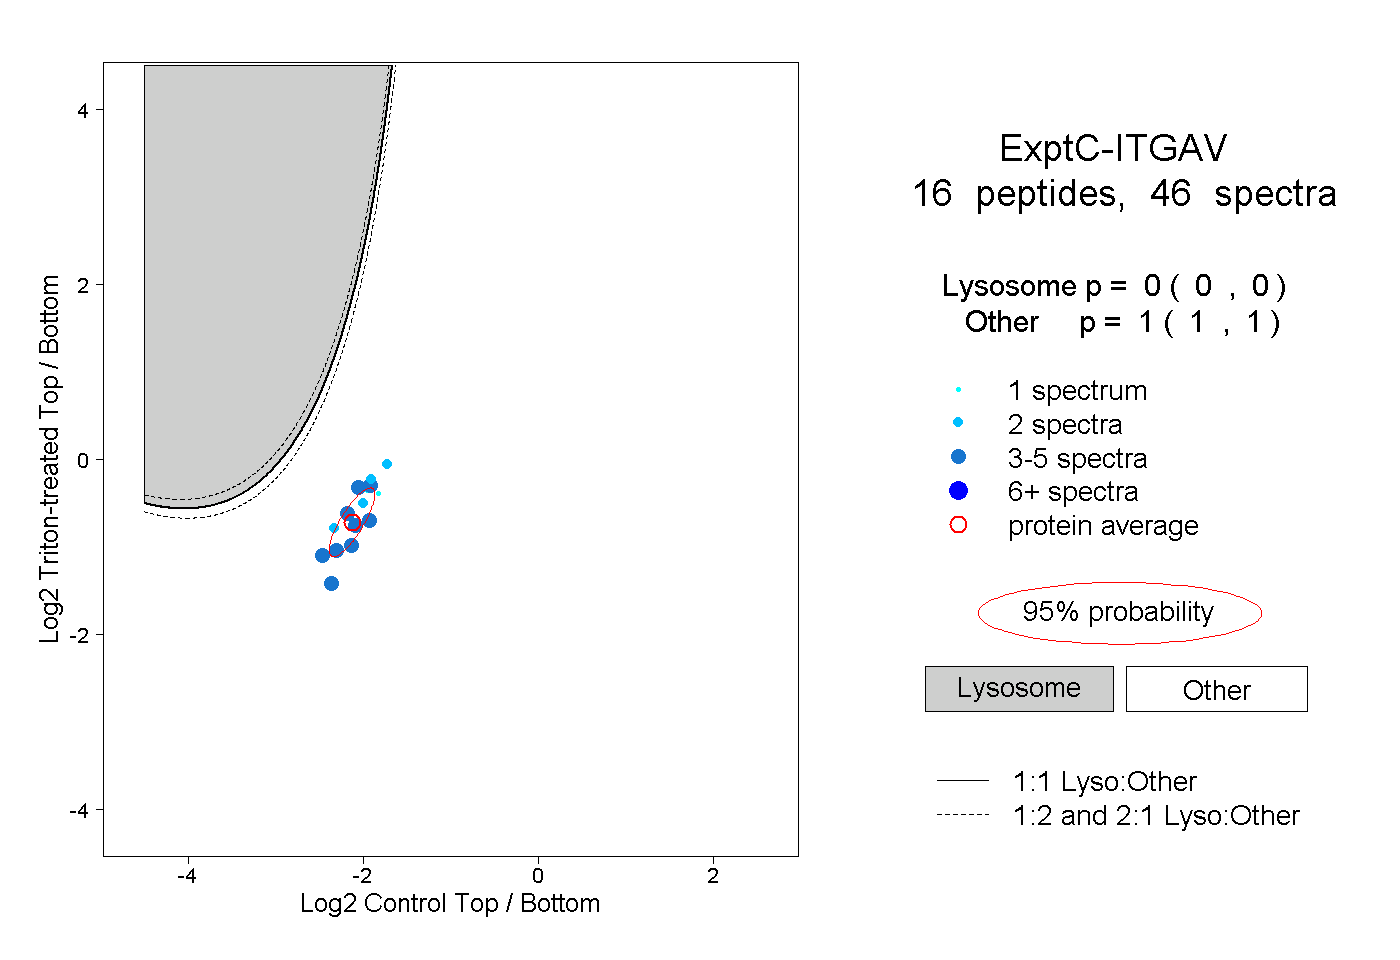
0.000 | 0.000
1.000 | 1.000
3peptides
spectra
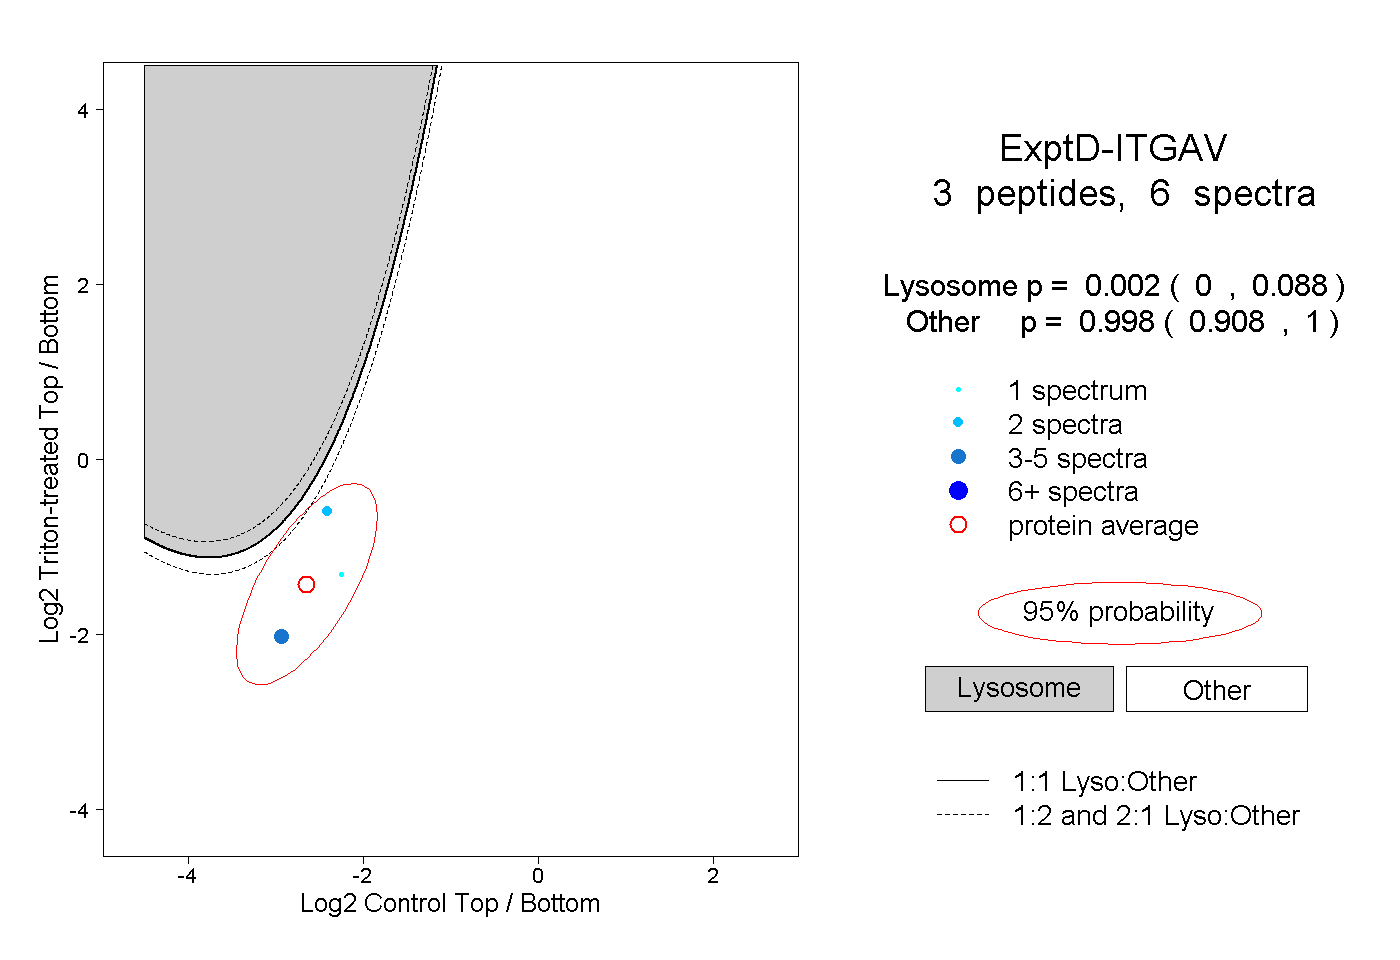
0.000 | 0.088
0.908 | 1.000