ITGAV
[ENSRNOP00000006961]
Main page
| | | Plot |
Mito |
Lyso |
|
Perox |
ER |
Golgi |
PM |
Cytosol |
Nucleus |
|
| Expt A |
 21
21
peptides |
54
spectra |
 |
0.000
0.000 | 0.000 |
0.028
0.019 | 0.035 |
|
0.000
0.000 | 0.000 |
0.000
0.000 | 0.000 |
0.245
0.236 | 0.251 |
0.727
0.714 | 0.740 |
0.000
0.000 | 0.003 |
0.000
0.000 | 0.000 |
|
| | | Plot |
Mito |
|
Lyso or Perox |
|
ER |
Golgi |
PM |
Cytosol |
Nucleus |
|
| Expt B |
3
peptides |
7
spectra |
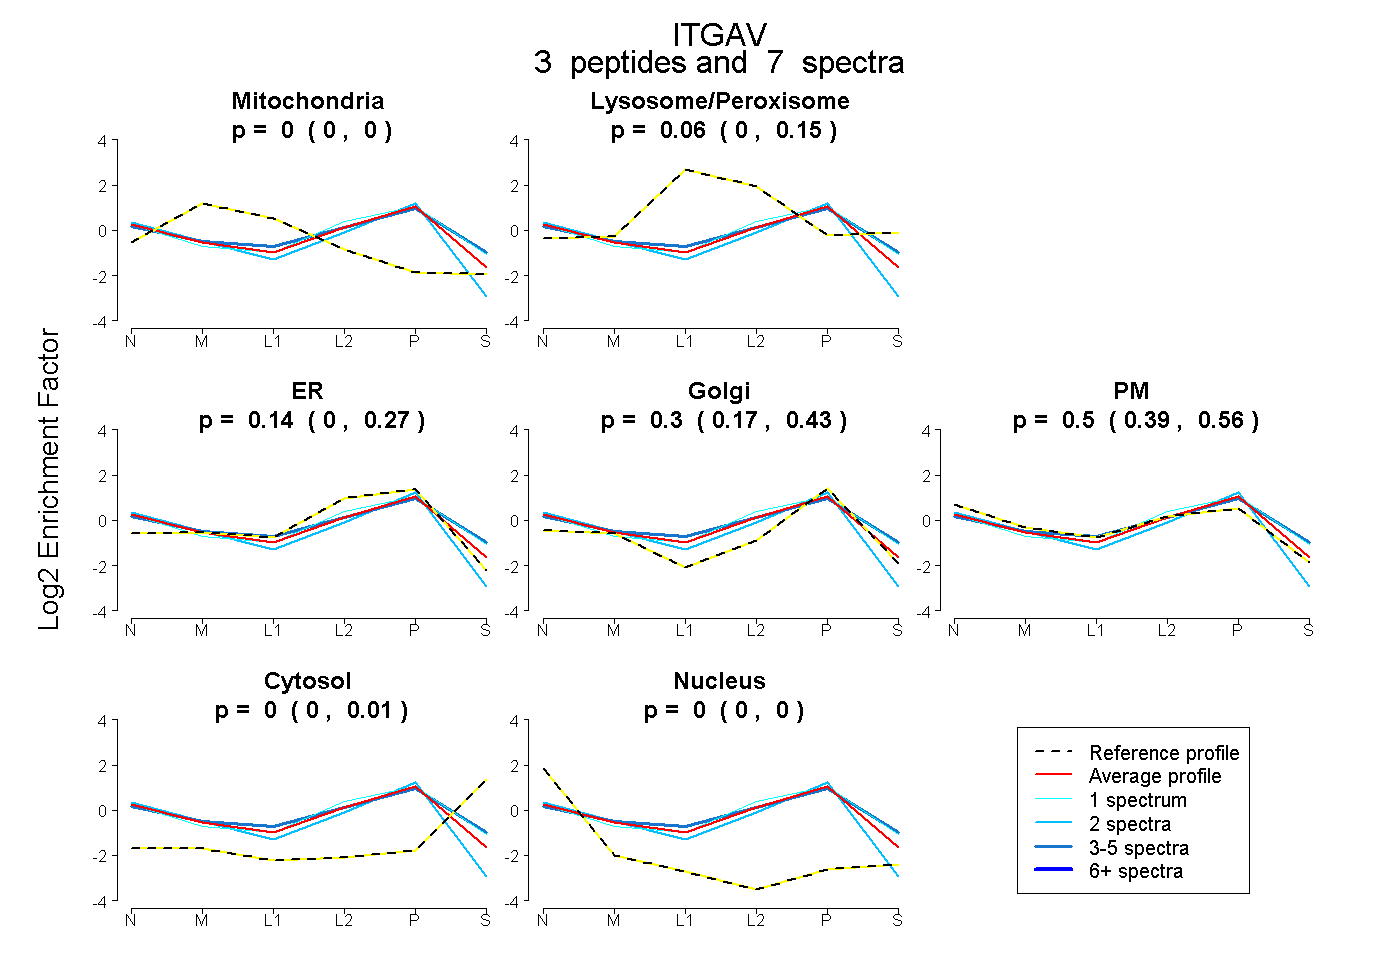 |
0.000
0.000 | 0.000 |
|
0.061
0.000 | 0.147 |
|
0.135
0.000 | 0.270 |
0.302
0.168 | 0.433 |
0.502
0.395 | 0.564 |
0.000
0.000 | 0.006 |
0.000
0.000 | 0.000 |
|
| 2 spectra, ALFLHNR |
0.000 |
|
0.000 |
|
0.398 |
0.251 |
0.285 |
0.000 |
0.066 |
|
| 4 spectra, DDPLEFK |
0.000 |
|
0.218 |
|
0.000 |
0.413 |
0.335 |
0.034 |
0.000 |
|
| 1 spectrum, GLVYIFNGR |
0.000 |
|
0.111 |
|
0.180 |
0.239 |
0.411 |
0.058 |
0.000 |
|
| | | Plot |
|
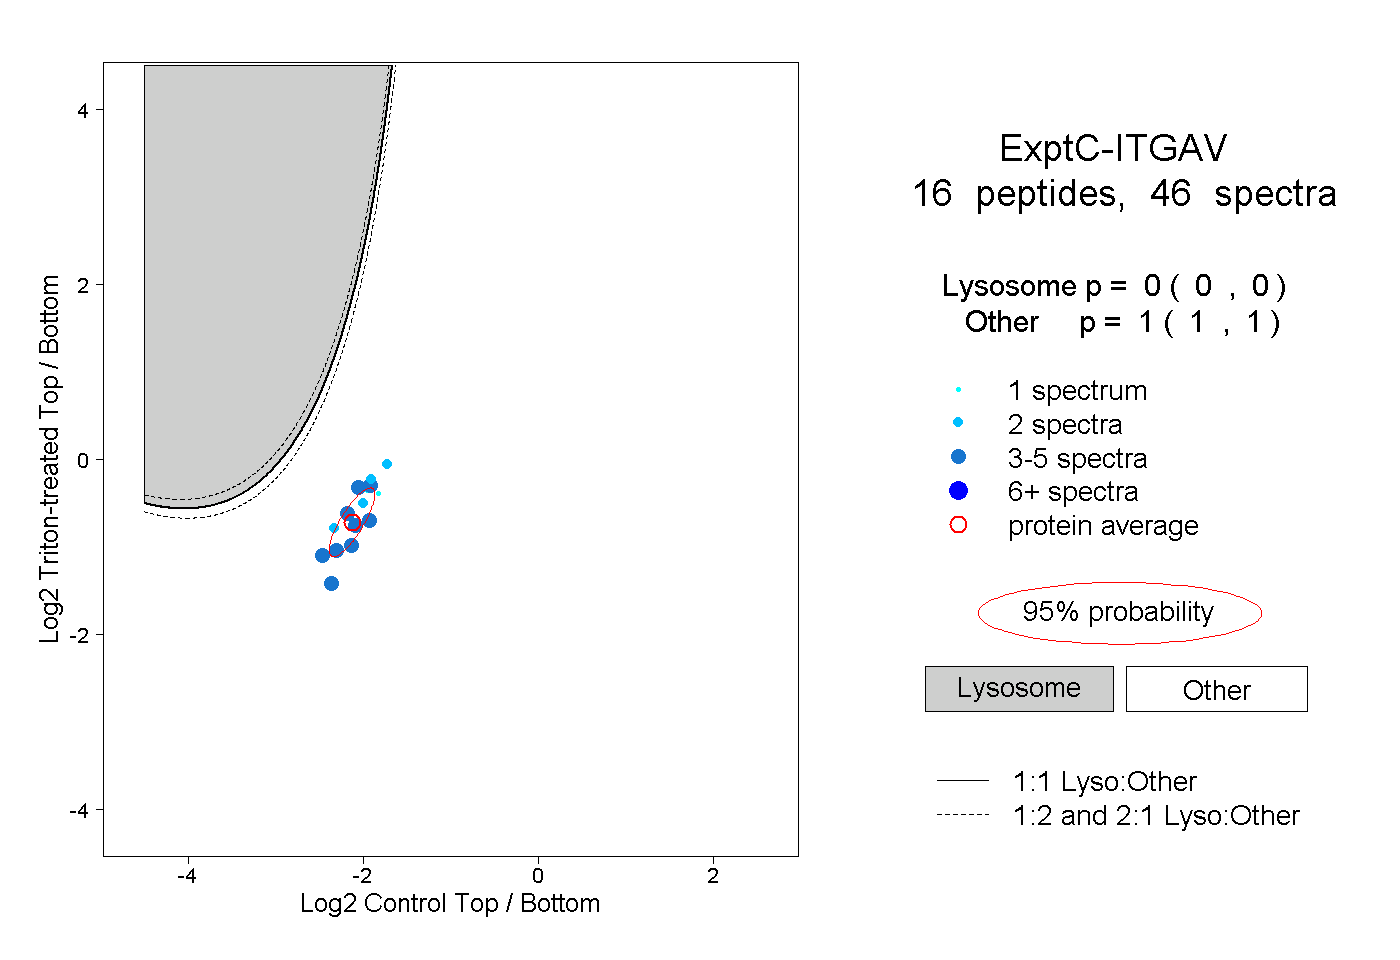
Lyso |
|
|
|
|
|
|
|
Other |
| Expt C |
16
peptides |
46
spectra |
 |
|
0.000
0.000 | 0.000 |
|
|
|
|
|
|
|
1.000
1.000 | 1.000 |
| | | Plot |
|
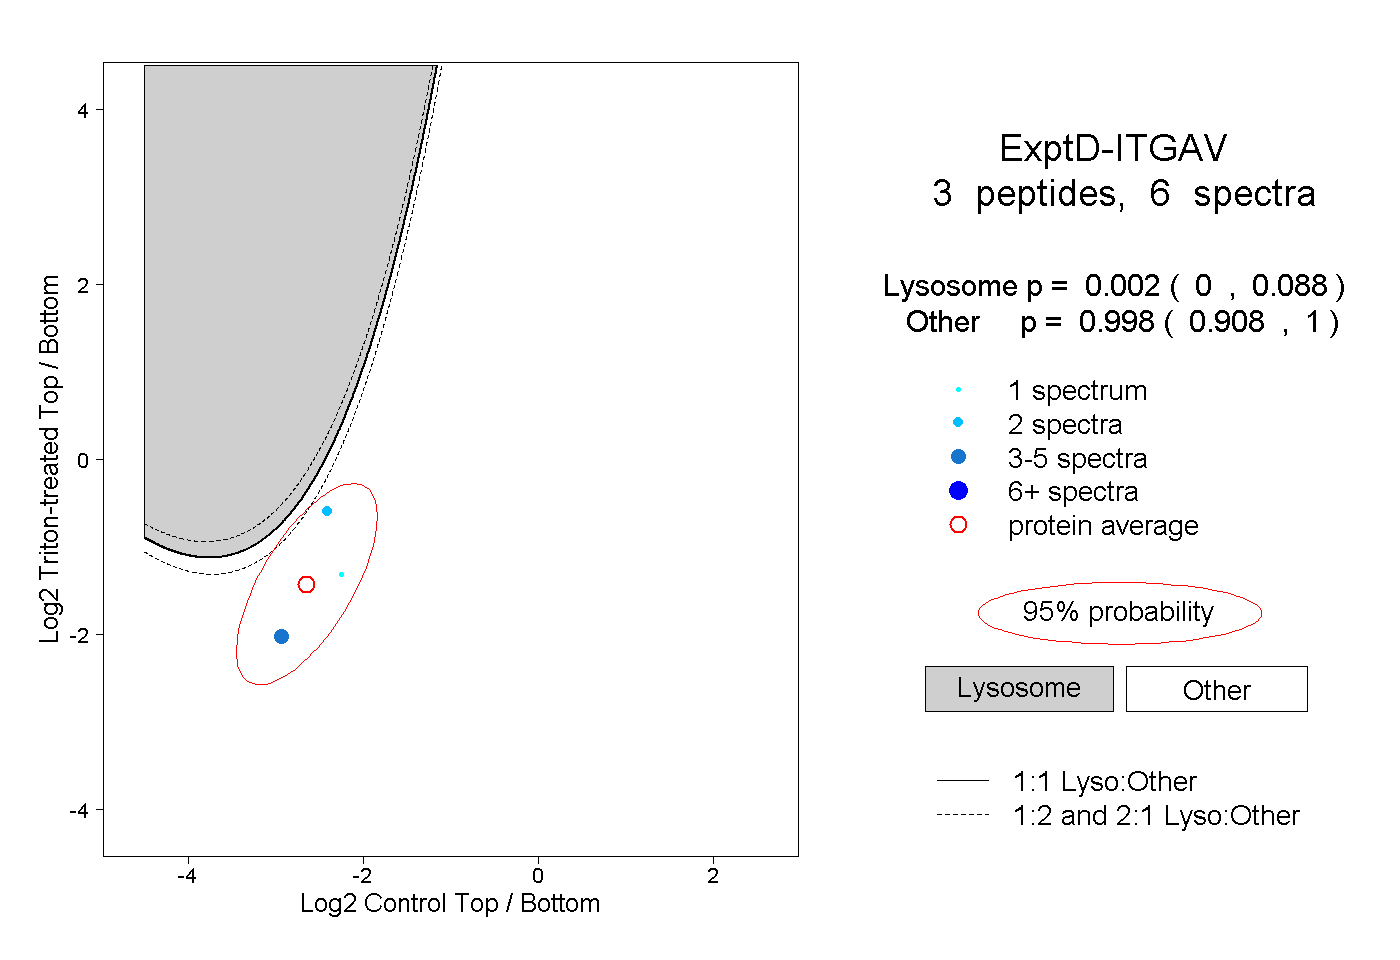
Lyso |
|
|
|
|
|
|
|
Other |
| Expt D |
3
peptides |
6
spectra |
 |
|
0.002
0.000 | 0.088 |
|
|
|
|
|
|
|
0.998
0.908 | 1.000 |