 21
21peptides
spectra

0.000 | 0.000
0.019 | 0.035
0.000 | 0.000
0.000 | 0.000
0.236 | 0.251
0.714 | 0.740
0.000 | 0.003
0.000 | 0.000
| Plot | Mito | Lyso | Perox | ER | Golgi | PM | Cytosol | Nucleus | |||||
| Expt A |
21 peptides |
54 spectra |
|
0.000 0.000 | 0.000 |
0.028 0.019 | 0.035 |
0.000 0.000 | 0.000 |
0.000 0.000 | 0.000 |
0.245 0.236 | 0.251 |
0.727 0.714 | 0.740 |
0.000 0.000 | 0.003 |
0.000 0.000 | 0.000 |
| 3 spectra, AGTQLLAGLR | 0.000 | 0.000 | 0.000 | 0.005 | 0.182 | 0.812 | 0.000 | 0.000 | ||
| 3 spectra, AILNLQWPYK | 0.000 | 0.084 | 0.000 | 0.000 | 0.151 | 0.702 | 0.063 | 0.000 | ||
| 2 spectra, YDPNVYSIK | 0.000 | 0.000 | 0.000 | 0.000 | 0.209 | 0.788 | 0.000 | 0.002 | ||
| 1 spectrum, LSCAFK | 0.010 | 0.000 | 0.000 | 0.173 | 0.098 | 0.567 | 0.144 | 0.008 | ||
| 2 spectra, SLLWTETFMNK | 0.000 | 0.000 | 0.000 | 0.000 | 0.224 | 0.776 | 0.000 | 0.000 | ||
| 2 spectra, VRPPQEEQER | 0.000 | 0.000 | 0.063 | 0.010 | 0.000 | 0.693 | 0.233 | 0.000 | ||
| 4 spectra, ALFLHNR | 0.000 | 0.044 | 0.000 | 0.000 | 0.388 | 0.552 | 0.016 | 0.000 | ||
| 2 spectra, NNEALAR | 0.000 | 0.000 | 0.000 | 0.000 | 0.000 | 0.791 | 0.209 | 0.000 | ||
| 1 spectrum, EPVGTCFLQDGTK | 0.000 | 0.195 | 0.000 | 0.069 | 0.170 | 0.566 | 0.000 | 0.000 | ||
| 2 spectra, GATDVDR | 0.000 | 0.000 | 0.000 | 0.000 | 0.163 | 0.837 | 0.000 | 0.000 | ||
| 2 spectra, QVVCDLGNPMK | 0.000 | 0.212 | 0.000 | 0.000 | 0.029 | 0.524 | 0.235 | 0.000 | ||
| 1 spectrum, DMTVFR | 0.000 | 0.000 | 0.000 | 0.000 | 0.029 | 0.971 | 0.000 | 0.000 | ||
| 3 spectra, MFLLVGAPK | 0.000 | 0.121 | 0.008 | 0.000 | 0.221 | 0.580 | 0.070 | 0.000 | ||
| 4 spectra, ASGDFQTTK | 0.000 | 0.070 | 0.000 | 0.000 | 0.289 | 0.550 | 0.091 | 0.000 | ||
| 4 spectra, TVEYAPCR | 0.036 | 0.000 | 0.000 | 0.000 | 0.065 | 0.899 | 0.000 | 0.000 | ||
| 1 spectrum, ICPLPGTALK | 0.000 | 0.059 | 0.208 | 0.000 | 0.147 | 0.437 | 0.150 | 0.000 | ||
| 4 spectra, ILACAPLYHWR | 0.000 | 0.000 | 0.000 | 0.476 | 0.072 | 0.452 | 0.000 | 0.000 | ||
| 1 spectrum, NNGPSSFSK | 0.000 | 0.452 | 0.000 | 0.000 | 0.000 | 0.337 | 0.211 | 0.000 | ||
| 6 spectra, DDPLEFK | 0.000 | 0.000 | 0.000 | 0.000 | 0.177 | 0.823 | 0.000 | 0.000 | ||
| 2 spectra, YNNQLATR | 0.000 | 0.000 | 0.000 | 0.000 | 0.370 | 0.630 | 0.000 | 0.000 | ||
| 4 spectra, GLVYIFNGR | 0.000 | 0.076 | 0.000 | 0.000 | 0.279 | 0.587 | 0.059 | 0.000 |
| Plot | Mito | Lyso or Perox | ER | Golgi | PM | Cytosol | Nucleus | ||||||
| Expt B |
3 peptides |
7 spectra |
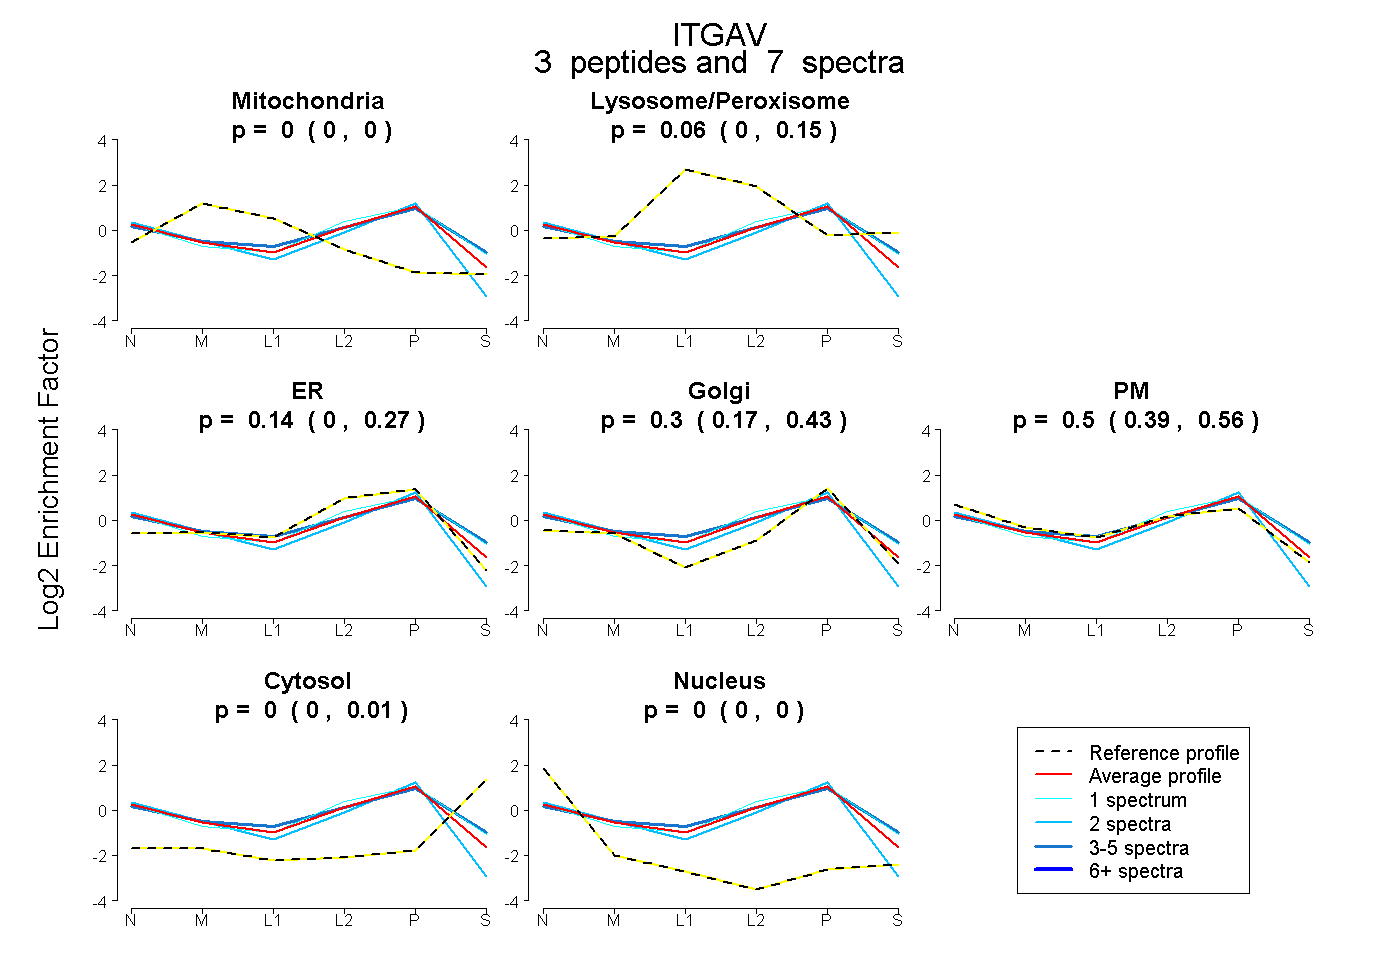 |
0.000 0.000 | 0.000 |
0.061 0.000 | 0.147 |
0.135 0.000 | 0.270 |
0.302 0.168 | 0.433 |
0.502 0.395 | 0.564 |
0.000 0.000 | 0.006 |
0.000 0.000 | 0.000 |
|||
| Plot | Lyso | Other | |||||||||||
| Expt C |
16 peptides |
46 spectra |
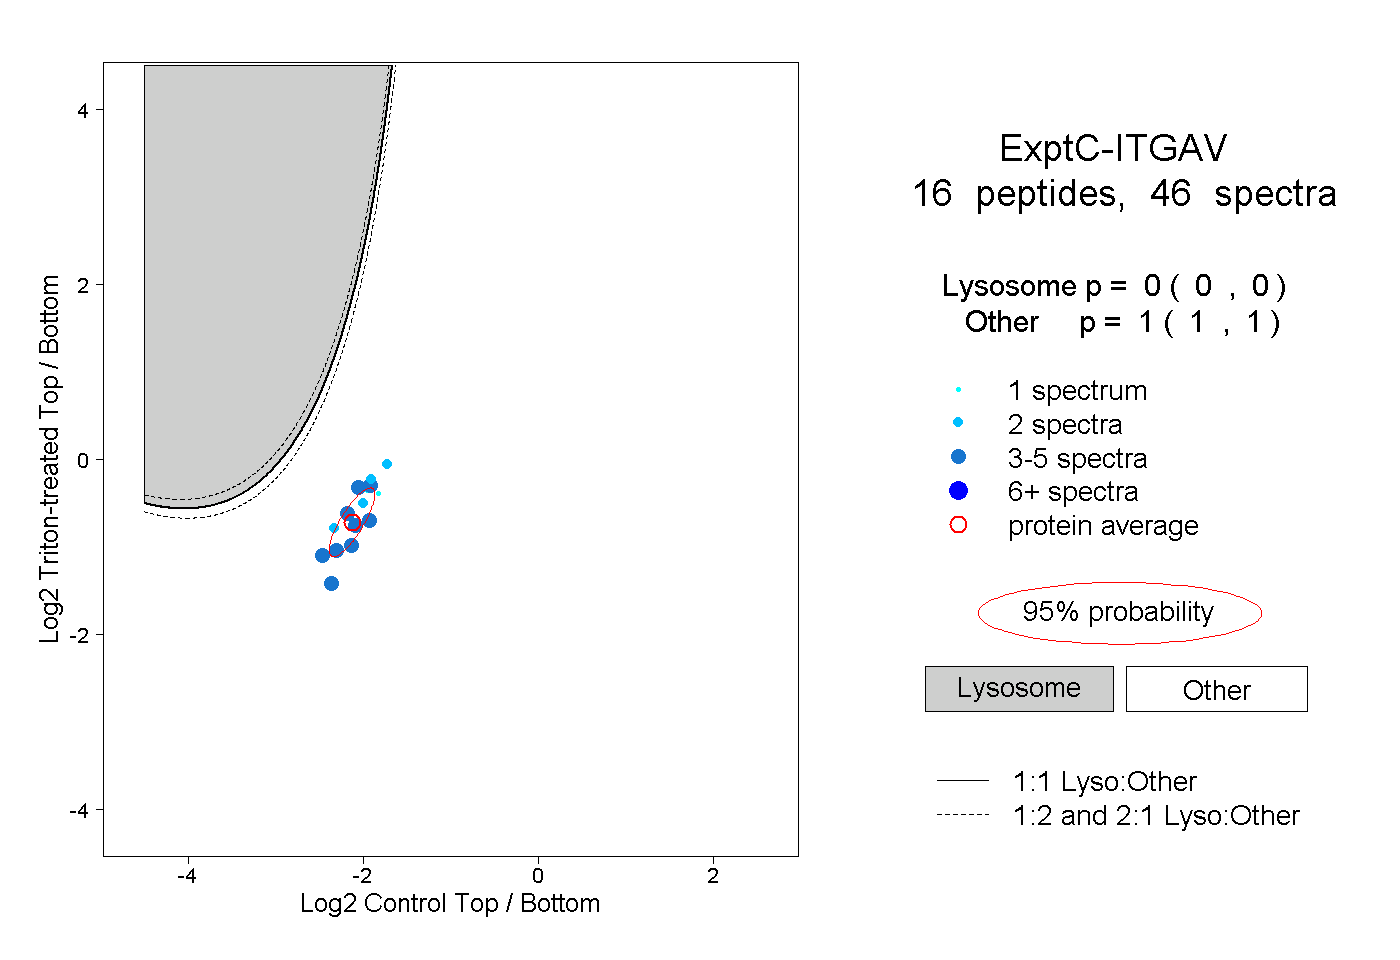 |
0.000 0.000 | 0.000 |
1.000 1.000 | 1.000 |
||||||||
| Plot | Lyso | Other | |||||||||||
| Expt D |
3 peptides |
6 spectra |
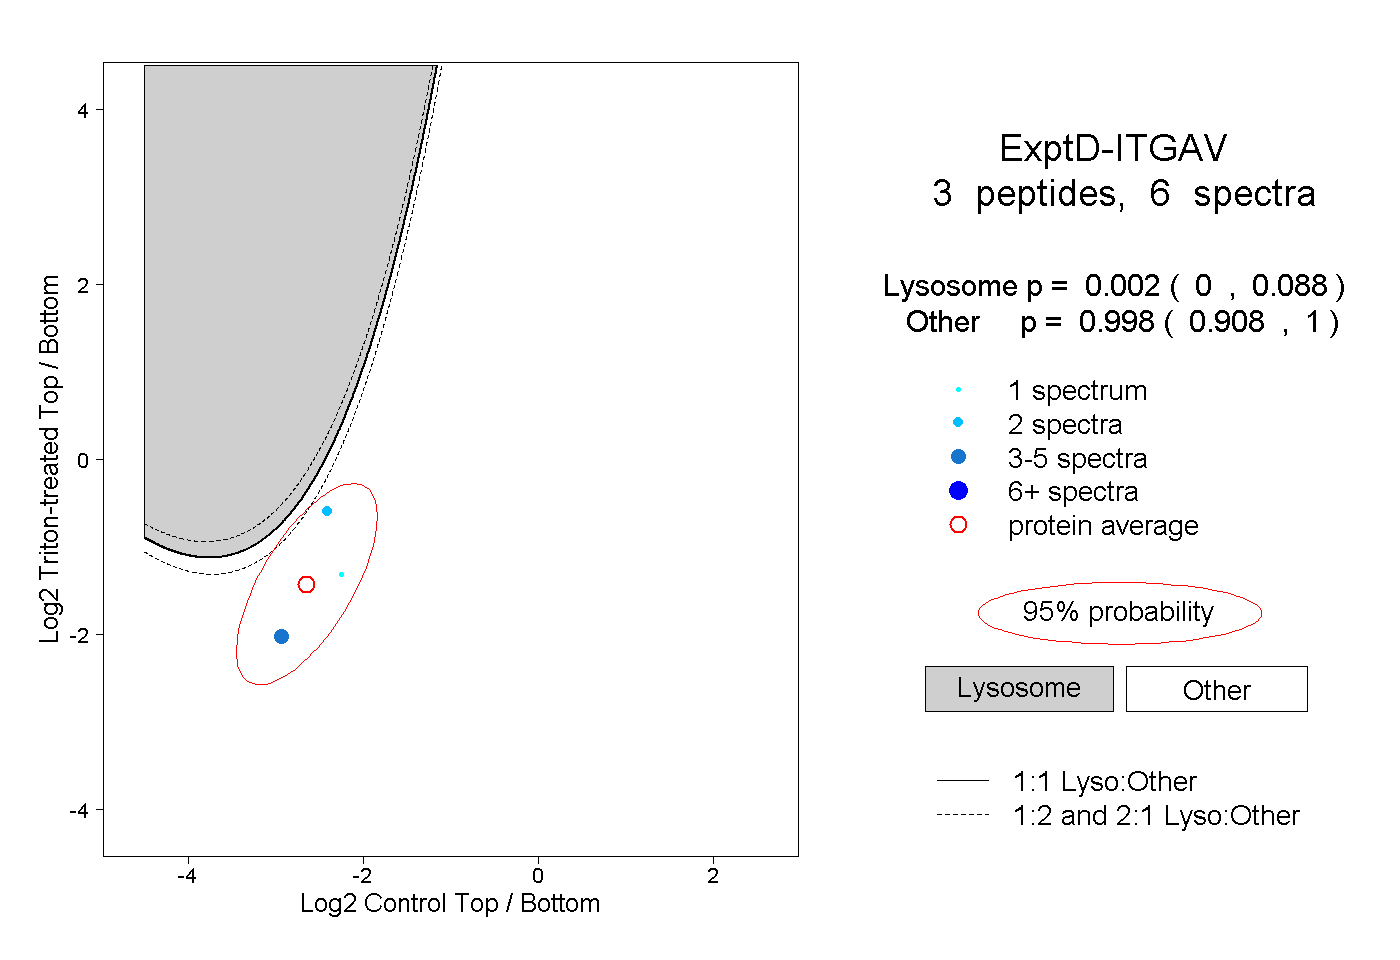 |
0.002 0.000 | 0.088 |
0.998 0.908 | 1.000 |