 12
12peptides
spectra
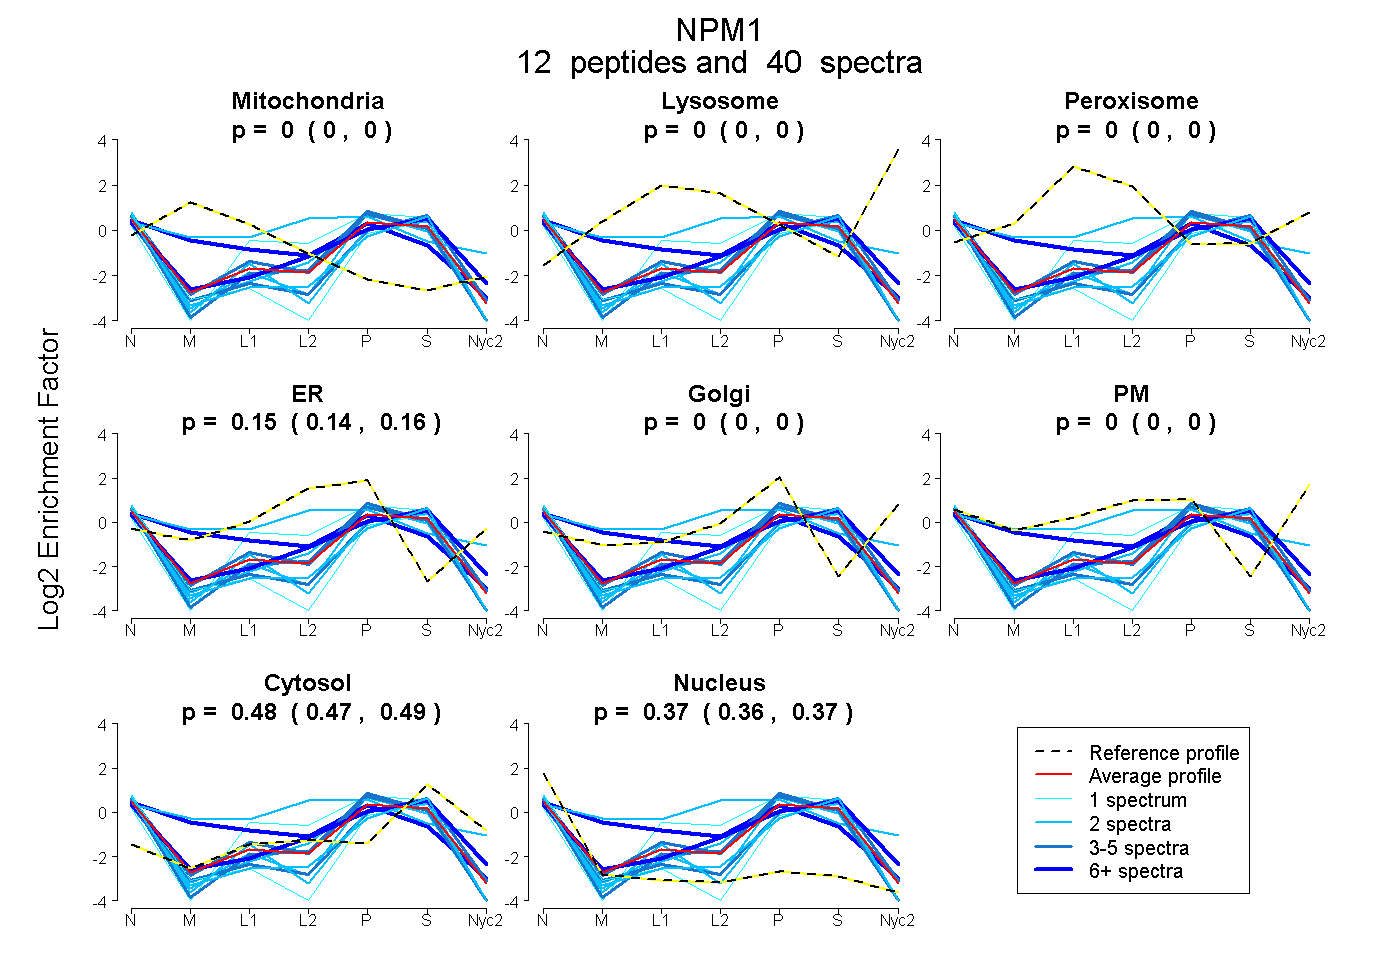
0.000 | 0.000
0.000 | 0.000
0.000 | 0.000
0.142 | 0.163
0.000 | 0.000
0.000 | 0.000
0.472 | 0.488
0.357 | 0.374
3peptides
spectra
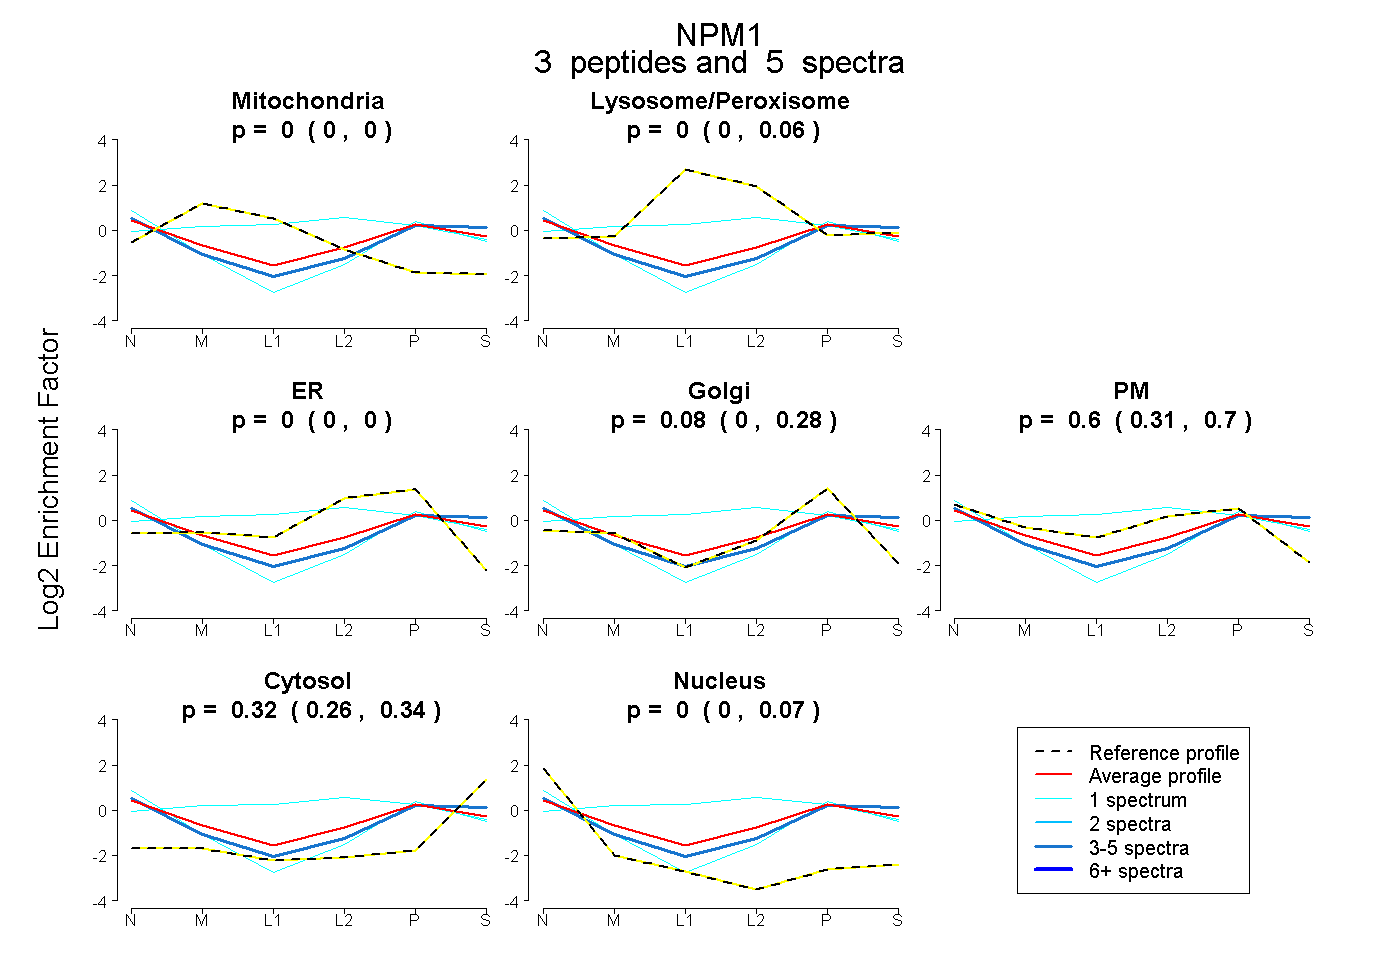
0.000 | 0.000
0.000 | 0.058
0.000 | 0.000
0.000 | 0.281
0.312 | 0.701
0.259 | 0.339
0.000 | 0.068
7peptides
spectra
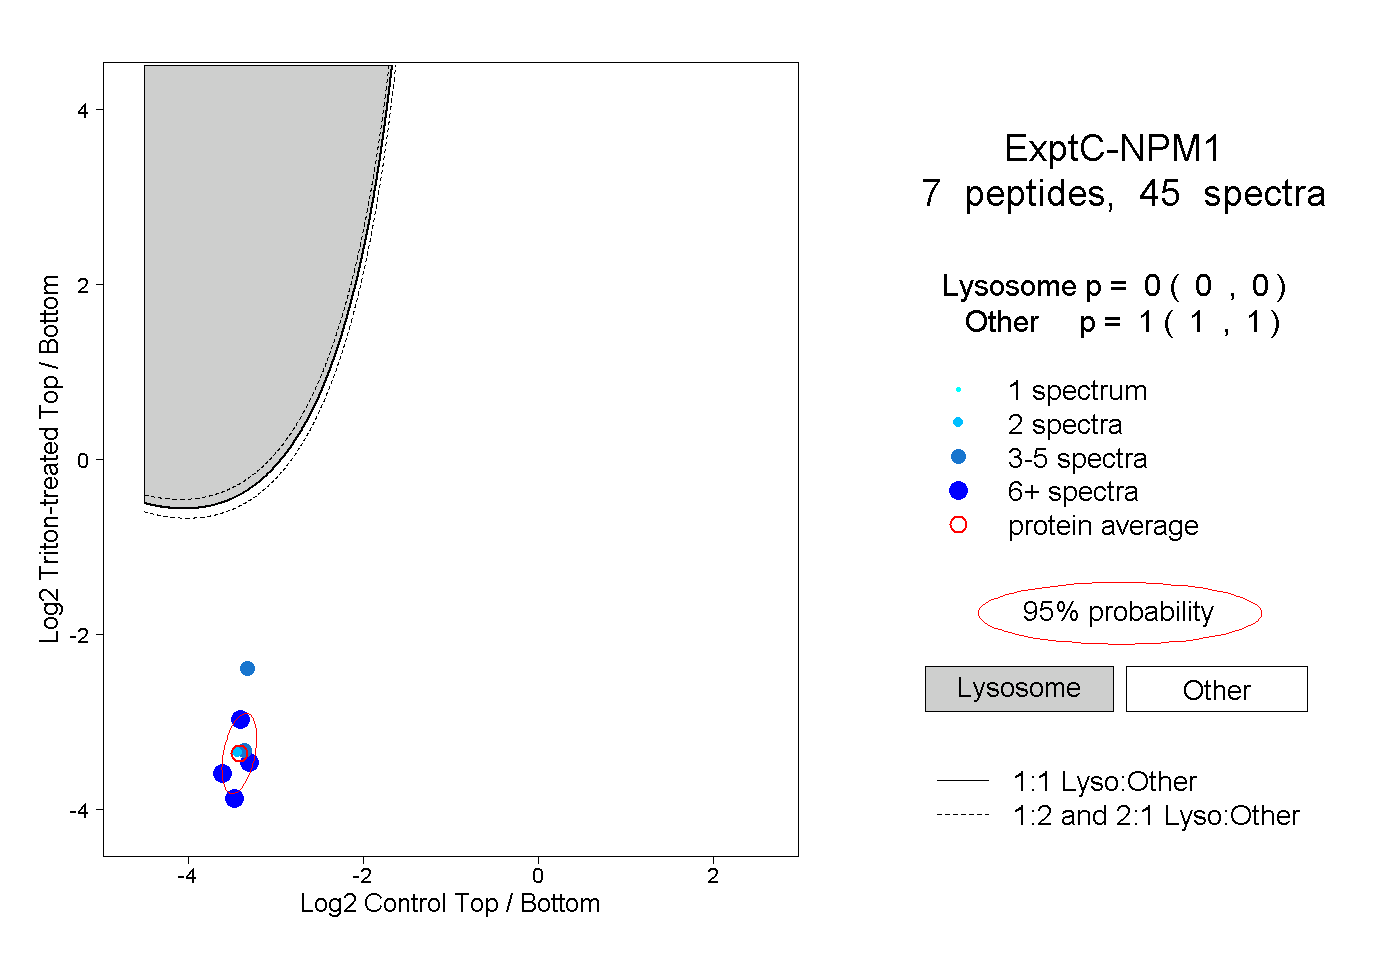
0.000 | 0.000
1.000 | 1.000
1peptide
spectrum
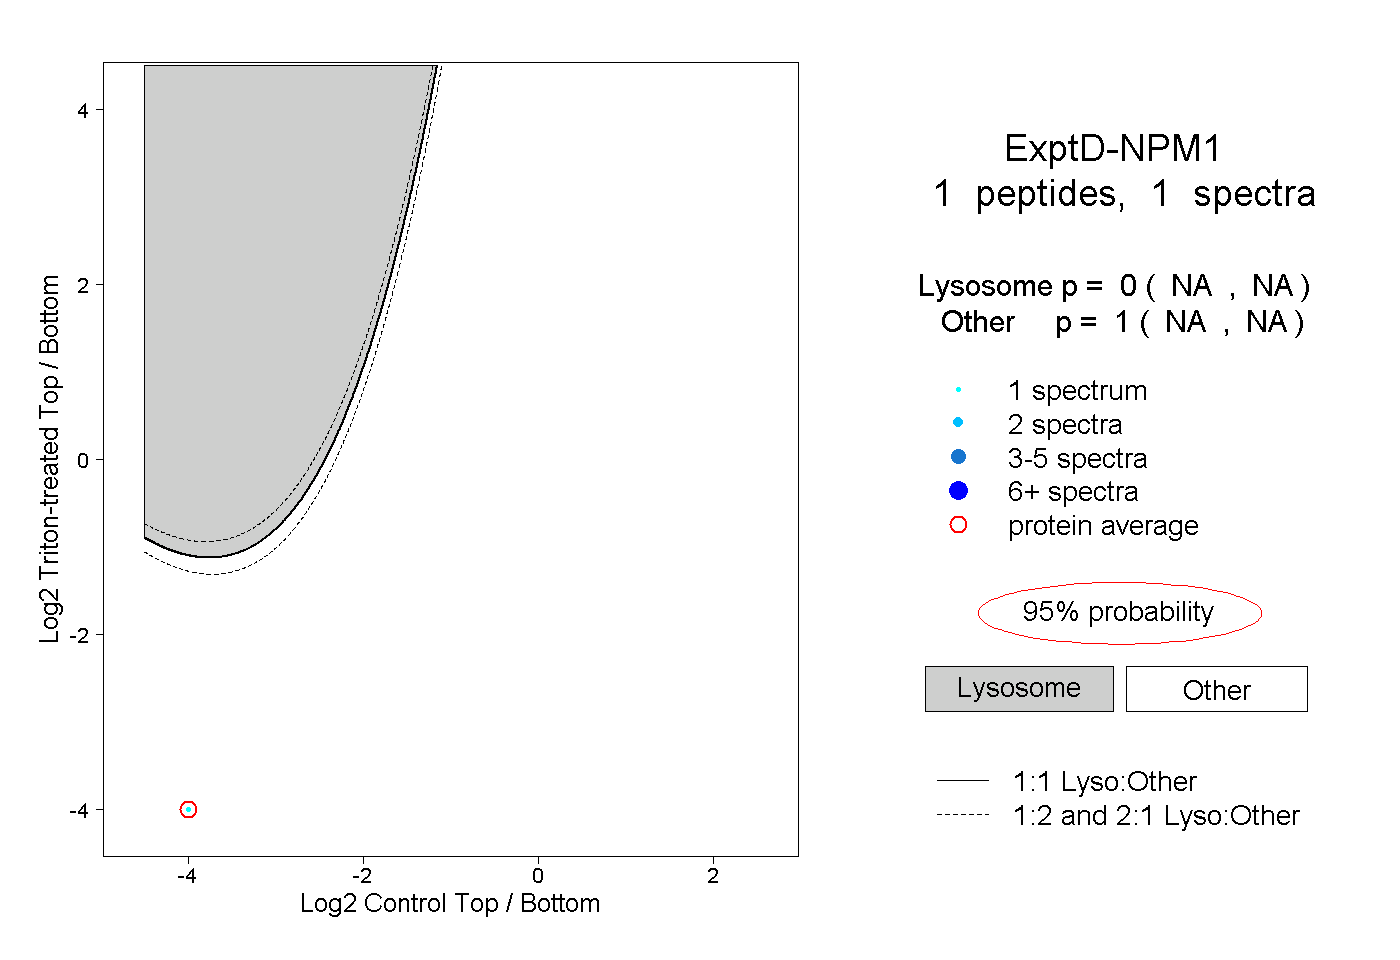
NA | NA
NA | NA