NPM1
[ENSRNOP00000006591]
Main page
| | | Plot |
Mito |
Lyso |
|
Perox |
ER |
Golgi |
PM |
Cytosol |
Nucleus |
|
| Expt A |
 12
12
peptides |
40
spectra |
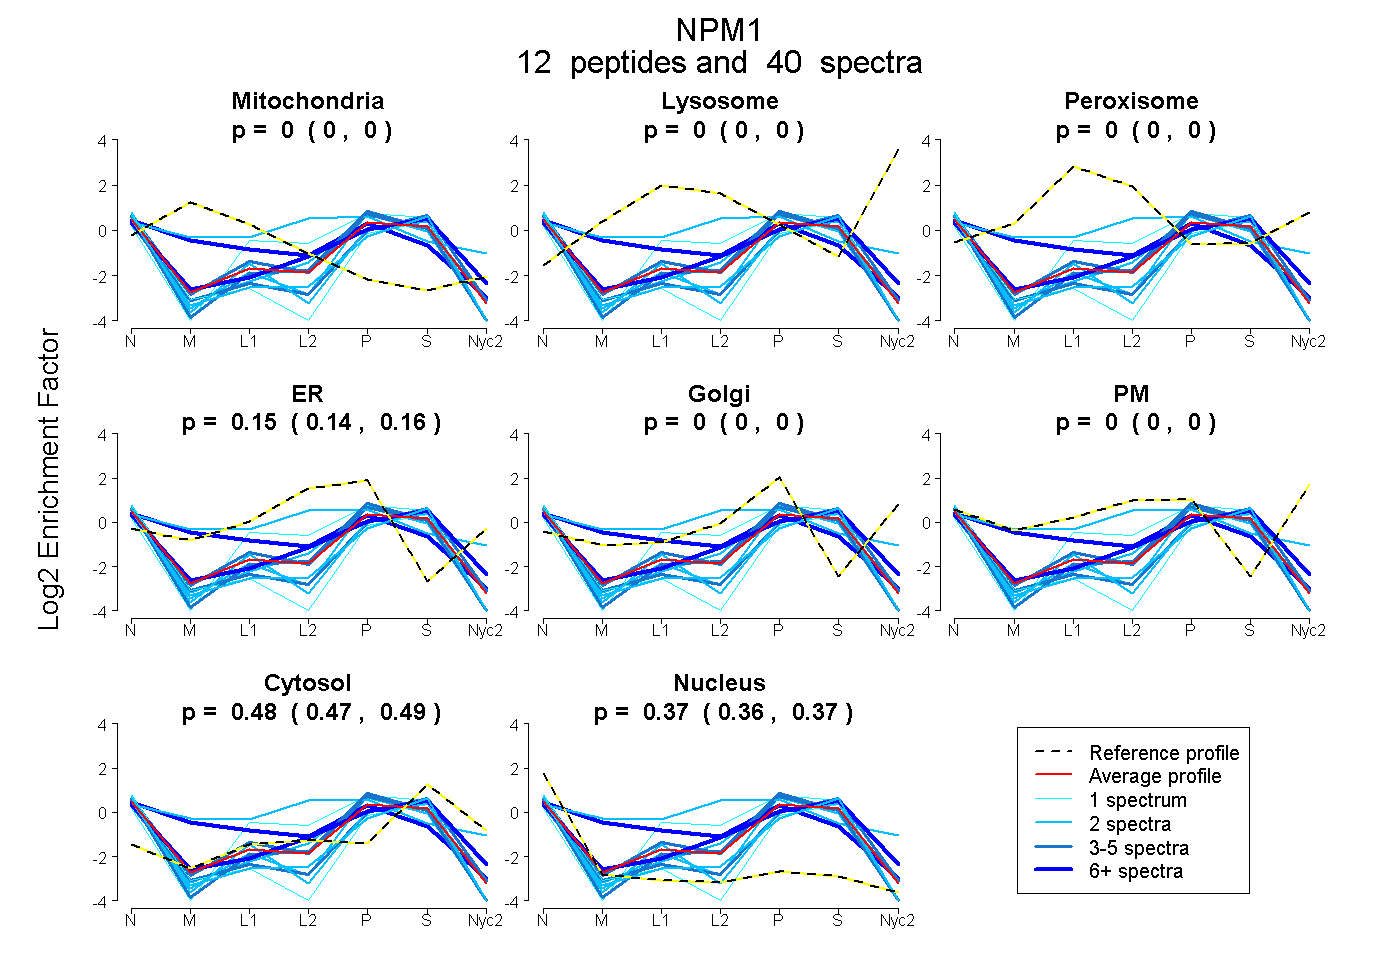 |
0.000
0.000 | 0.000 |
0.000
0.000 | 0.000 |
|
0.000
0.000 | 0.000 |
0.154
0.142 | 0.163 |
0.000
0.000 | 0.000 |
0.000
0.000 | 0.000 |
0.480
0.472 | 0.488 |
0.365
0.357 | 0.374 |
|
| | | Plot |
Mito |
|
Lyso or Perox |
|
ER |
Golgi |
PM |
Cytosol |
Nucleus |
|
| Expt B |
3
peptides |
5
spectra |
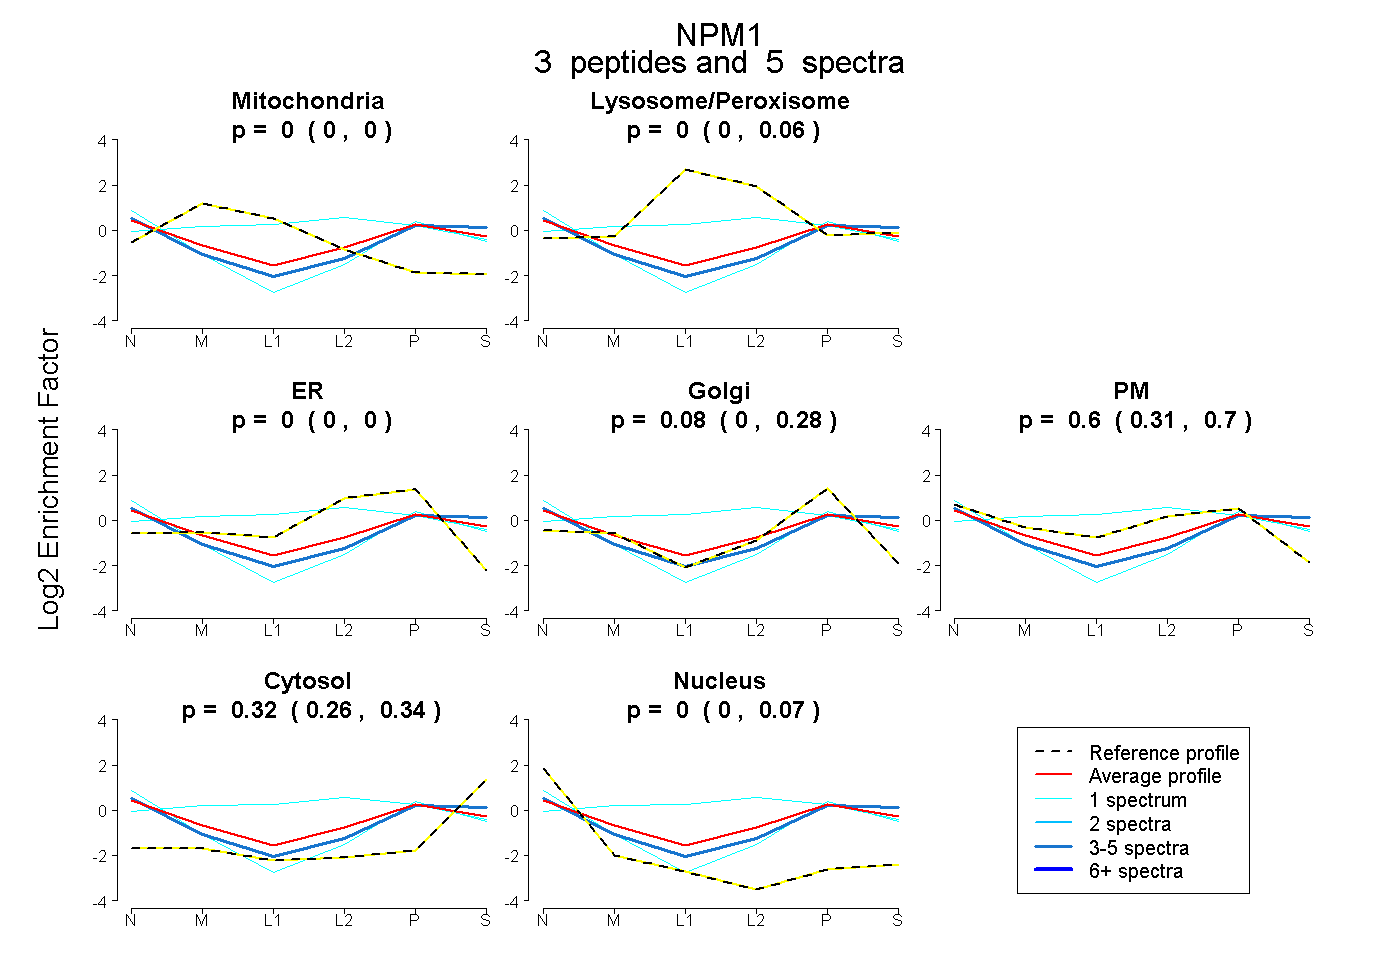 |
0.000
0.000 | 0.000 |
|
0.000
0.000 | 0.058 |
|
0.000
0.000 | 0.000 |
0.080
0.000 | 0.281 |
0.603
0.312 | 0.701 |
0.317
0.259 | 0.339 |
0.000
0.000 | 0.068 |
|
| 1 spectrum, GGSLPK |
0.042 |
|
0.426 |
|
0.000 |
0.161 |
0.283 |
0.088 |
0.000 |
|
| 3 spectra, VDNDENEHQLSLR |
0.000 |
|
0.000 |
|
0.000 |
0.203 |
0.354 |
0.377 |
0.066 |
|
| 1 spectrum, GPSSVEDIK |
0.000 |
|
0.000 |
|
0.000 |
0.522 |
0.077 |
0.193 |
0.209 |
|
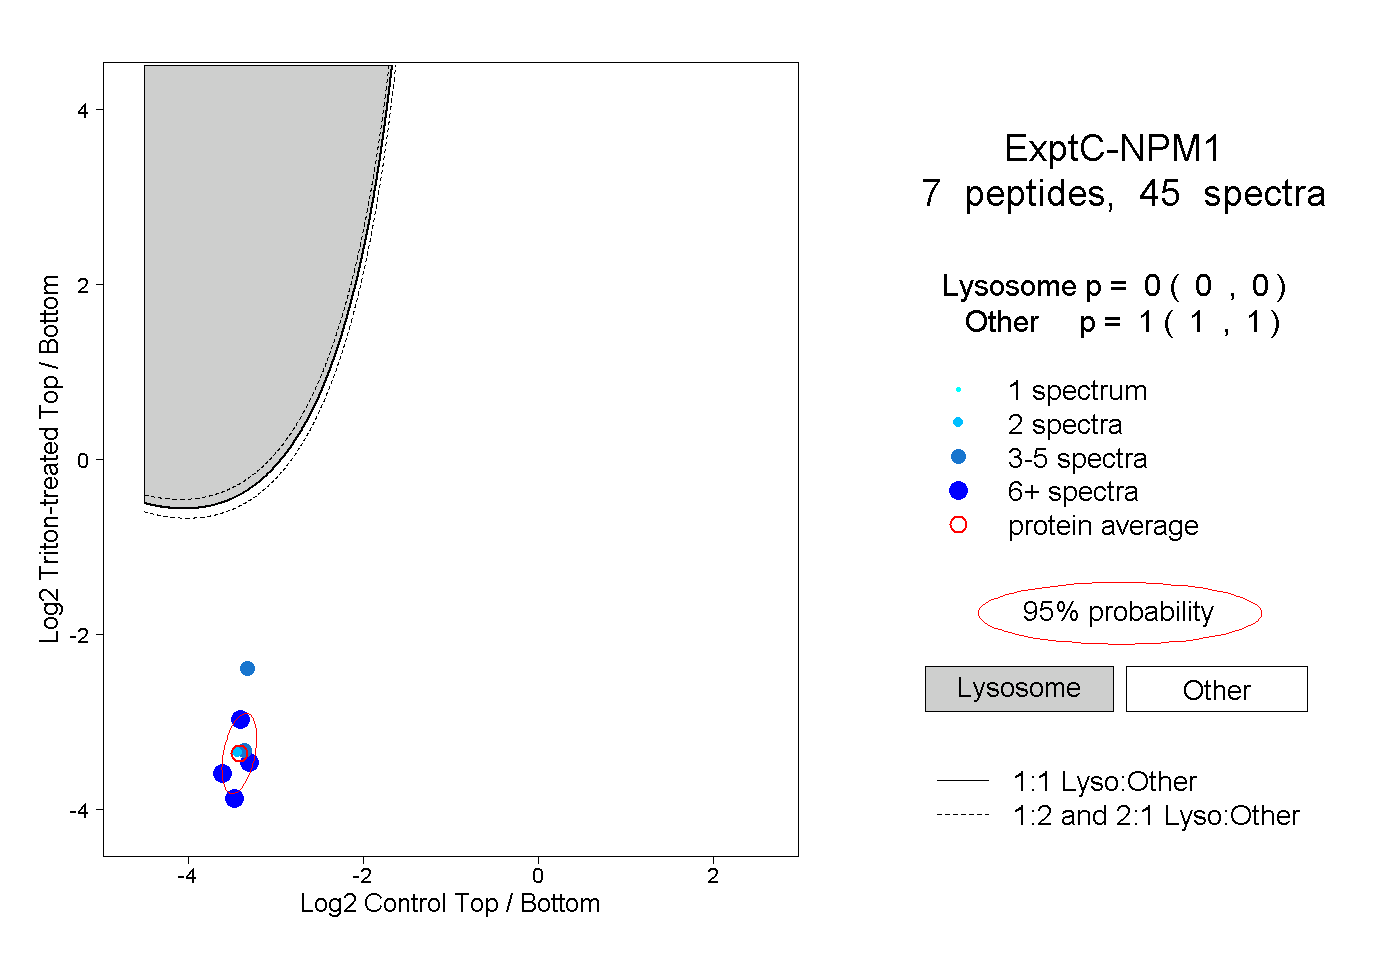
| | | Plot |
|
Lyso |
|
|
|
|
|
|
|
Other |
| Expt C |
7
peptides |
45
spectra |
 |
|
0.000
0.000 | 0.000 |
|
|
|
|
|
|
|
1.000
1.000 | 1.000 |
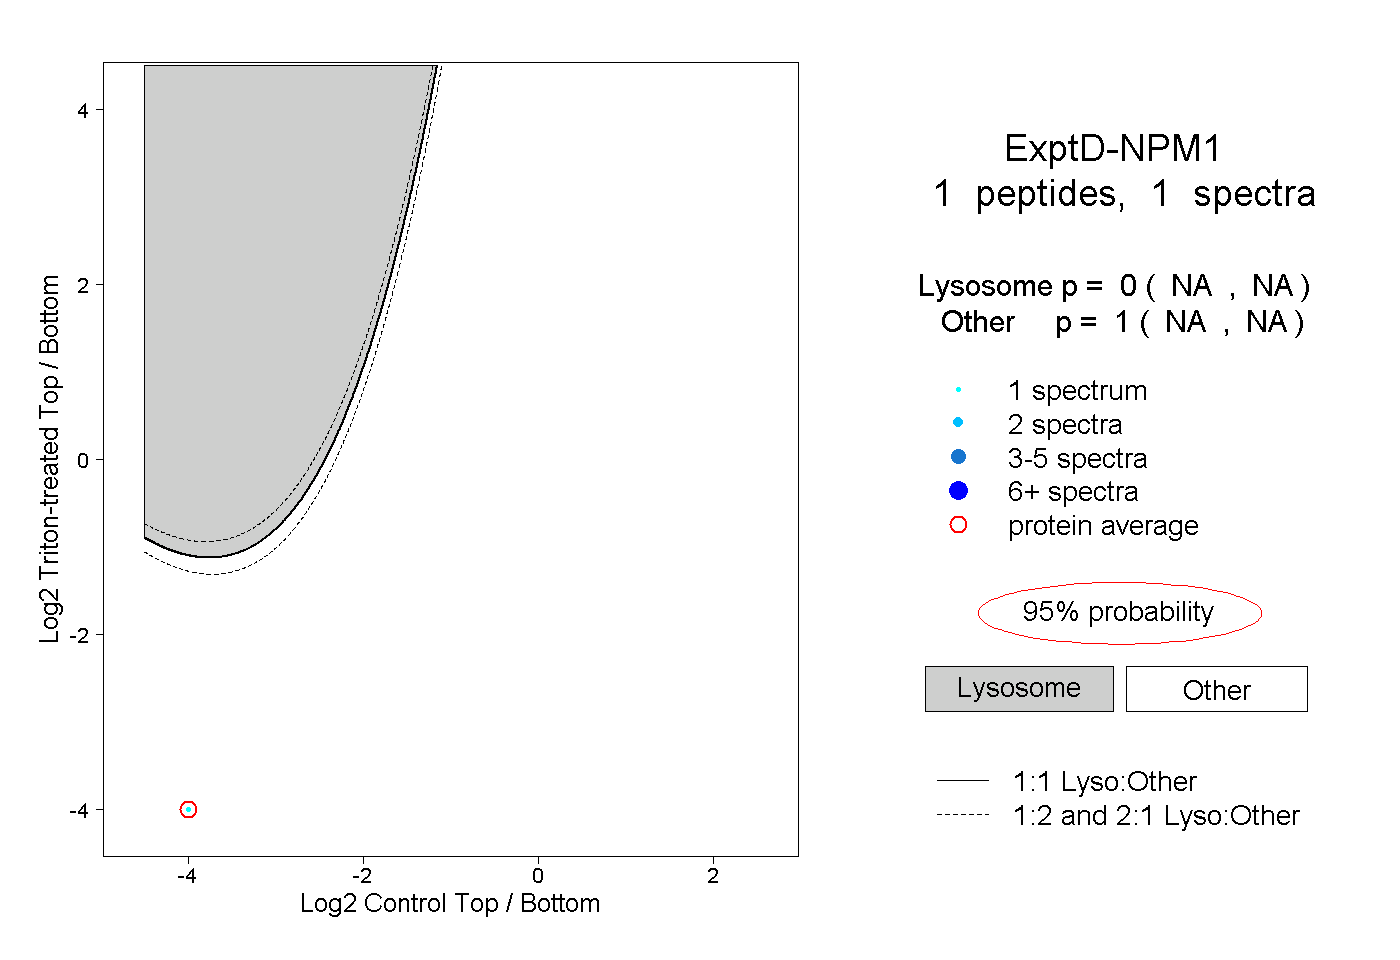
| | | Plot |
|
Lyso |
|
|
|
|
|
|
|
Other |
| Expt D |
1
peptide |
1
spectrum |
 |
|
0.000
NA | NA |
|
|
|
|
|
|
|
1.000
NA | NA |