 12
12peptides
spectra
0.000 | 0.000
0.000 | 0.000
0.000 | 0.000
0.142 | 0.163
0.000 | 0.000
0.000 | 0.000
0.472 | 0.488
0.357 | 0.374
| Plot | Mito | Lyso | Perox | ER | Golgi | PM | Cytosol | Nucleus | |||||
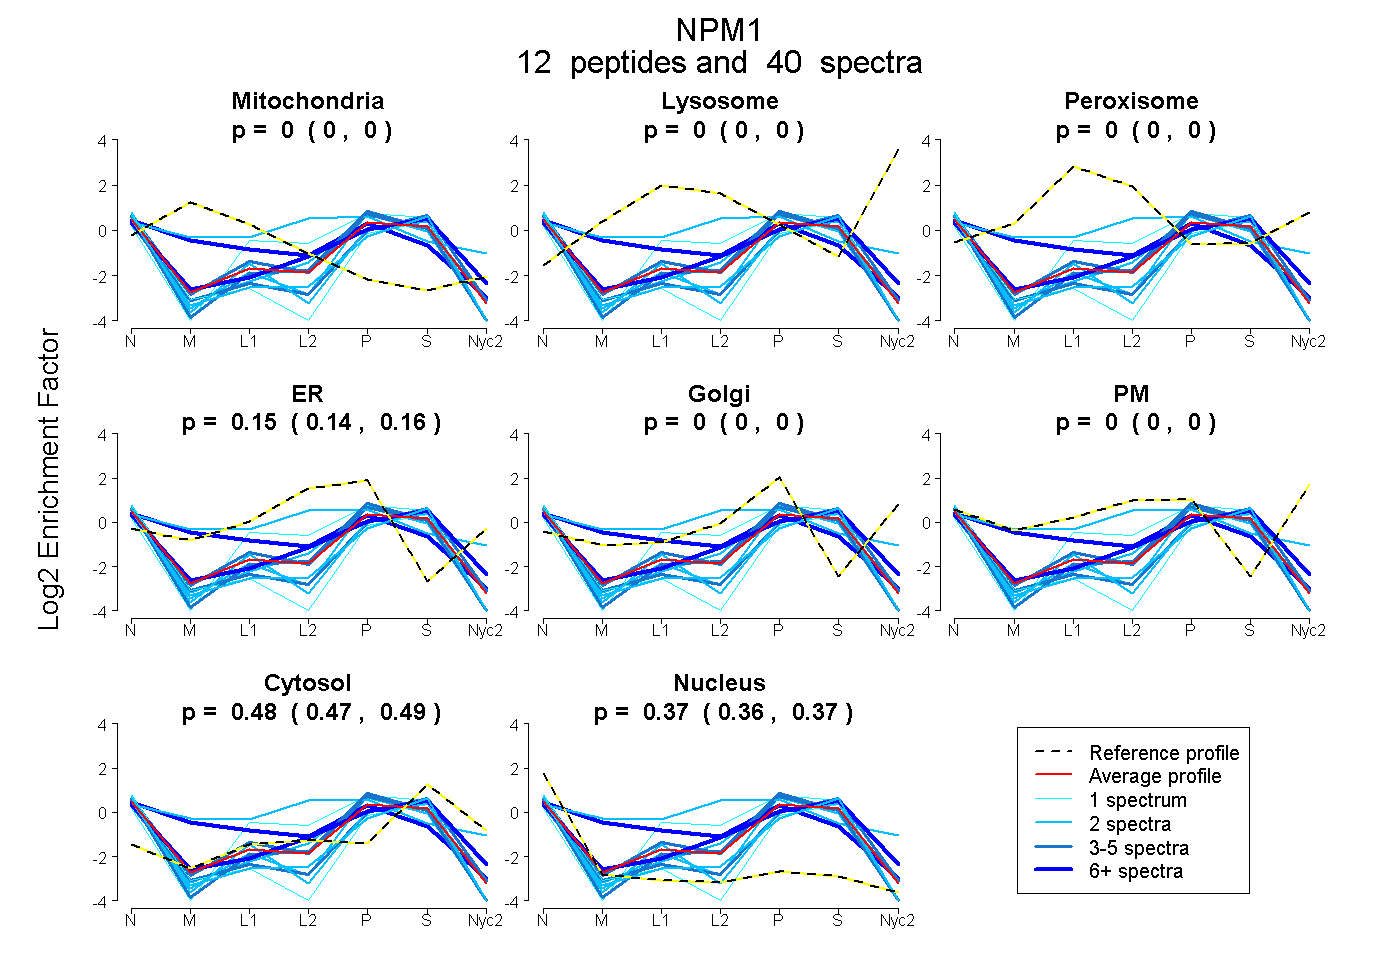
| Expt A |
12 peptides |
40 spectra |
|
0.000 0.000 | 0.000 |
0.000 0.000 | 0.000 |
0.000 0.000 | 0.000 |
0.154 0.142 | 0.163 |
0.000 0.000 | 0.000 |
0.000 0.000 | 0.000 |
0.480 0.472 | 0.488 |
0.365 0.357 | 0.374 |
| 2 spectra, VTLATLK | 0.000 | 0.000 | 0.000 | 0.000 | 0.000 | 0.000 | 0.526 | 0.474 | ||
| 1 spectrum, GGSLPK | 0.000 | 0.000 | 0.000 | 0.228 | 0.000 | 0.000 | 0.532 | 0.239 | ||
| 3 spectra, GQESFK | 0.000 | 0.000 | 0.000 | 0.205 | 0.000 | 0.000 | 0.442 | 0.353 | ||
| 2 spectra, FINYVK | 0.000 | 0.000 | 0.000 | 0.180 | 0.000 | 0.000 | 0.370 | 0.449 | ||
| 5 spectra, LLGMSGK | 0.000 | 0.000 | 0.000 | 0.000 | 0.000 | 0.000 | 0.602 | 0.398 | ||
| 8 spectra, GPSSVEDIK | 0.240 | 0.000 | 0.000 | 0.296 | 0.000 | 0.000 | 0.250 | 0.213 | ||
| 4 spectra, MTDQEAIQDLWQWR | 0.000 | 0.000 | 0.000 | 0.137 | 0.000 | 0.000 | 0.433 | 0.430 | ||
| 1 spectrum, MSVQPTVSLGGFEITPPVVLR | 0.000 | 0.000 | 0.000 | 0.000 | 0.000 | 0.000 | 0.421 | 0.579 | ||
| 2 spectra, DLKPSTPR | 0.000 | 0.000 | 0.000 | 0.068 | 0.000 | 0.000 | 0.445 | 0.487 | ||
| 8 spectra, VDNDENEHQLSLR | 0.000 | 0.000 | 0.000 | 0.156 | 0.000 | 0.000 | 0.586 | 0.258 | ||
| 2 spectra, TVSLGAGAK | 0.000 | 0.000 | 0.000 | 0.000 | 0.000 | 0.000 | 0.509 | 0.491 | ||
| 2 spectra, MQASIEK | 0.110 | 0.000 | 0.122 | 0.472 | 0.000 | 0.000 | 0.270 | 0.027 |
| Plot | Mito | Lyso or Perox | ER | Golgi | PM | Cytosol | Nucleus | ||||||
| Expt B |
3 peptides |
5 spectra |
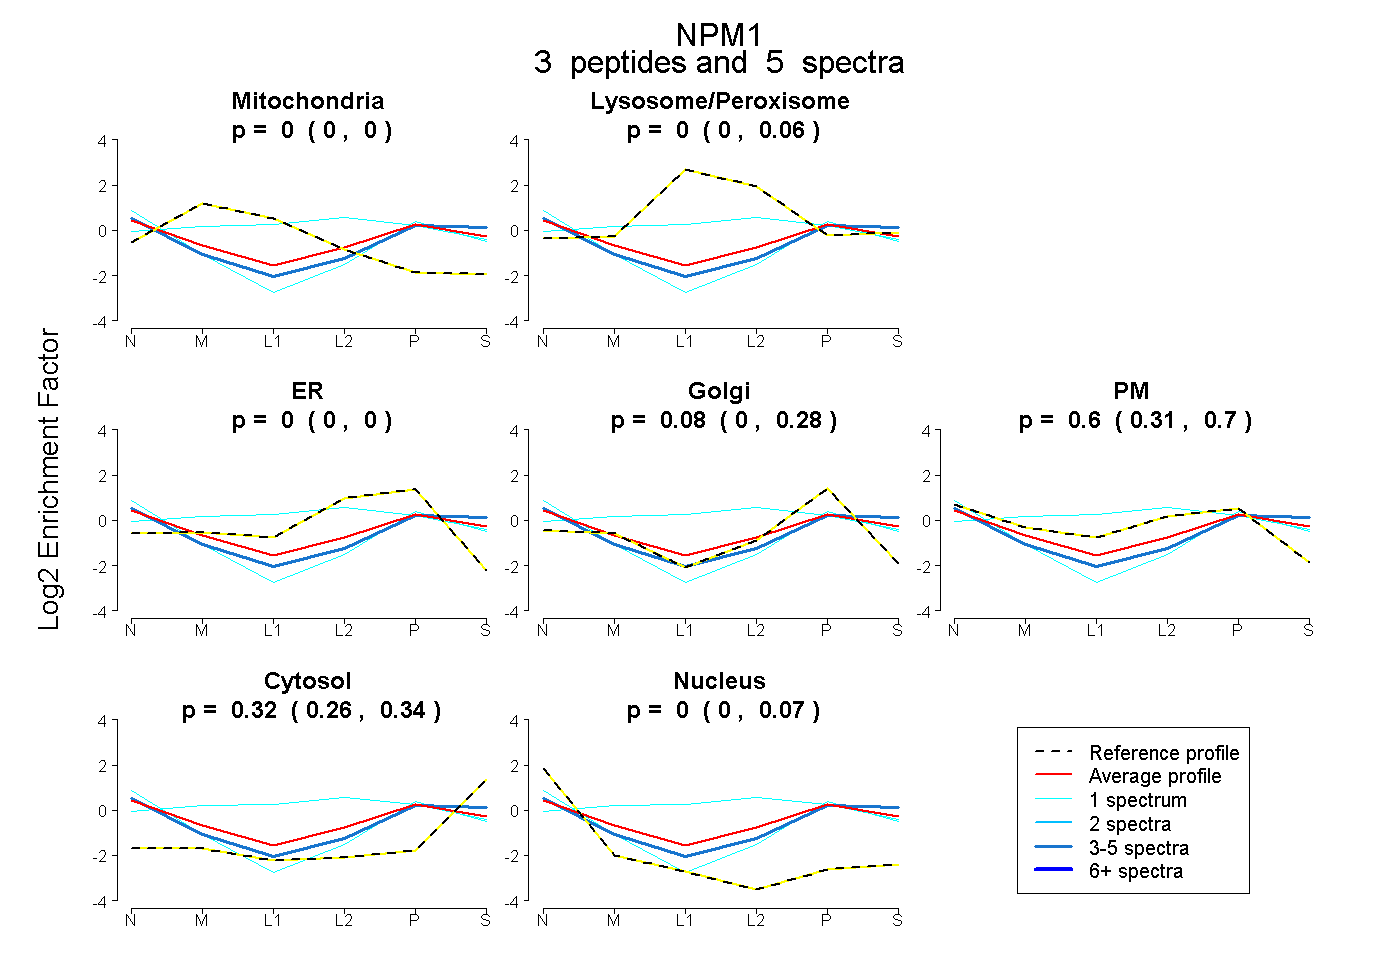 |
0.000 0.000 | 0.000 |
0.000 0.000 | 0.058 |
0.000 0.000 | 0.000 |
0.080 0.000 | 0.281 |
0.603 0.312 | 0.701 |
0.317 0.259 | 0.339 |
0.000 0.000 | 0.068 |
|||
| Plot | Lyso | Other | |||||||||||
| Expt C |
7 peptides |
45 spectra |
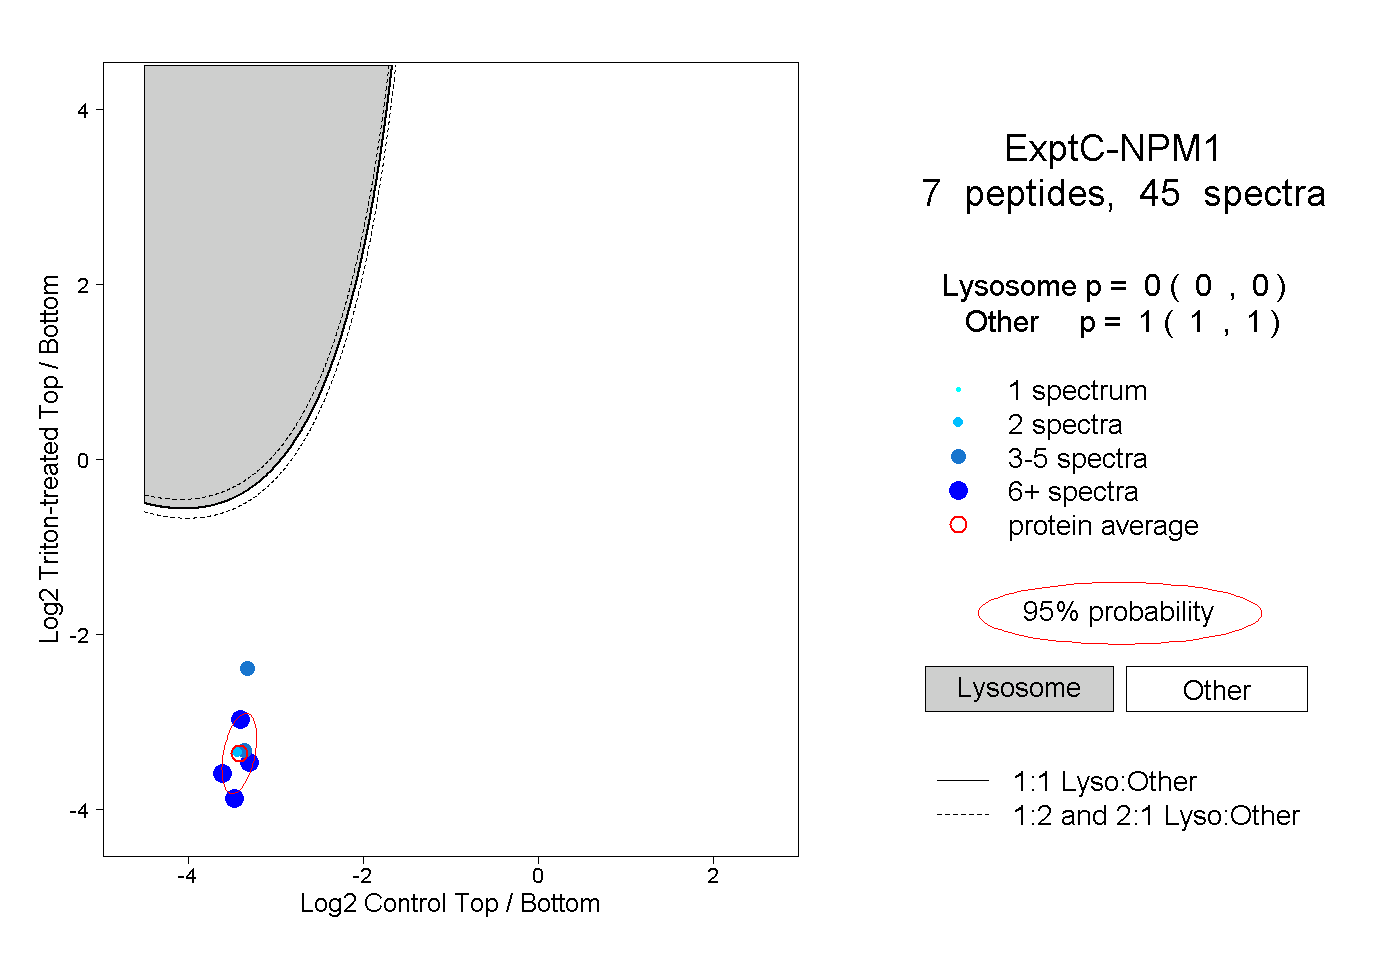 |
0.000 0.000 | 0.000 |
1.000 1.000 | 1.000 |
||||||||
| Plot | Lyso | Other | |||||||||||
| Expt D |
1 peptide |
1 spectrum |
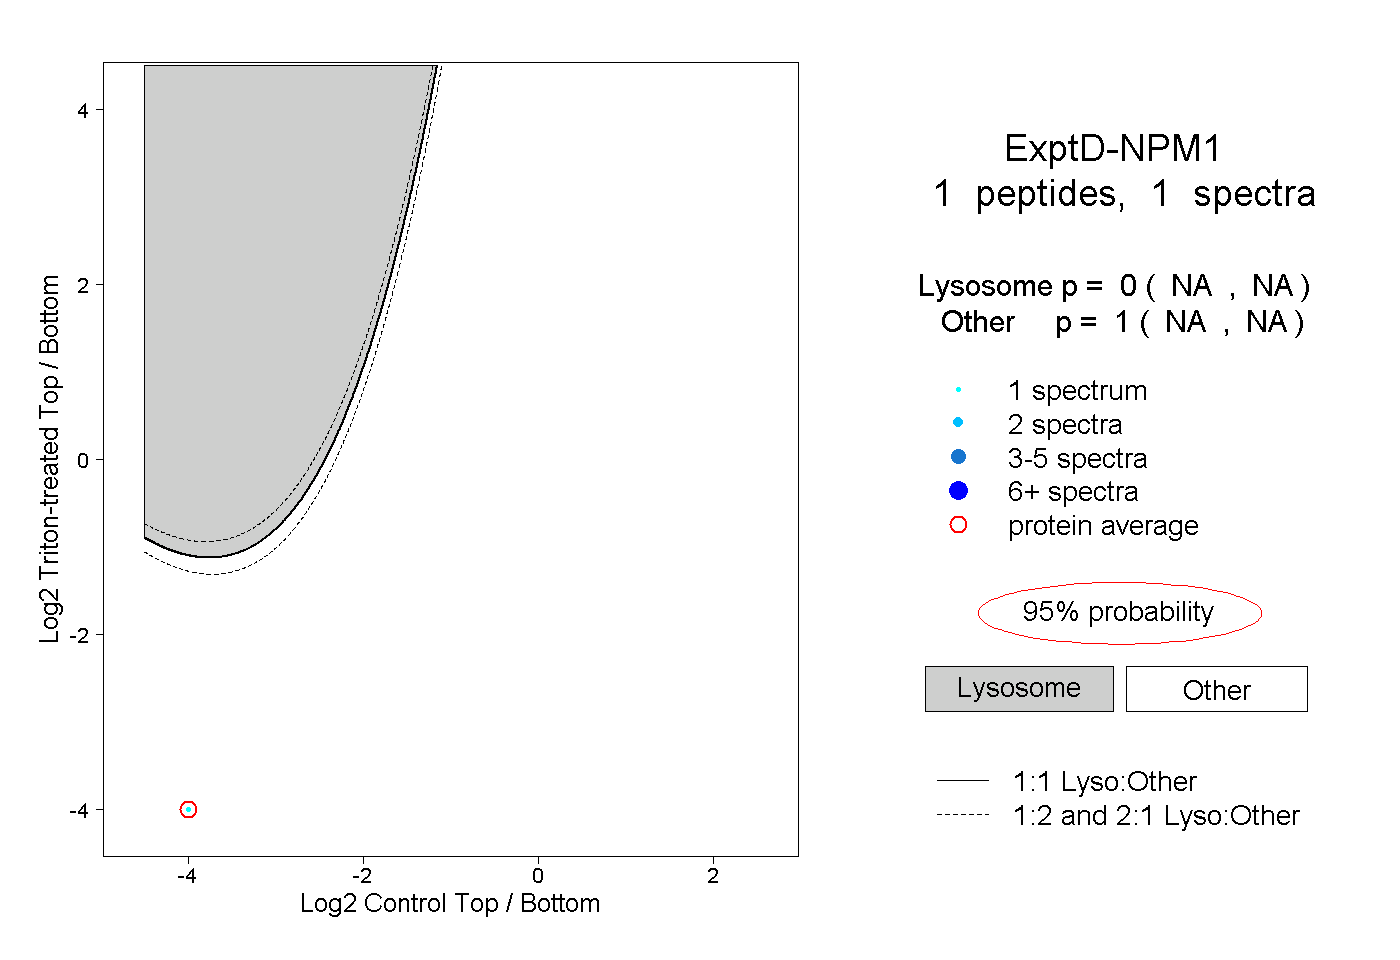 |
0.000 NA | NA |
1.000 NA | NA |