 12
12peptides
spectra
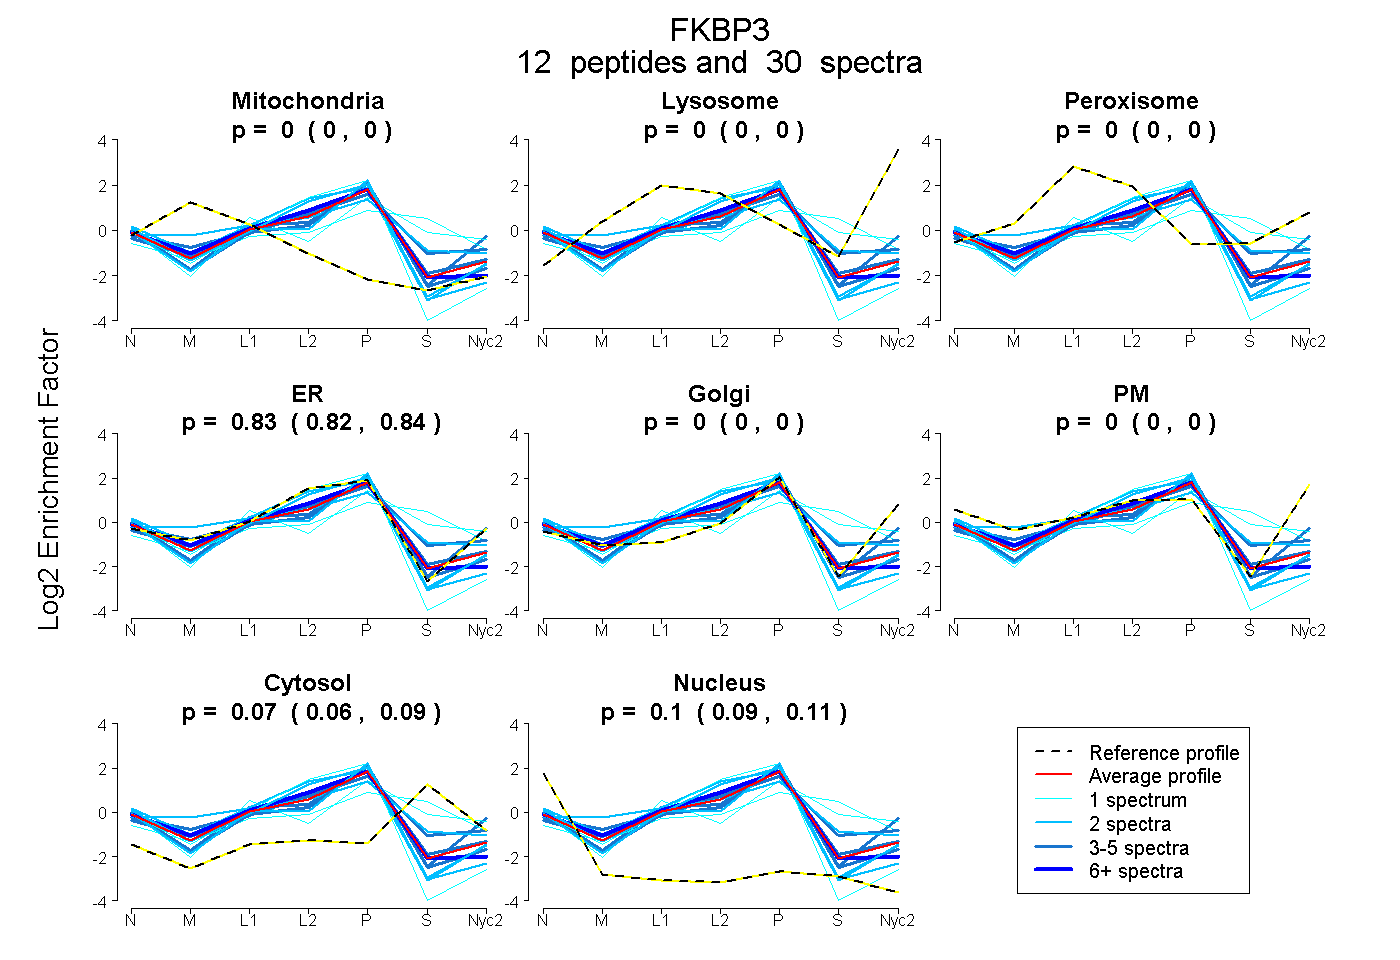
0.000 | 0.000
0.000 | 0.000
0.000 | 0.000
0.820 | 0.836
0.000 | 0.000
0.000 | 0.000
0.058 | 0.085
0.088 | 0.106
5peptides
spectra
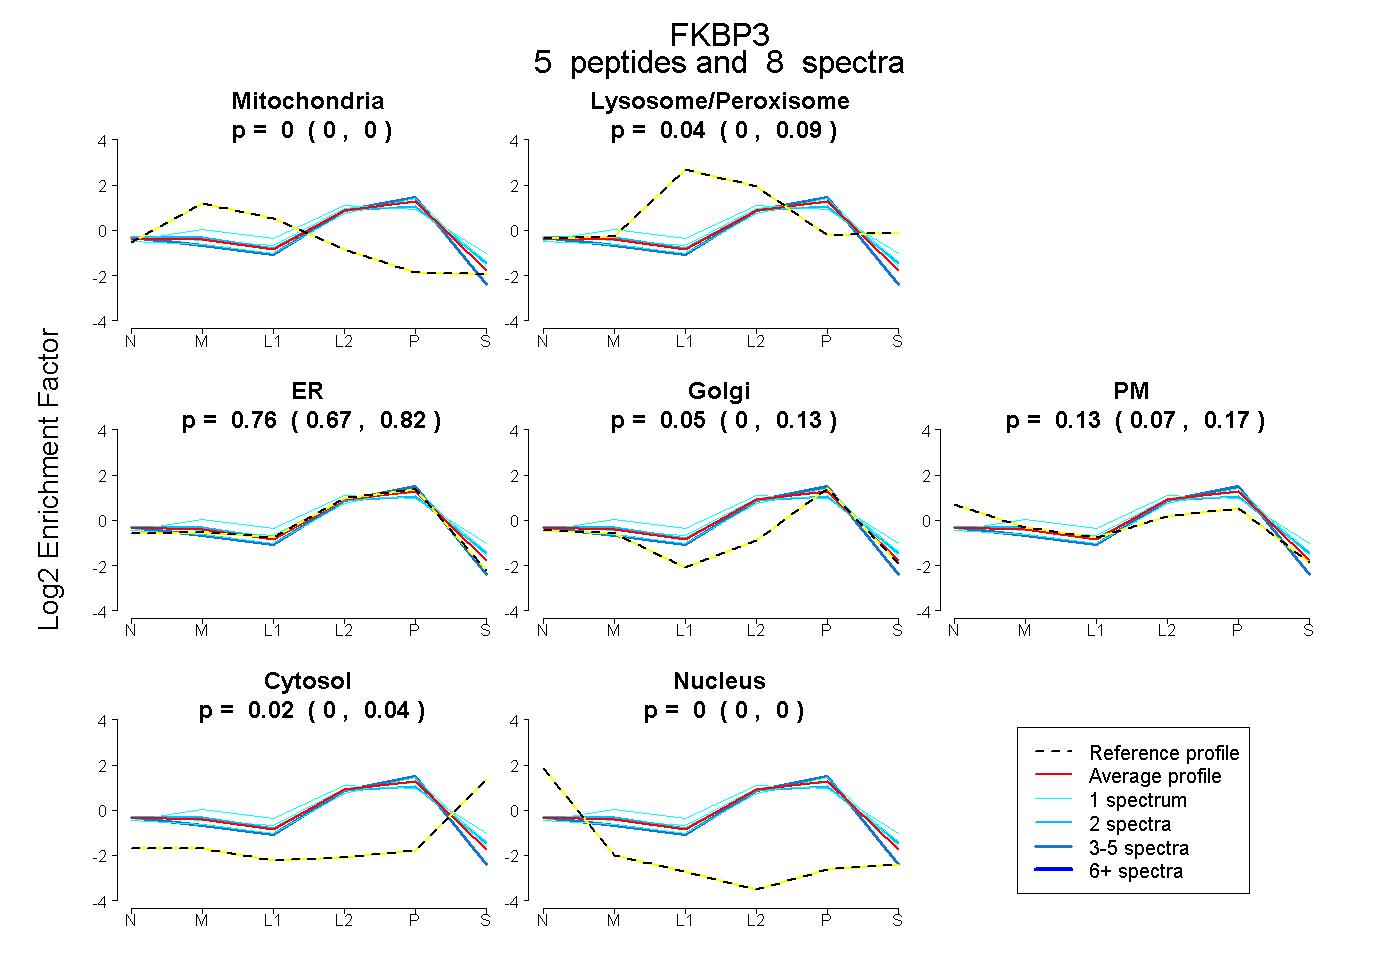
0.000 | 0.000
0.000 | 0.086
0.673 | 0.824
0.000 | 0.133
0.065 | 0.167
0.000 | 0.043
0.000 | 0.000
11peptides
spectra
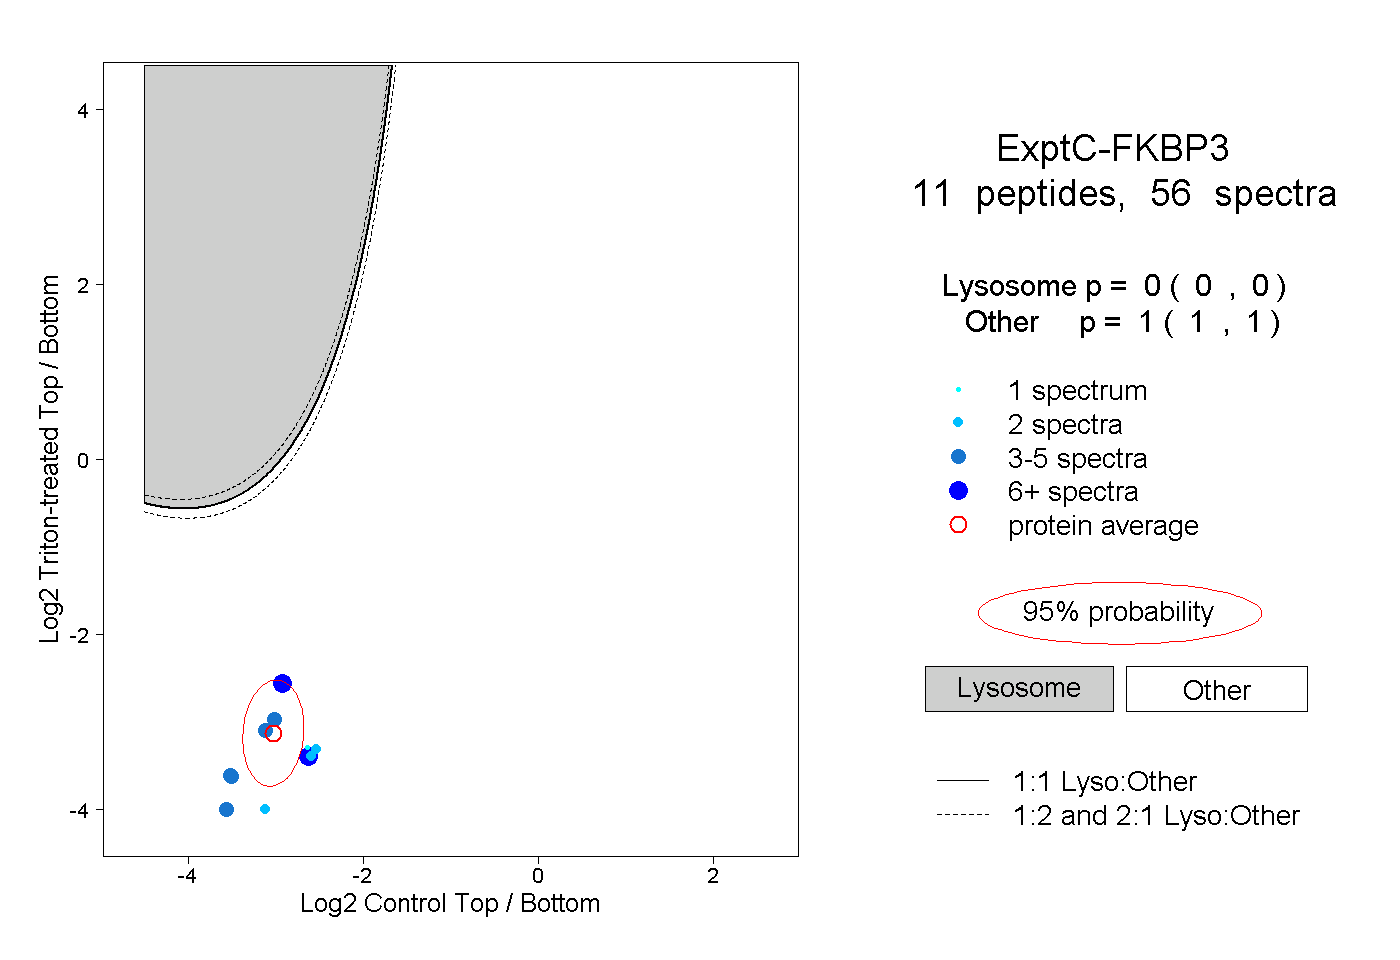
0.000 | 0.000
1.000 | 1.000
4peptides
spectra
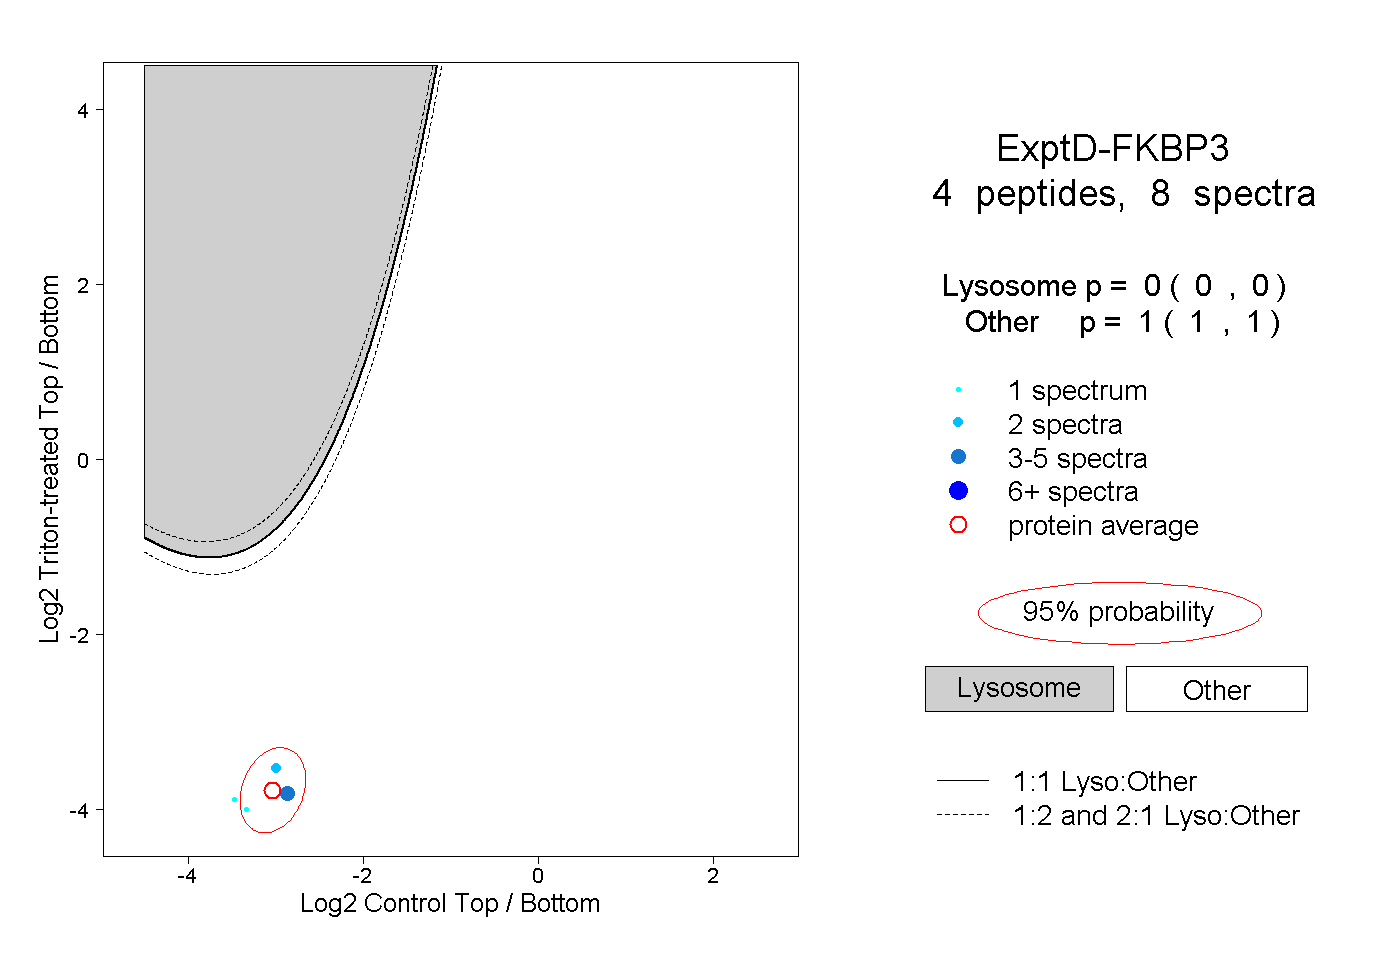
0.000 | 0.000
1.000 | 1.000