 12
12peptides
spectra
0.000 | 0.000
0.000 | 0.000
0.000 | 0.000
0.820 | 0.836
0.000 | 0.000
0.000 | 0.000
0.058 | 0.085
0.088 | 0.106
| Plot | Mito | Lyso | Perox | ER | Golgi | PM | Cytosol | Nucleus | |||||
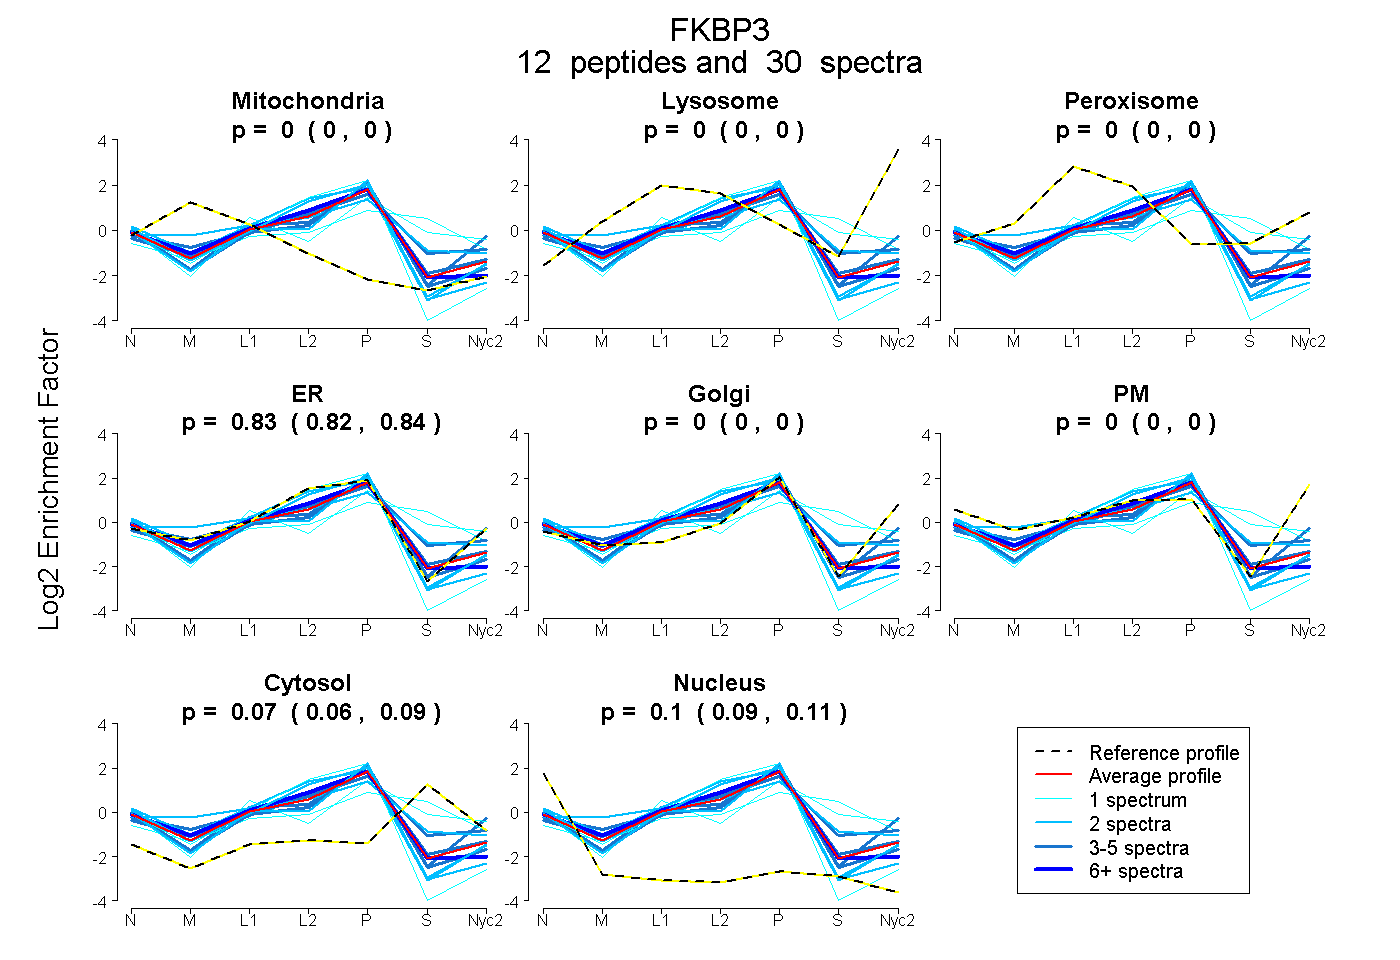
| Expt A |
12 peptides |
30 spectra |
|
0.000 0.000 | 0.000 |
0.000 0.000 | 0.000 |
0.000 0.000 | 0.000 |
0.828 0.820 | 0.836 |
0.000 0.000 | 0.000 |
0.000 0.000 | 0.000 |
0.073 0.058 | 0.085 |
0.098 0.088 | 0.106 |
| 3 spectra, LLGNIK | 0.000 | 0.000 | 0.000 | 0.822 | 0.000 | 0.000 | 0.000 | 0.178 | ||
| 2 spectra, SEQLPK | 0.000 | 0.000 | 0.000 | 0.788 | 0.000 | 0.000 | 0.000 | 0.212 | ||
| 2 spectra, GWDEALLTMSK | 0.000 | 0.000 | 0.000 | 0.920 | 0.000 | 0.000 | 0.000 | 0.080 | ||
| 3 spectra, GQPDAK | 0.040 | 0.000 | 0.000 | 0.821 | 0.000 | 0.000 | 0.091 | 0.048 | ||
| 1 spectrum, FLQDHGSDSFLAEHK | 0.000 | 0.000 | 0.131 | 0.213 | 0.280 | 0.000 | 0.376 | 0.000 | ||
| 4 spectra, AWTVEQLR | 0.000 | 0.000 | 0.000 | 0.602 | 0.325 | 0.000 | 0.017 | 0.056 | ||
| 1 spectrum, NAKPLSFK | 0.000 | 0.000 | 0.000 | 0.880 | 0.000 | 0.000 | 0.000 | 0.120 | ||
| 2 spectra, TNFPK | 0.000 | 0.000 | 0.000 | 0.901 | 0.000 | 0.000 | 0.000 | 0.099 | ||
| 2 spectra, LEIEPEWAYGK | 0.087 | 0.000 | 0.105 | 0.611 | 0.000 | 0.000 | 0.197 | 0.000 | ||
| 3 spectra, IPPNTK | 0.000 | 0.000 | 0.000 | 0.736 | 0.000 | 0.000 | 0.264 | 0.000 | ||
| 6 spectra, SEETLDEGPPK | 0.012 | 0.000 | 0.000 | 0.843 | 0.000 | 0.000 | 0.023 | 0.122 | ||
| 1 spectrum, DHLVTAYNHLFESK | 0.000 | 0.000 | 0.085 | 0.388 | 0.000 | 0.000 | 0.527 | 0.000 |
| Plot | Mito | Lyso or Perox | ER | Golgi | PM | Cytosol | Nucleus | ||||||
| Expt B |
5 peptides |
8 spectra |
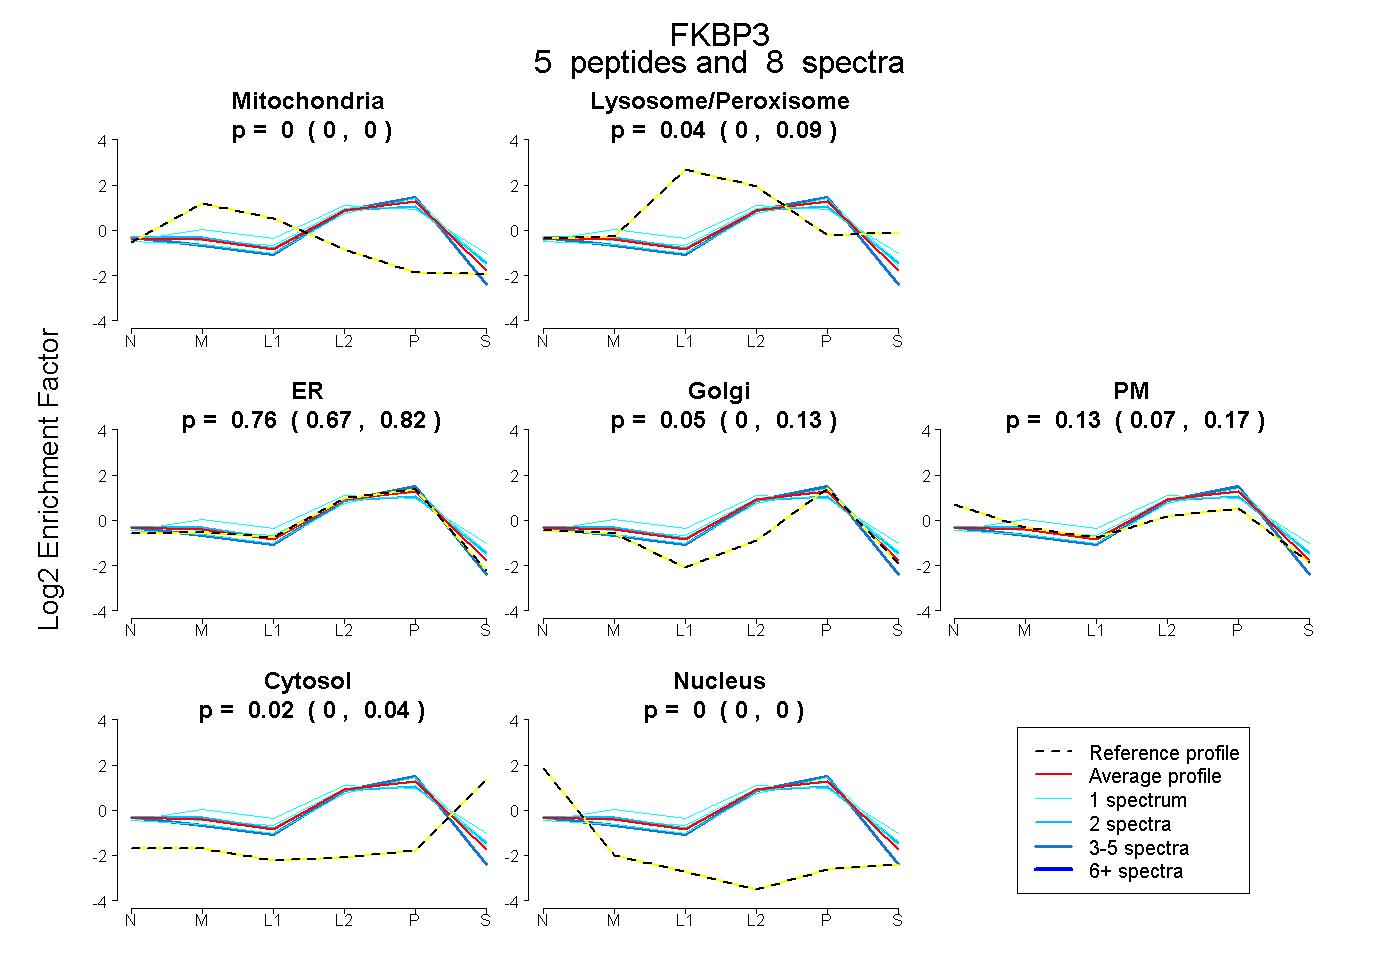 |
0.000 0.000 | 0.000 |
0.038 0.000 | 0.086 |
0.765 0.673 | 0.824 |
0.049 0.000 | 0.133 |
0.127 0.065 | 0.167 |
0.022 0.000 | 0.043 |
0.000 0.000 | 0.000 |
|||
| Plot | Lyso | Other | |||||||||||
| Expt C |
11 peptides |
56 spectra |
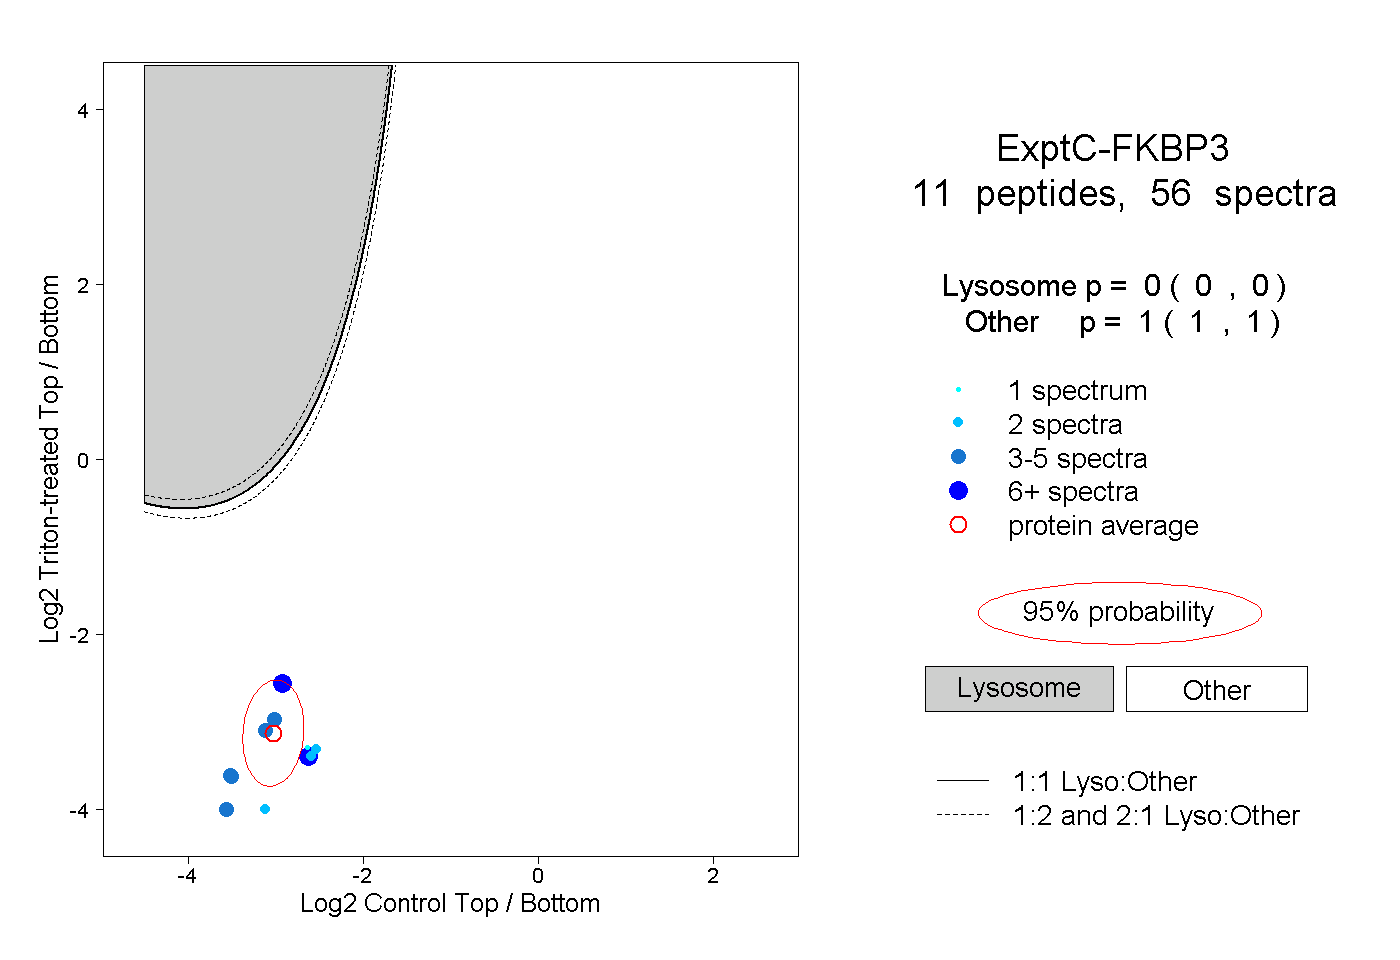 |
0.000 0.000 | 0.000 |
1.000 1.000 | 1.000 |
||||||||
| Plot | Lyso | Other | |||||||||||
| Expt D |
4 peptides |
8 spectra |
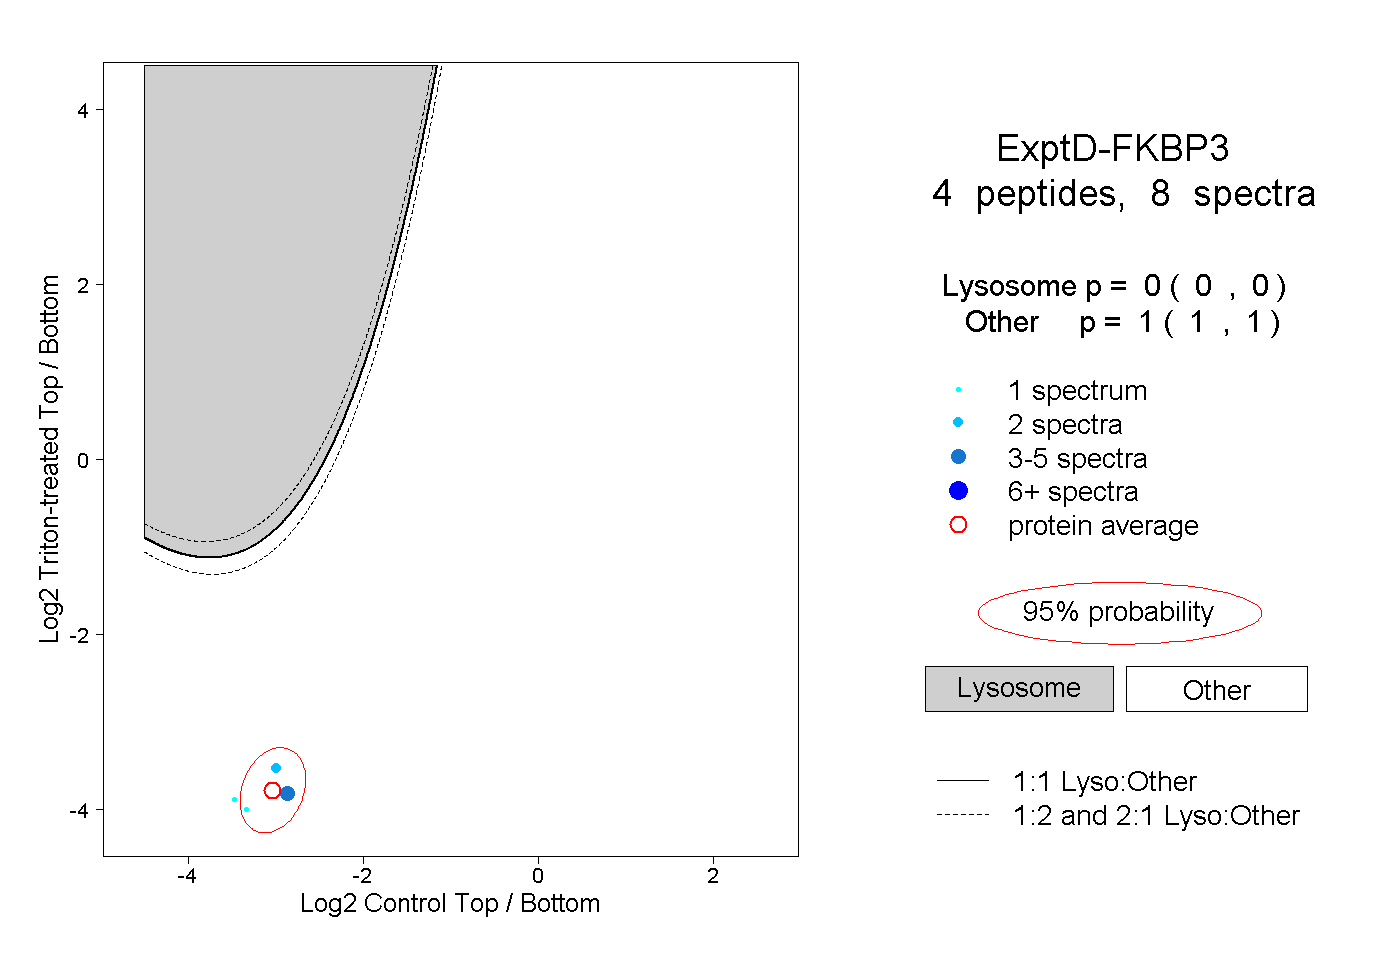 |
0.000 0.000 | 0.000 |
1.000 1.000 | 1.000 |