FKBP3
[ENSRNOP00000006531]
Main page
| | | Plot |
Mito |
Lyso |
|
Perox |
ER |
Golgi |
PM |
Cytosol |
Nucleus |
|
| Expt A |
 12
12
peptides |
30
spectra |
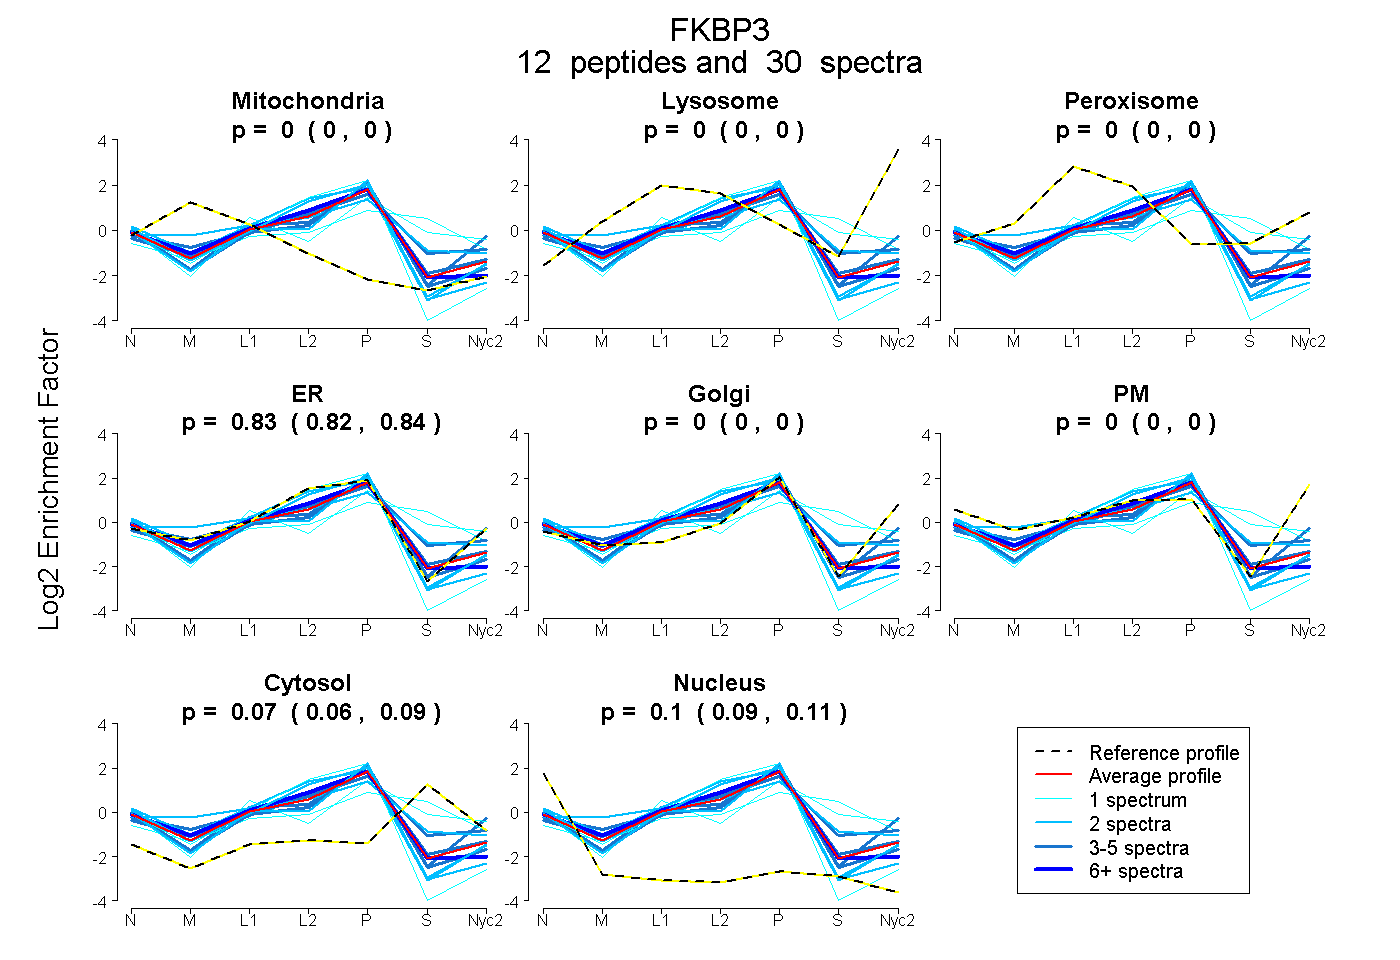 |
0.000
0.000 | 0.000 |
0.000
0.000 | 0.000 |
|
0.000
0.000 | 0.000 |
0.828
0.820 | 0.836 |
0.000
0.000 | 0.000 |
0.000
0.000 | 0.000 |
0.073
0.058 | 0.085 |
0.098
0.088 | 0.106 |
|
| | | Plot |
Mito |
|
Lyso or Perox |
|
ER |
Golgi |
PM |
Cytosol |
Nucleus |
|
| Expt B |
5
peptides |
8
spectra |
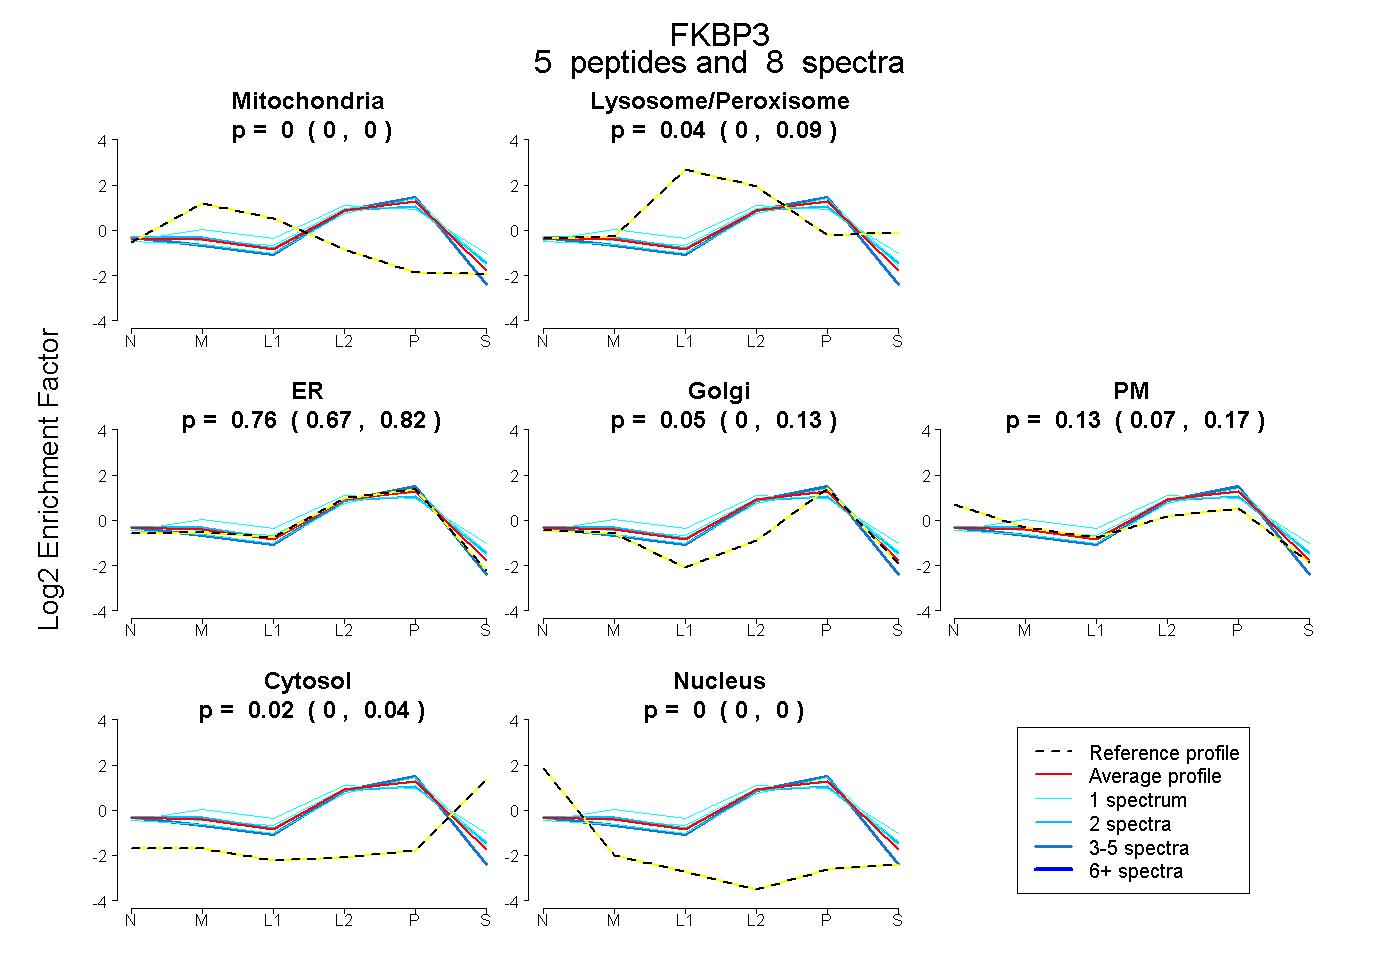 |
0.000
0.000 | 0.000 |
|
0.038
0.000 | 0.086 |
|
0.765
0.673 | 0.824 |
0.049
0.000 | 0.133 |
0.127
0.065 | 0.167 |
0.022
0.000 | 0.043 |
0.000
0.000 | 0.000 |
|
| 1 spectrum, SEQLPK |
0.000 |
|
0.049 |
|
0.732 |
0.181 |
0.000 |
0.039 |
0.000 |
|
| 2 spectra, LEIEPEWAYGK |
0.000 |
|
0.073 |
|
0.655 |
0.016 |
0.198 |
0.058 |
0.000 |
|
| 1 spectrum, IPPNTK |
0.000 |
|
0.148 |
|
0.625 |
0.136 |
0.071 |
0.020 |
0.000 |
|
| 3 spectra, AWTVEQLR |
0.000 |
|
0.000 |
|
0.897 |
0.090 |
0.000 |
0.000 |
0.012 |
|
| 1 spectrum, NAKPLSFK |
0.000 |
|
0.285 |
|
0.509 |
0.165 |
0.007 |
0.034 |
0.000 |
|
| | | Plot |
|
Lyso |
|
|
|
|
|
|
|
Other |
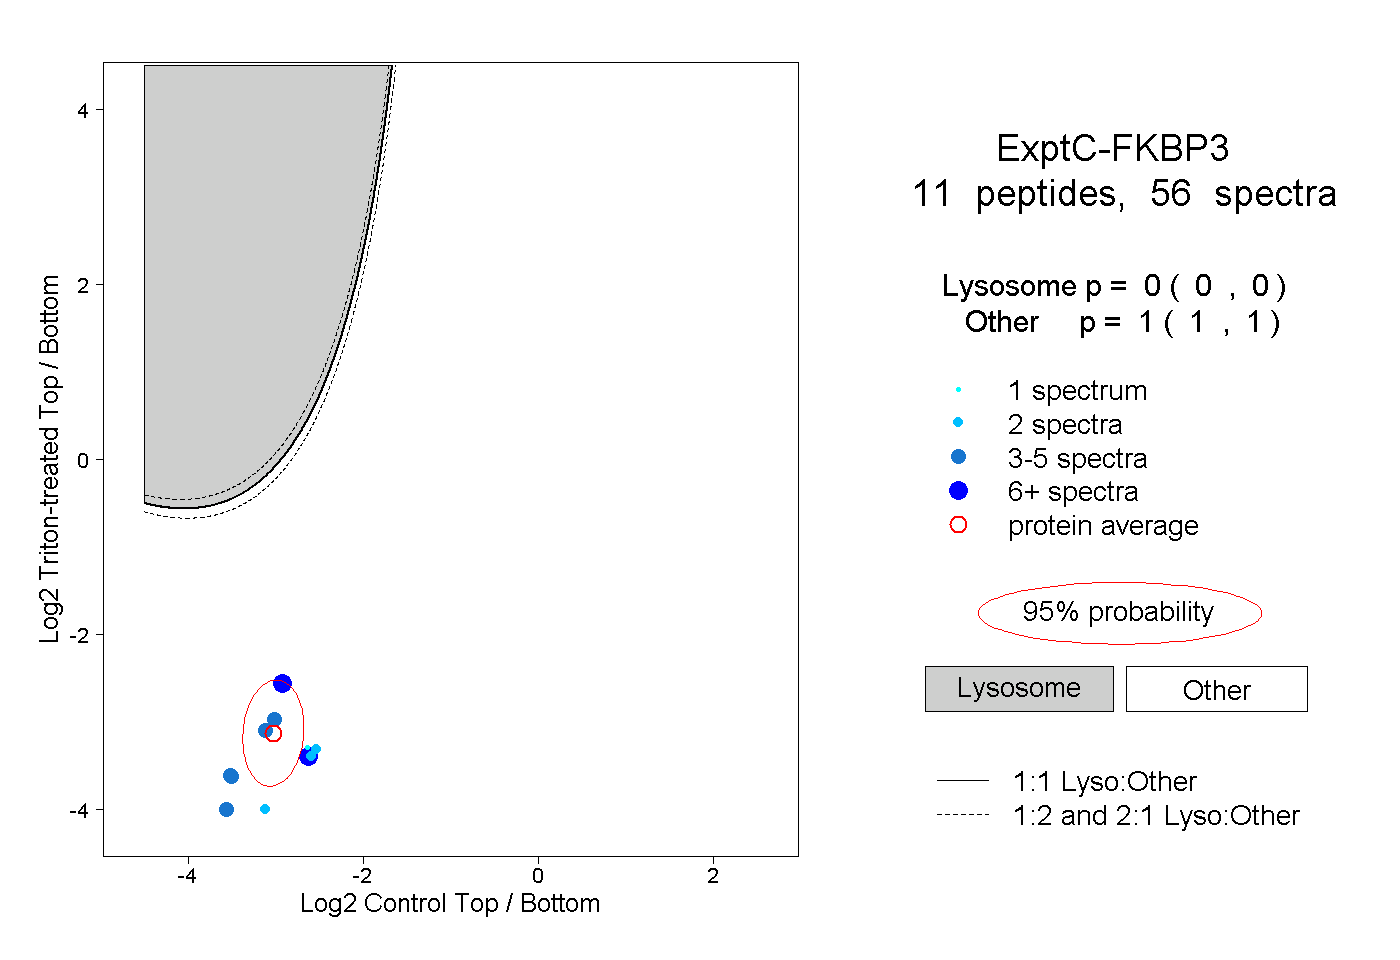
| Expt C |
11
peptides |
56
spectra |
 |
|
0.000
0.000 | 0.000 |
|
|
|
|
|
|
|
1.000
1.000 | 1.000 |
| | | Plot |
|
Lyso |
|
|
|
|
|
|
|
Other |
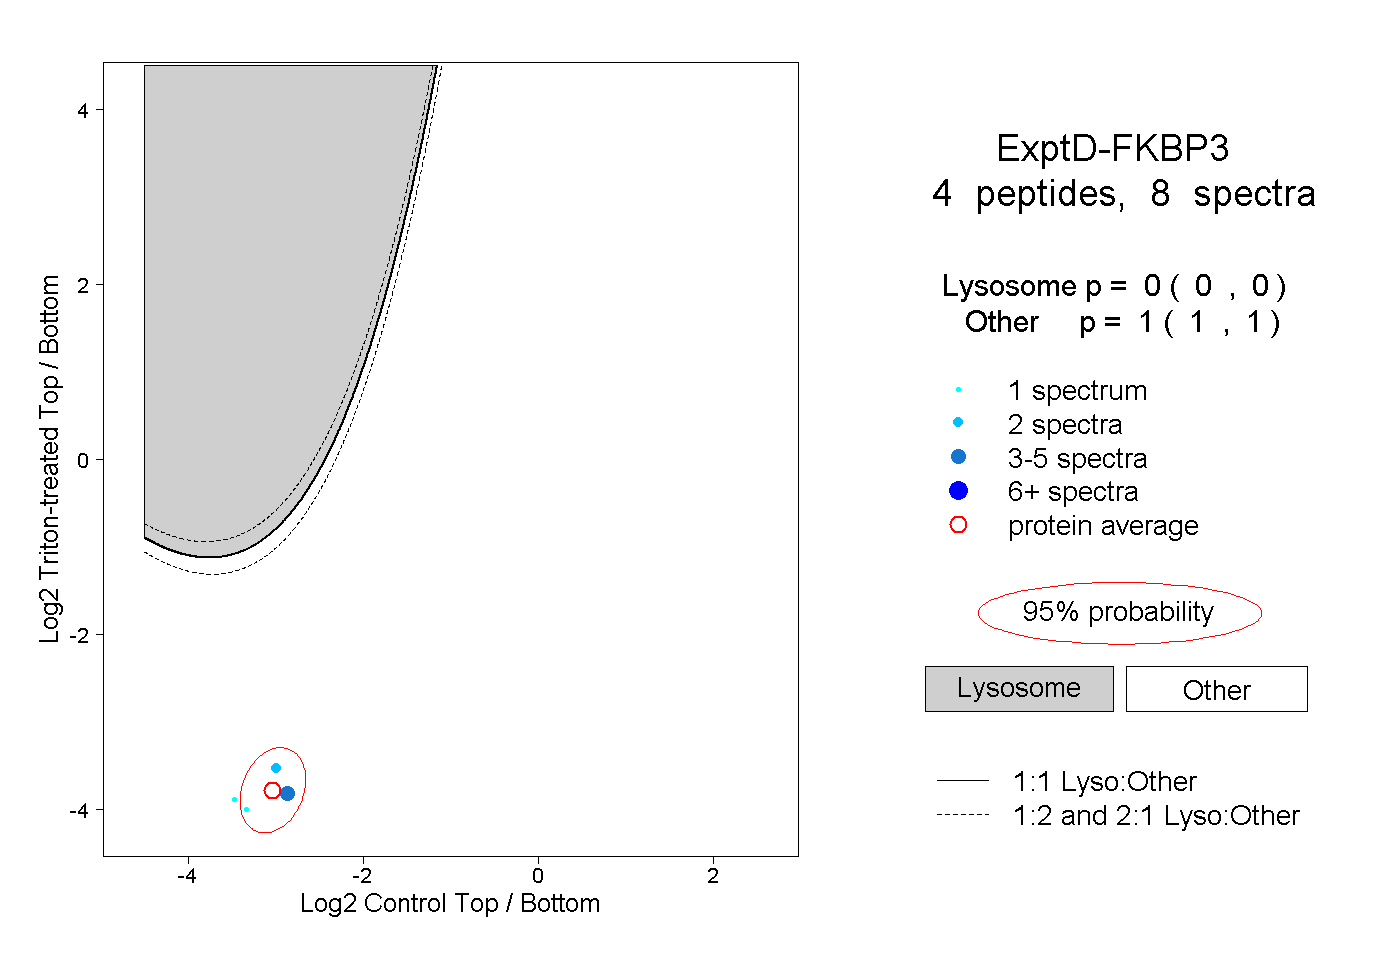
| Expt D |
4
peptides |
8
spectra |
 |
|
0.000
0.000 | 0.000 |
|
|
|
|
|
|
|
1.000
1.000 | 1.000 |