 8
8peptides
spectra
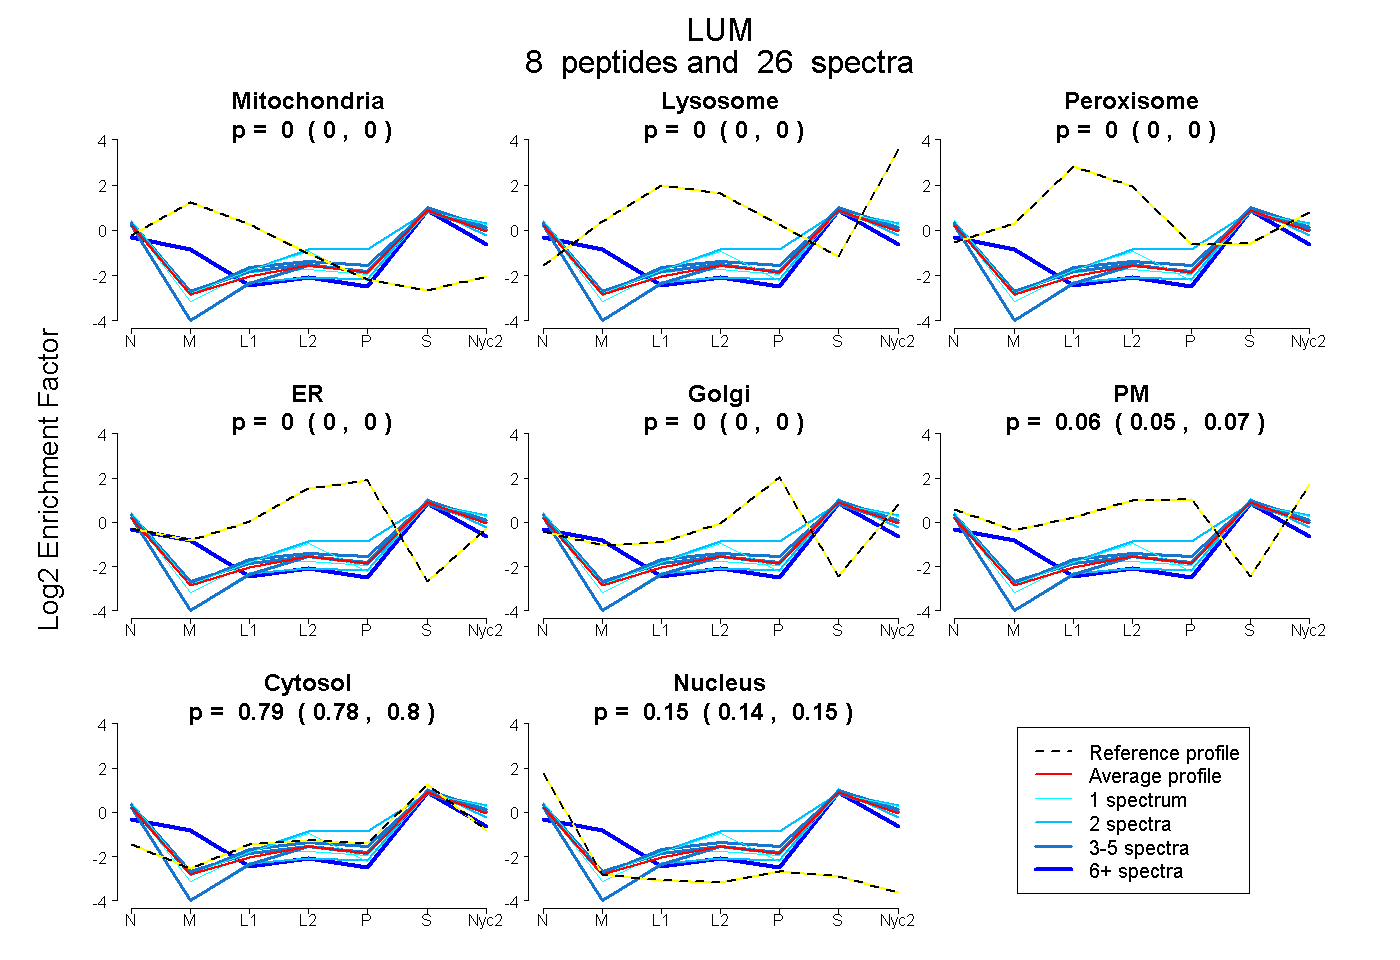
0.000 | 0.000
0.000 | 0.000
0.000 | 0.000
0.000 | 0.000
0.000 | 0.000
0.050 | 0.069
0.784 | 0.798
0.142 | 0.153
4peptides
spectra
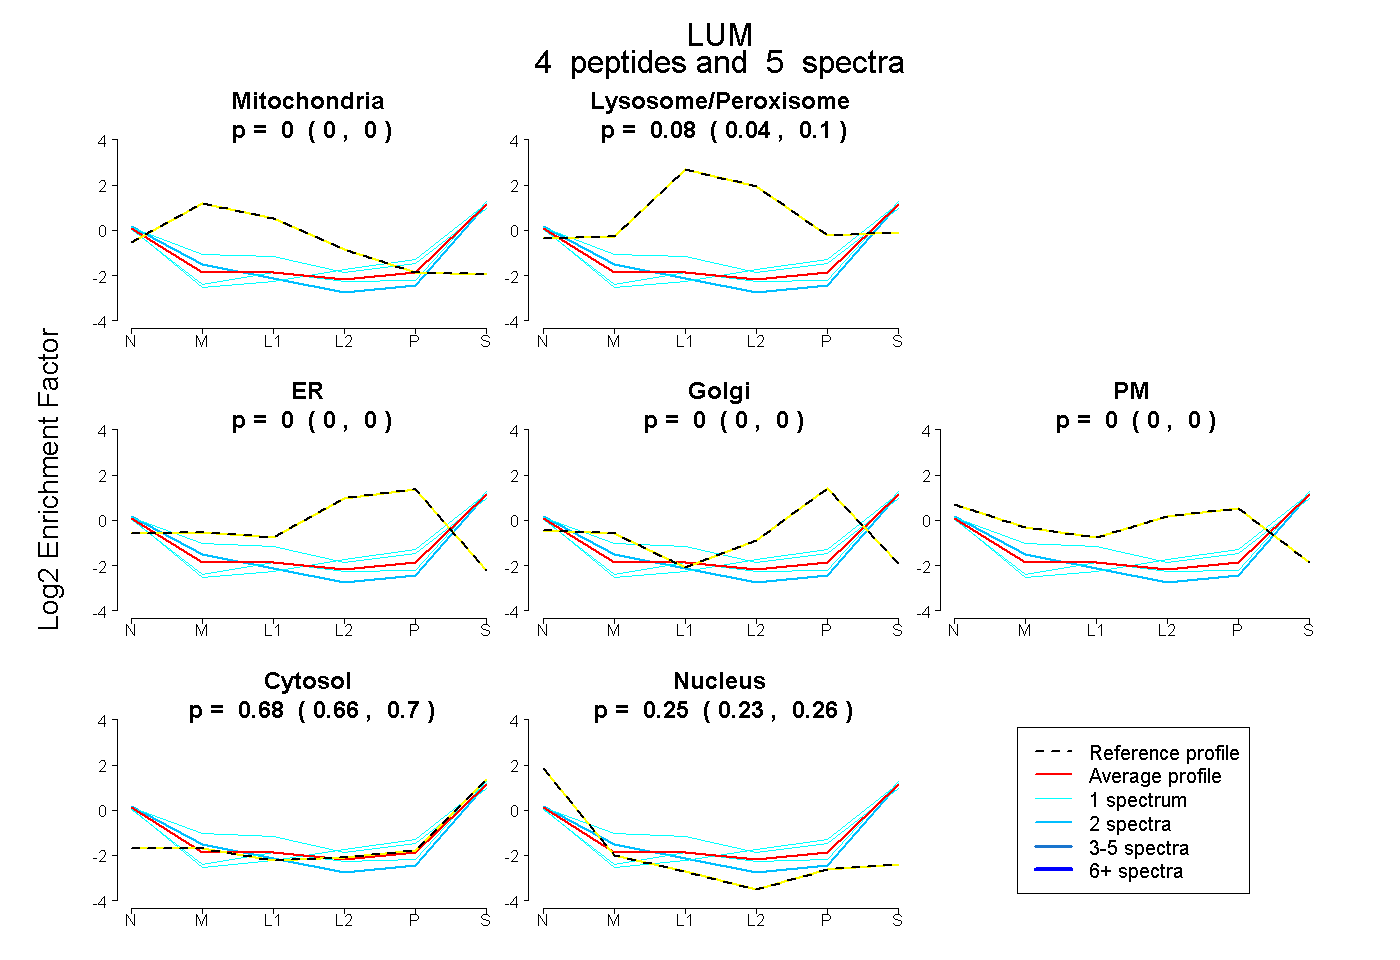
0.000 | 0.000
0.044 | 0.102
0.000 | 0.000
0.000 | 0.000
0.000 | 0.000
0.656 | 0.698
0.231 | 0.259
5peptides
spectra
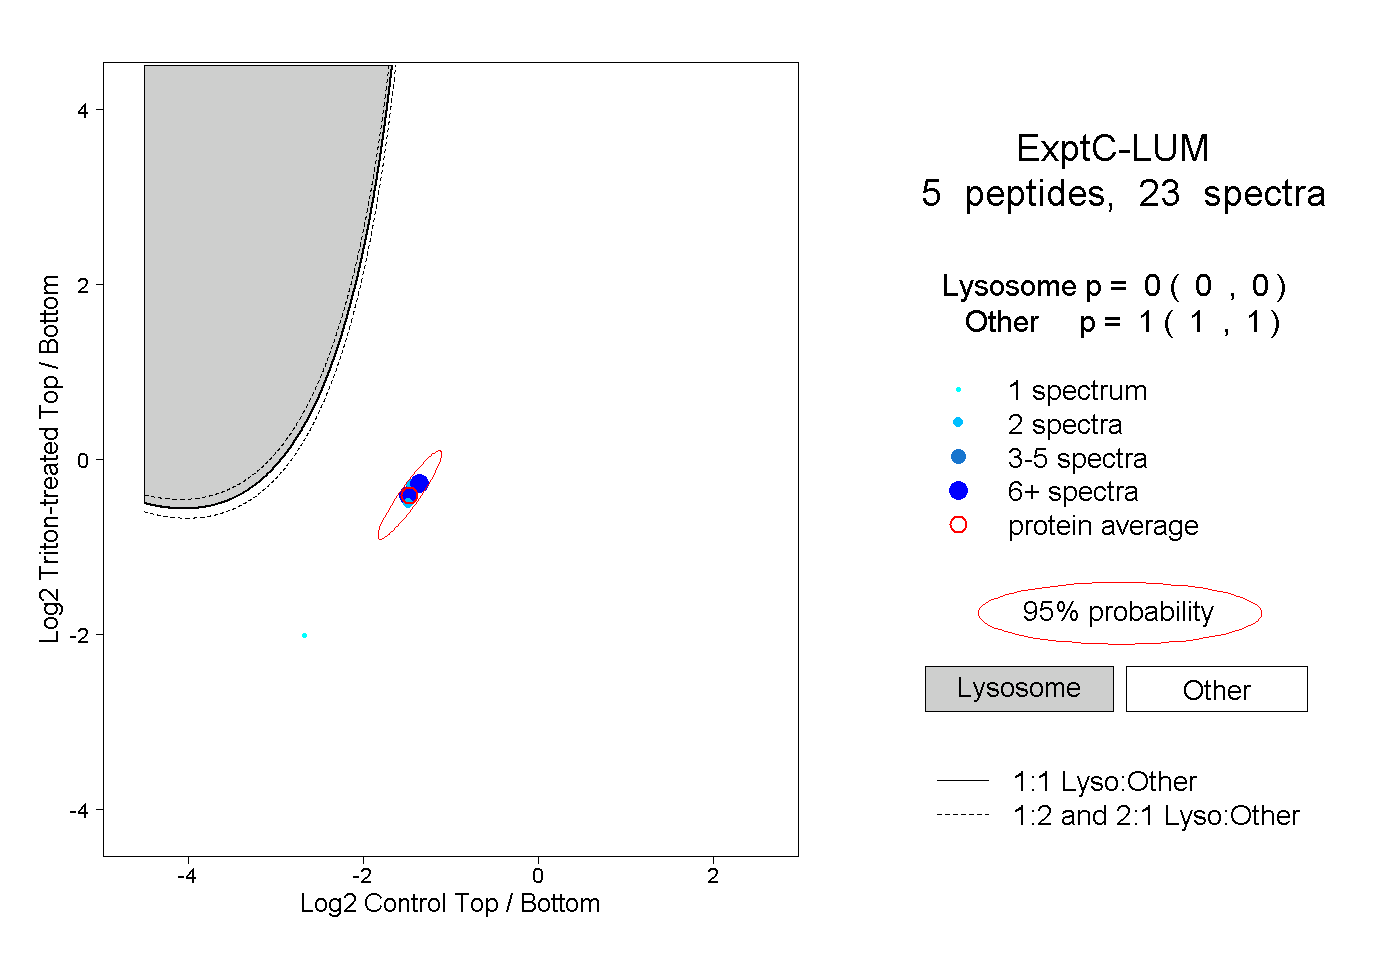
0.000 | 0.000
1.000 | 1.000
2peptides
spectra
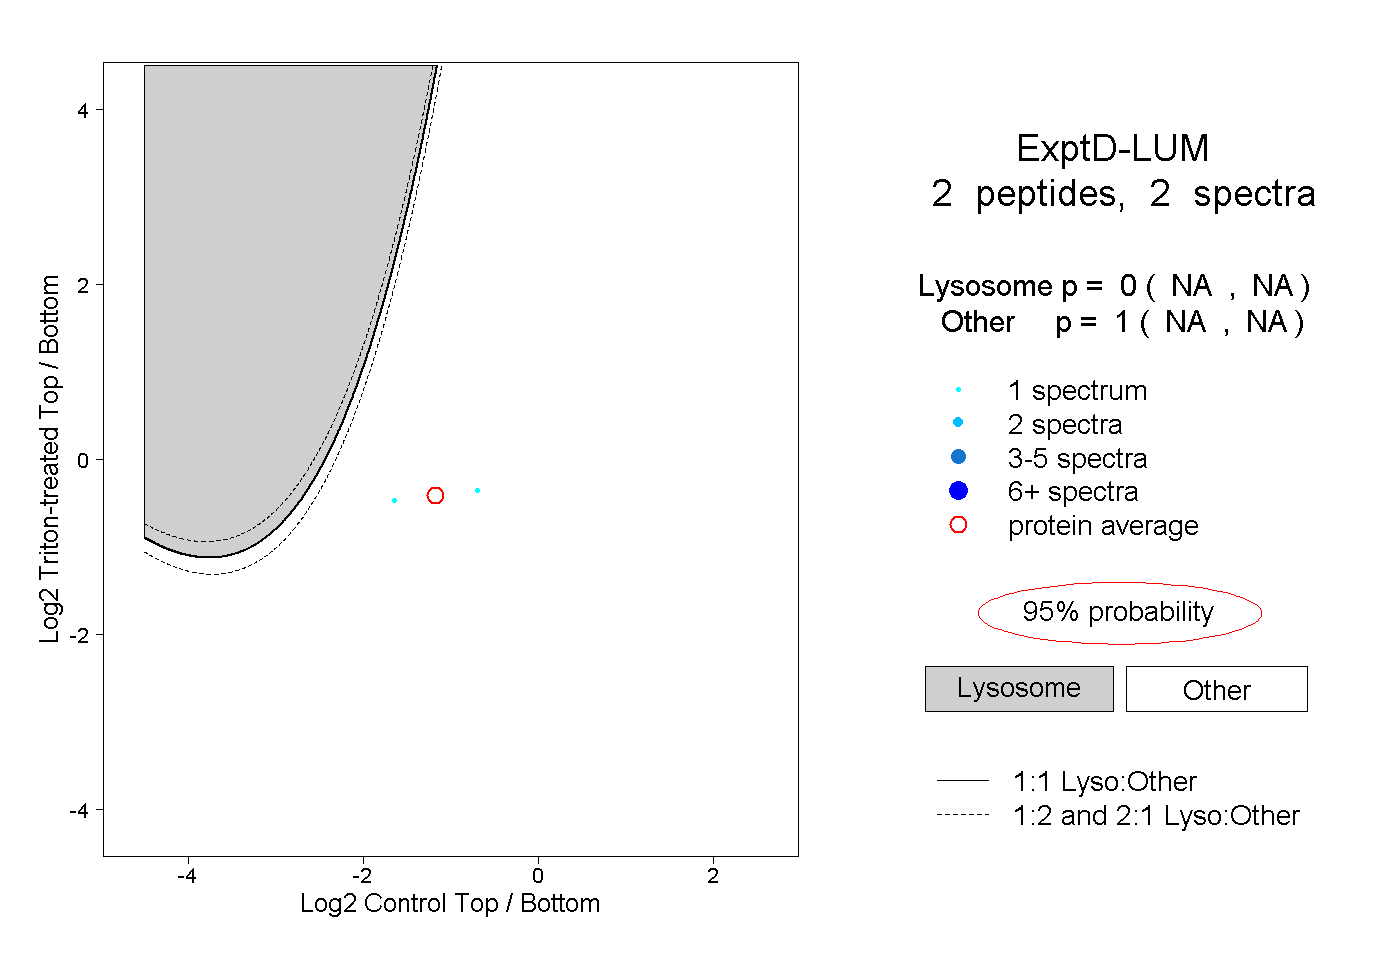
NA | NA
NA | NA