LUM
[ENSRNOP00000006109]
Main page
| | | Plot |
Mito |
Lyso |
|
Perox |
ER |
Golgi |
PM |
Cytosol |
Nucleus |
|
| Expt A |
 8
8
peptides |
26
spectra |
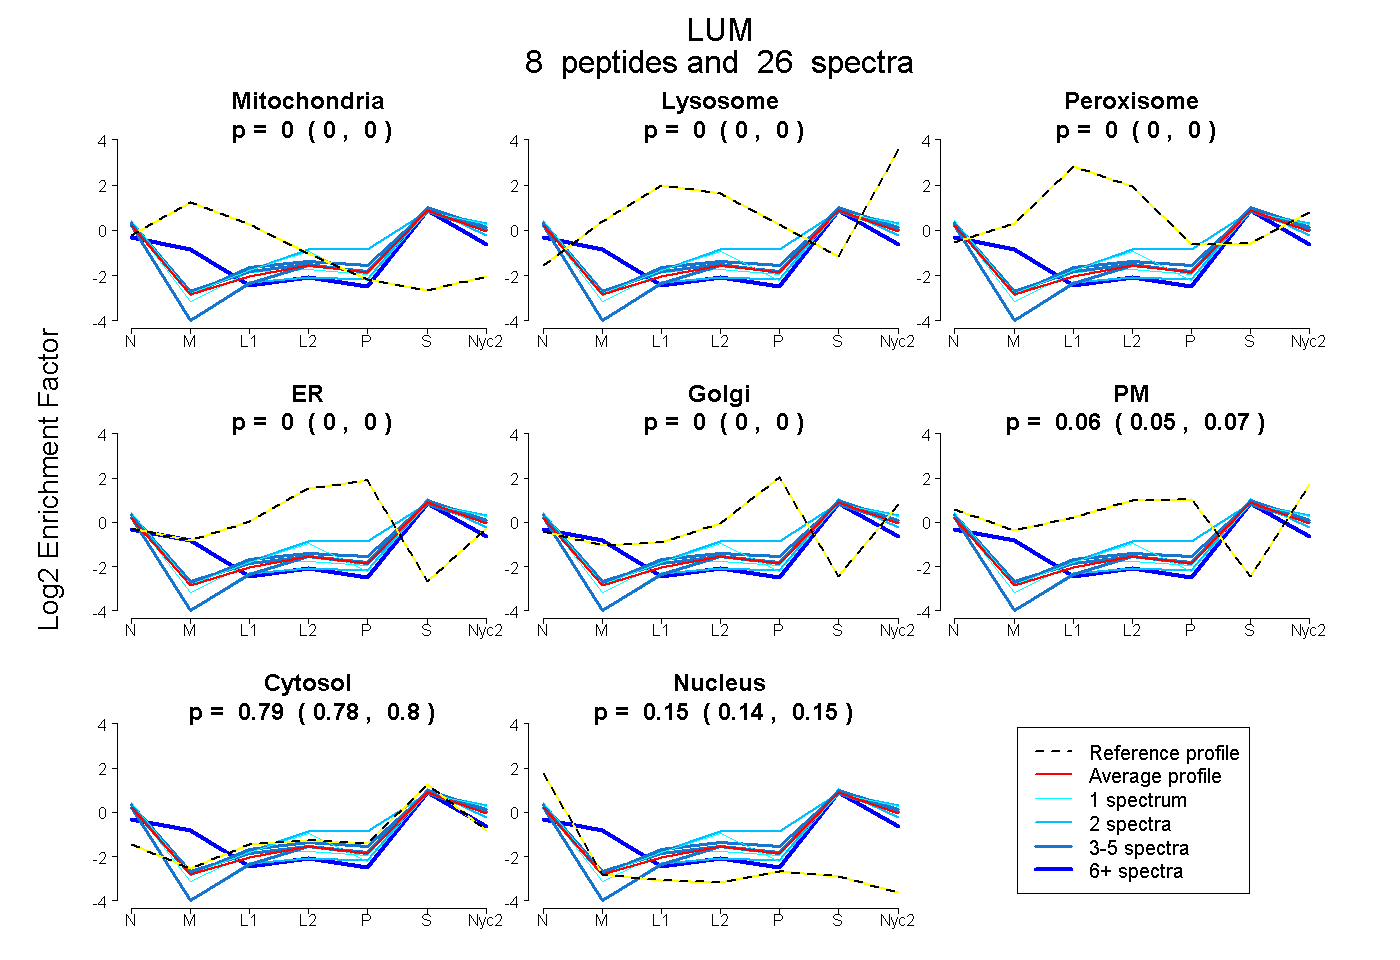 |
0.000
0.000 | 0.000 |
0.000
0.000 | 0.000 |
|
0.000
0.000 | 0.000 |
0.000
0.000 | 0.000 |
0.000
0.000 | 0.000 |
0.060
0.050 | 0.069 |
0.792
0.784 | 0.798 |
0.149
0.142 | 0.153 |
|
| | | Plot |
Mito |
|
Lyso or Perox |
|
ER |
Golgi |
PM |
Cytosol |
Nucleus |
|
| Expt B |
4
peptides |
5
spectra |
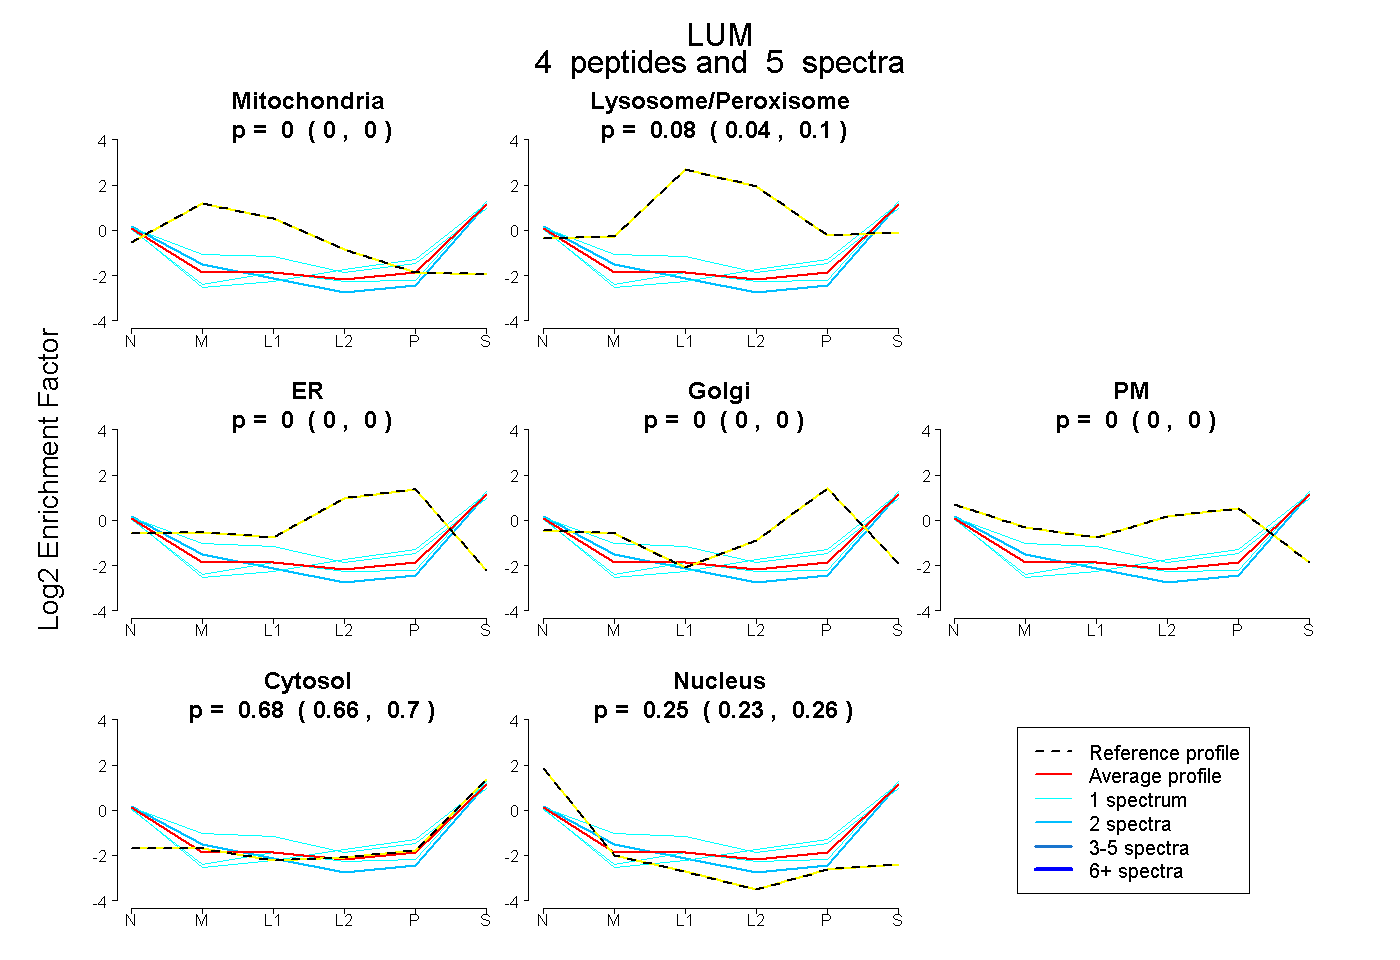 |
0.000
0.000 | 0.000 |
|
0.076
0.044 | 0.102 |
|
0.000
0.000 | 0.000 |
0.000
0.000 | 0.000 |
0.000
0.000 | 0.000 |
0.679
0.656 | 0.698 |
0.246
0.231 | 0.259 |
|
| 1 spectrum, SLQDLQLANNK |
0.000 |
|
0.212 |
|
0.000 |
0.000 |
0.000 |
0.563 |
0.225 |
|
| 2 spectra, FTGLQYLR |
0.000 |
|
0.000 |
|
0.000 |
0.000 |
0.000 |
0.700 |
0.300 |
|
| 1 spectrum, ITNIPDEYFNR |
0.000 |
|
0.036 |
|
0.000 |
0.000 |
0.000 |
0.722 |
0.242 |
|
| 1 spectrum, NNQIDHIDEK |
0.000 |
|
0.030 |
|
0.000 |
0.000 |
0.064 |
0.723 |
0.183 |
|
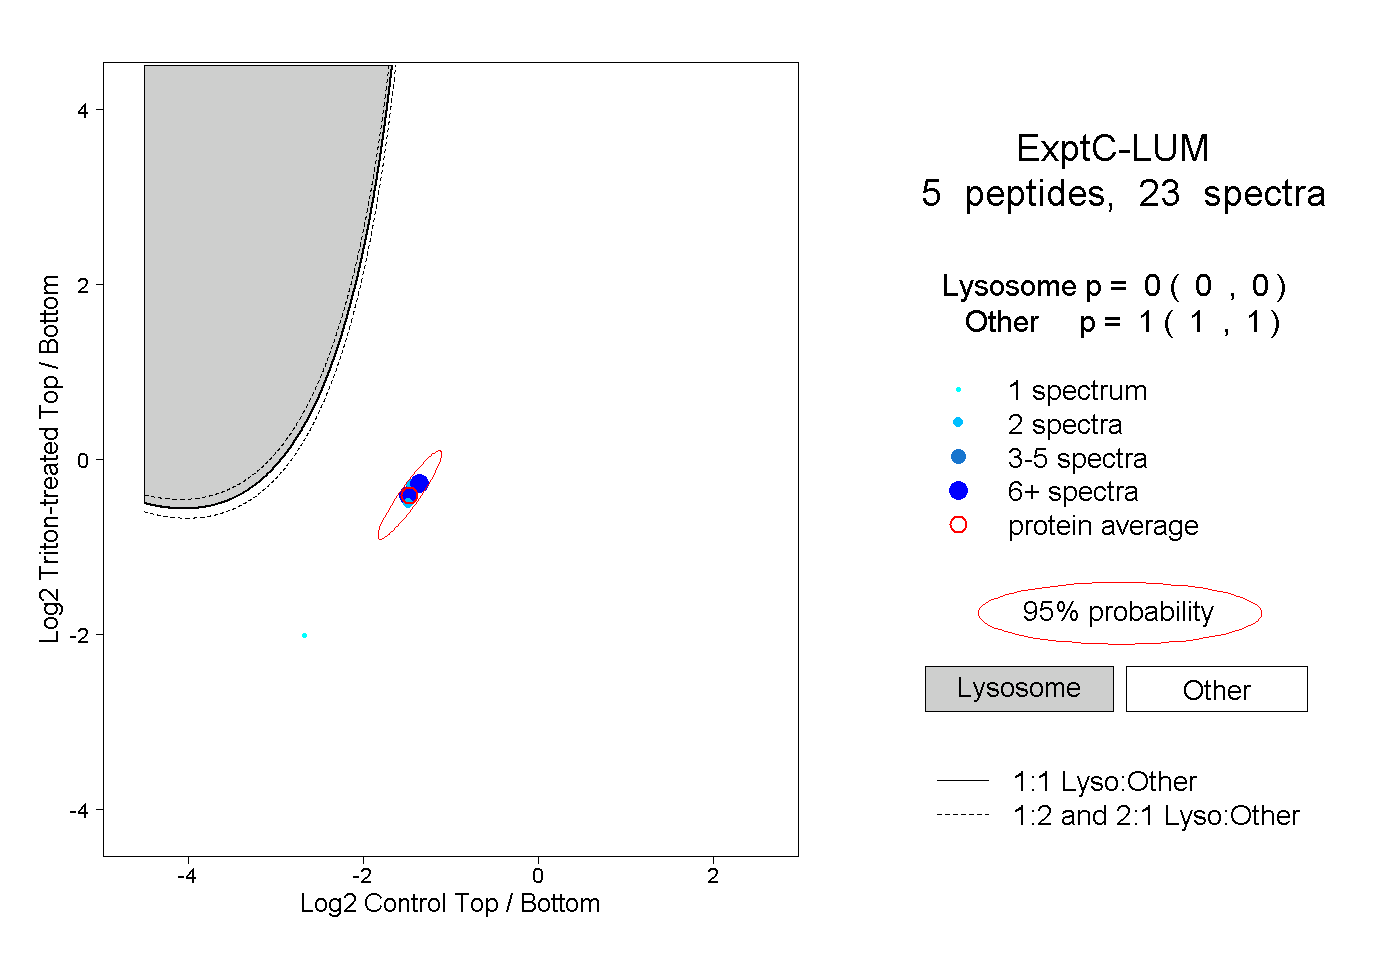
| | | Plot |
|
Lyso |
|
|
|
|
|
|
|
Other |
| Expt C |
5
peptides |
23
spectra |
 |
|
0.000
0.000 | 0.000 |
|
|
|
|
|
|
|
1.000
1.000 | 1.000 |
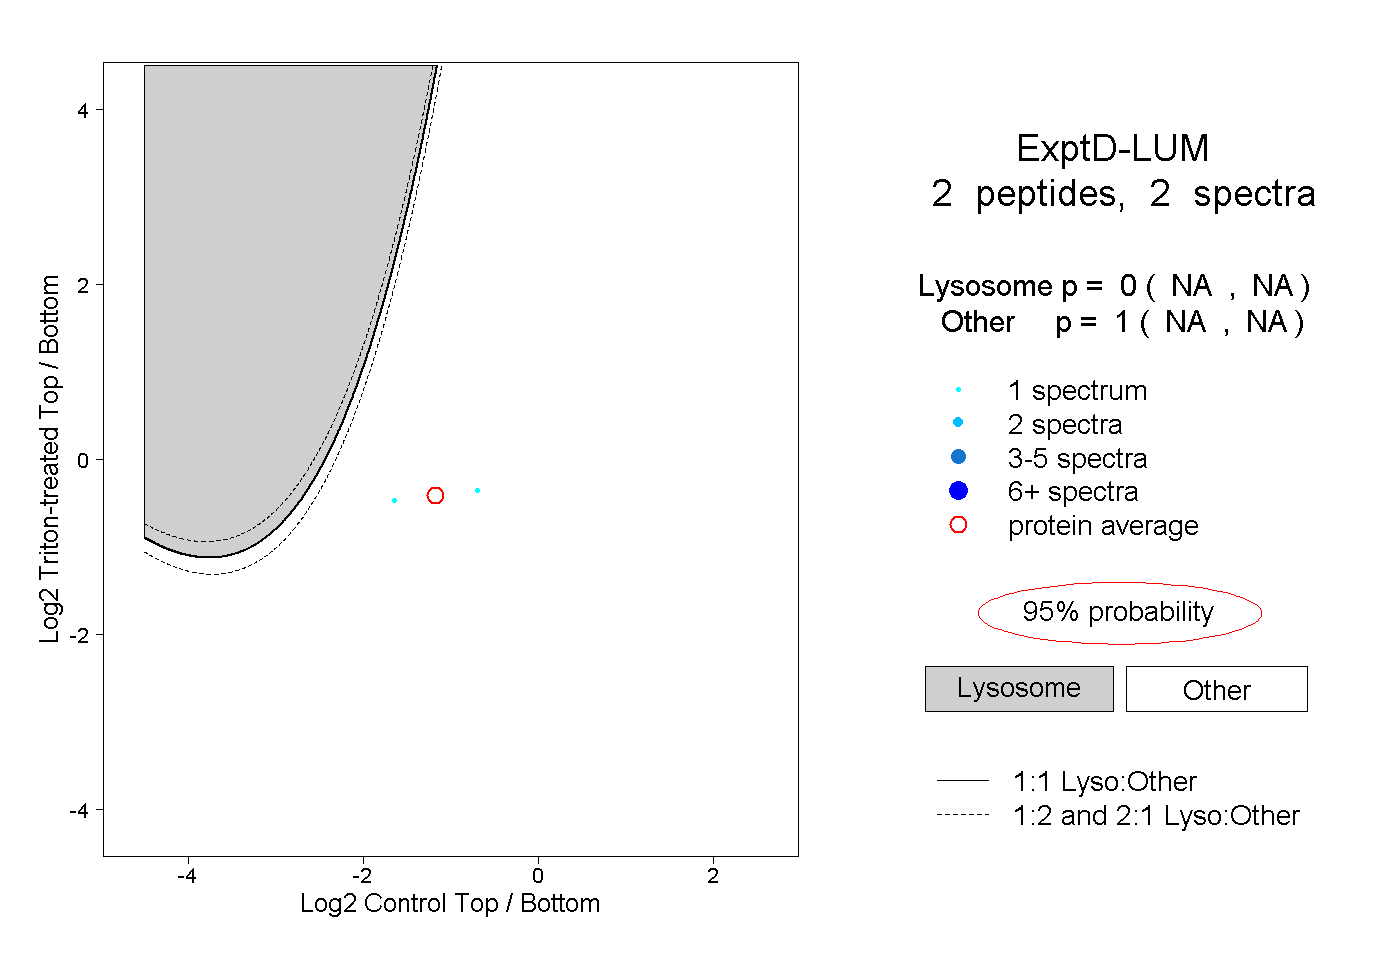
| | | Plot |
|
Lyso |
|
|
|
|
|
|
|
Other |
| Expt D |
2
peptides |
2
spectra |
 |
|
0.000
NA | NA |
|
|
|
|
|
|
|
1.000
NA | NA |