 8
8peptides
spectra
0.000 | 0.000
0.000 | 0.000
0.000 | 0.000
0.000 | 0.000
0.000 | 0.000
0.050 | 0.069
0.784 | 0.798
0.142 | 0.153
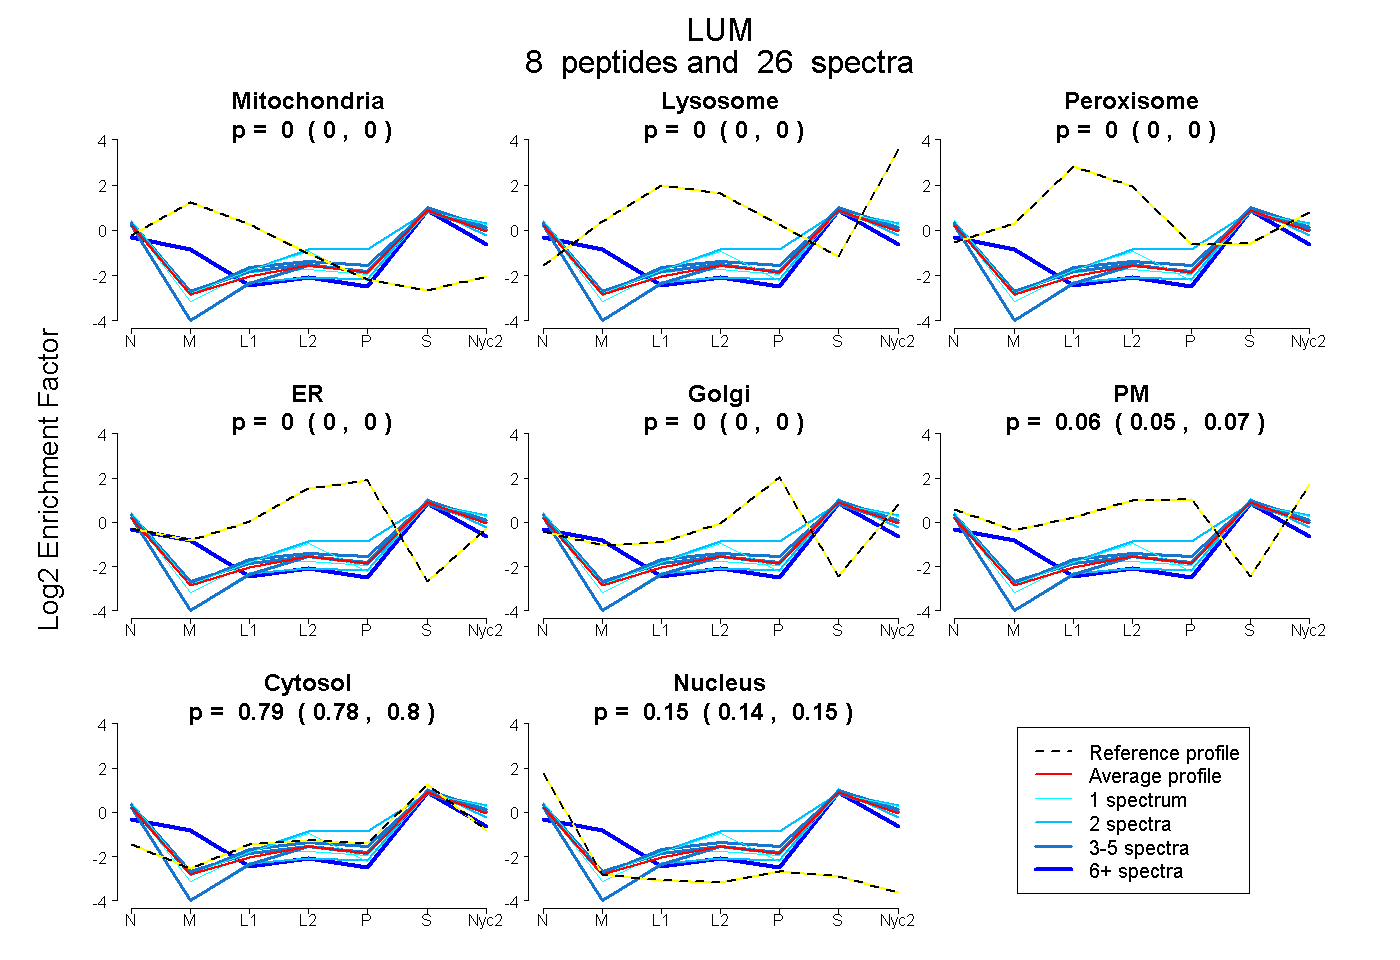
| Plot | Mito | Lyso | Perox | ER | Golgi | PM | Cytosol | Nucleus | |||||
| Expt A |
8 peptides |
26 spectra |
|
0.000 0.000 | 0.000 |
0.000 0.000 | 0.000 |
0.000 0.000 | 0.000 |
0.000 0.000 | 0.000 |
0.000 0.000 | 0.000 |
0.060 0.050 | 0.069 |
0.792 0.784 | 0.798 |
0.149 0.142 | 0.153 |
| 2 spectra, FTGLQYLR | 0.000 | 0.000 | 0.000 | 0.000 | 0.000 | 0.203 | 0.751 | 0.046 | ||
| 2 spectra, LPAGLPTSLLTLYLDNNK | 0.000 | 0.000 | 0.000 | 0.000 | 0.000 | 0.000 | 0.794 | 0.206 | ||
| 1 spectrum, SLQDLQLANNK | 0.000 | 0.025 | 0.000 | 0.000 | 0.000 | 0.093 | 0.748 | 0.134 | ||
| 4 spectra, SLEYLDLSFNQMSK | 0.000 | 0.000 | 0.000 | 0.000 | 0.000 | 0.111 | 0.778 | 0.111 | ||
| 1 spectrum, ILGPLSYSK | 0.000 | 0.000 | 0.000 | 0.000 | 0.000 | 0.037 | 0.802 | 0.161 | ||
| 4 spectra, ITNIPDEYFNR | 0.000 | 0.000 | 0.000 | 0.000 | 0.000 | 0.093 | 0.757 | 0.151 | ||
| 9 spectra, EEAVSASLK | 0.152 | 0.000 | 0.000 | 0.000 | 0.000 | 0.000 | 0.720 | 0.128 | ||
| 3 spectra, NNQIDHIDEK | 0.000 | 0.000 | 0.000 | 0.000 | 0.000 | 0.000 | 0.848 | 0.152 |
| Plot | Mito | Lyso or Perox | ER | Golgi | PM | Cytosol | Nucleus | ||||||
| Expt B |
4 peptides |
5 spectra |
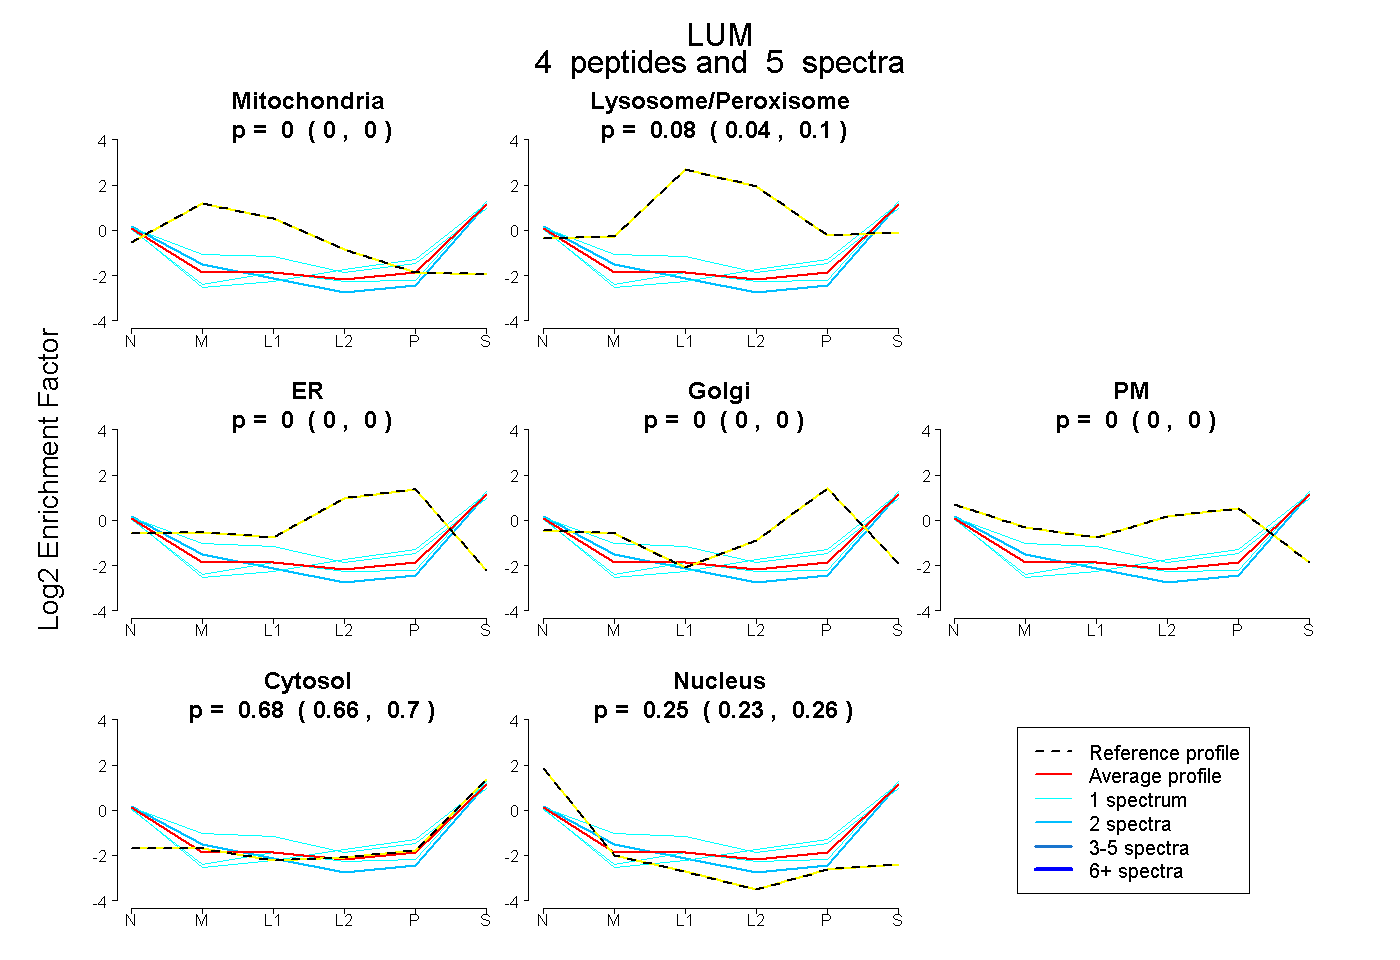 |
0.000 0.000 | 0.000 |
0.076 0.044 | 0.102 |
0.000 0.000 | 0.000 |
0.000 0.000 | 0.000 |
0.000 0.000 | 0.000 |
0.679 0.656 | 0.698 |
0.246 0.231 | 0.259 |
|||
| Plot | Lyso | Other | |||||||||||
| Expt C |
5 peptides |
23 spectra |
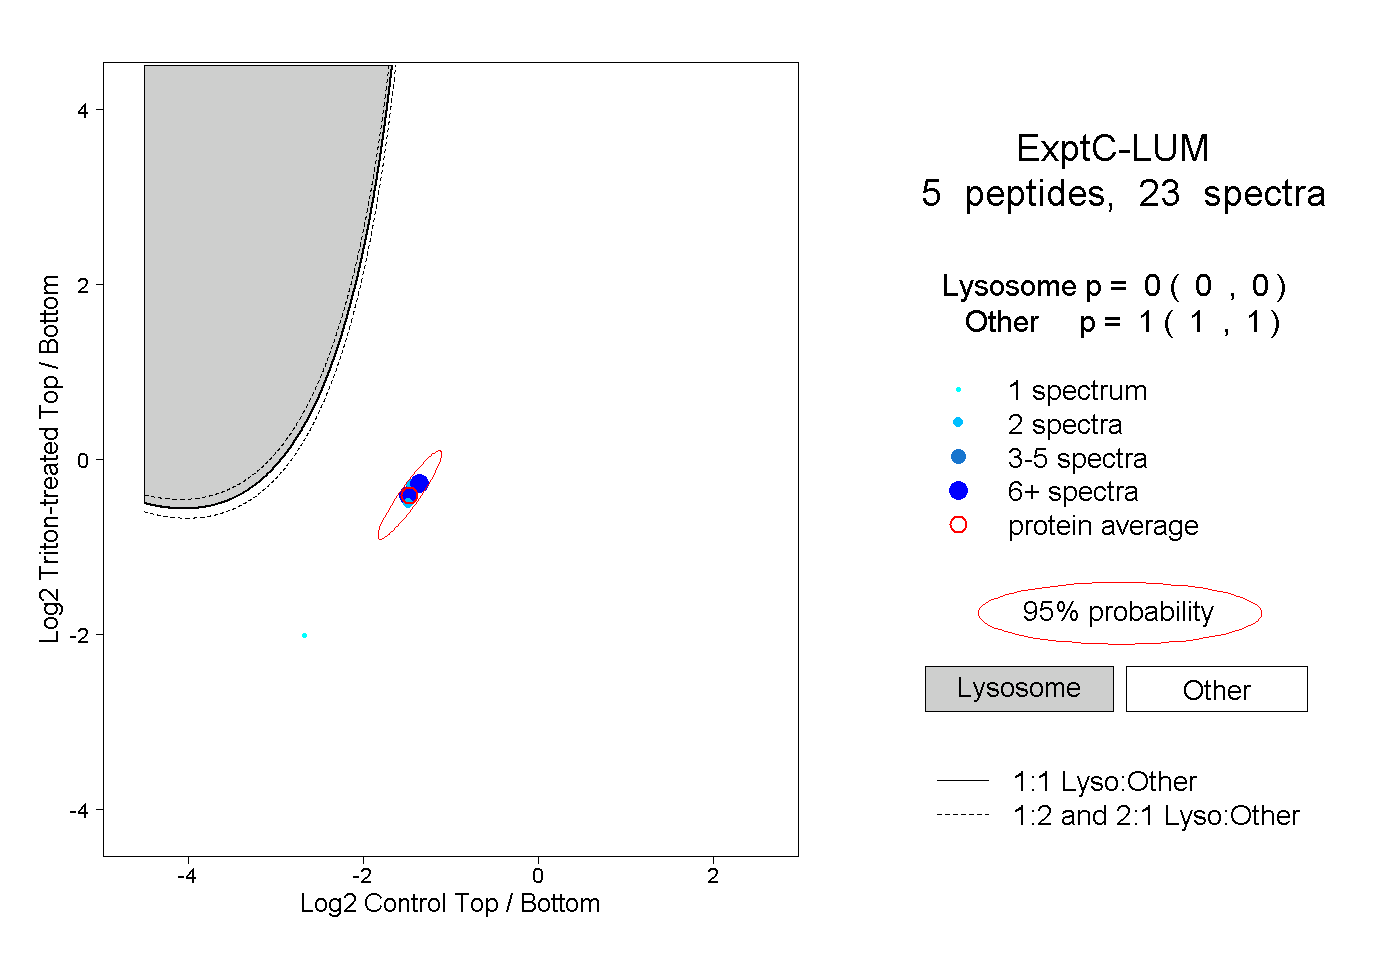 |
0.000 0.000 | 0.000 |
1.000 1.000 | 1.000 |
||||||||
| Plot | Lyso | Other | |||||||||||
| Expt D |
2 peptides |
2 spectra |
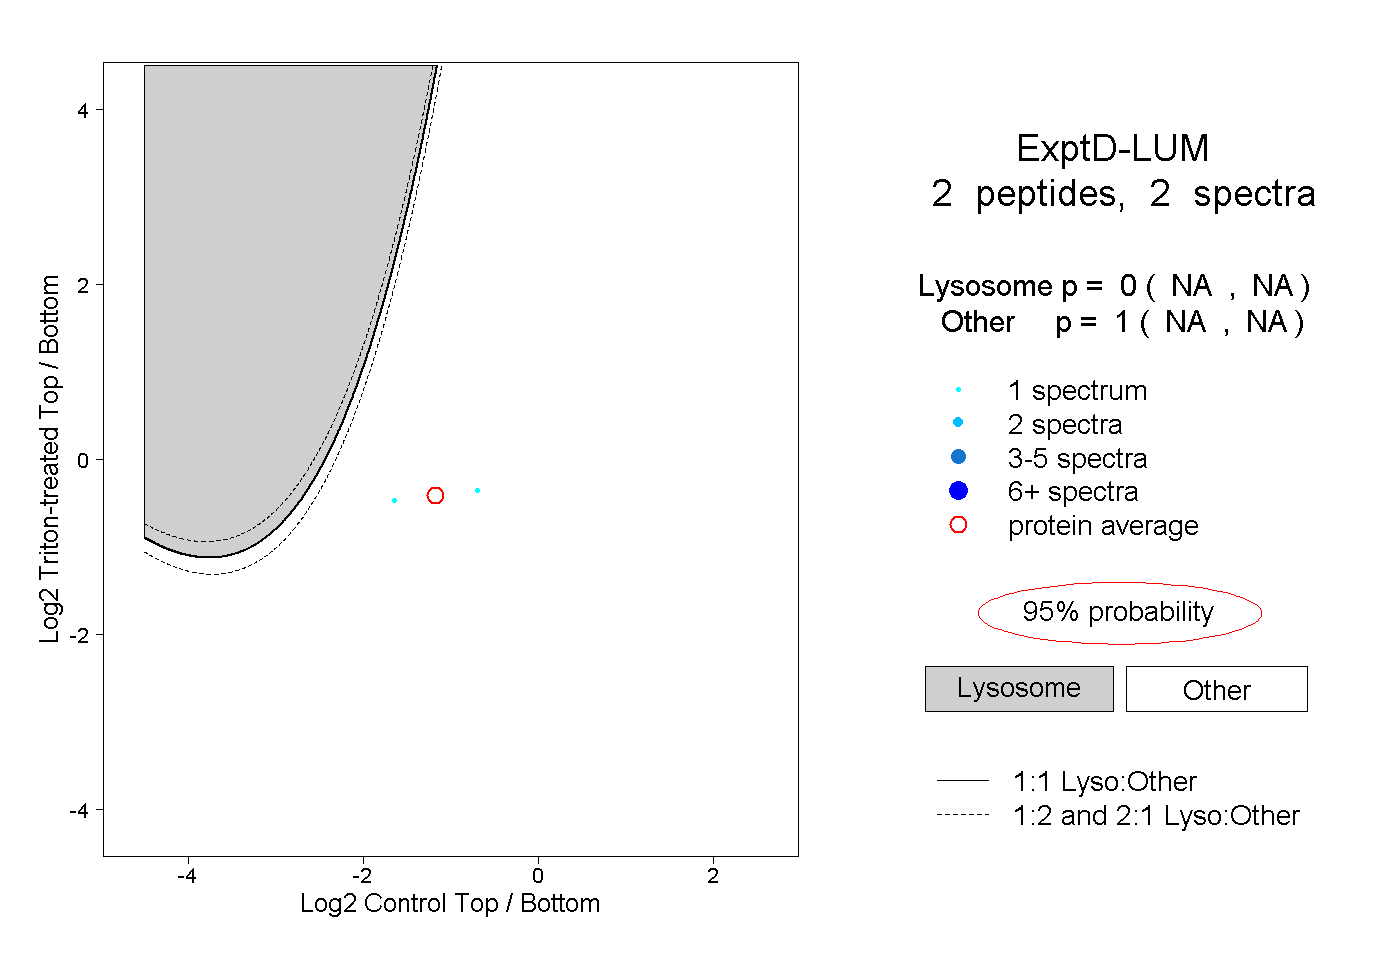 |
0.000 NA | NA |
1.000 NA | NA |