 18
18peptides
spectra
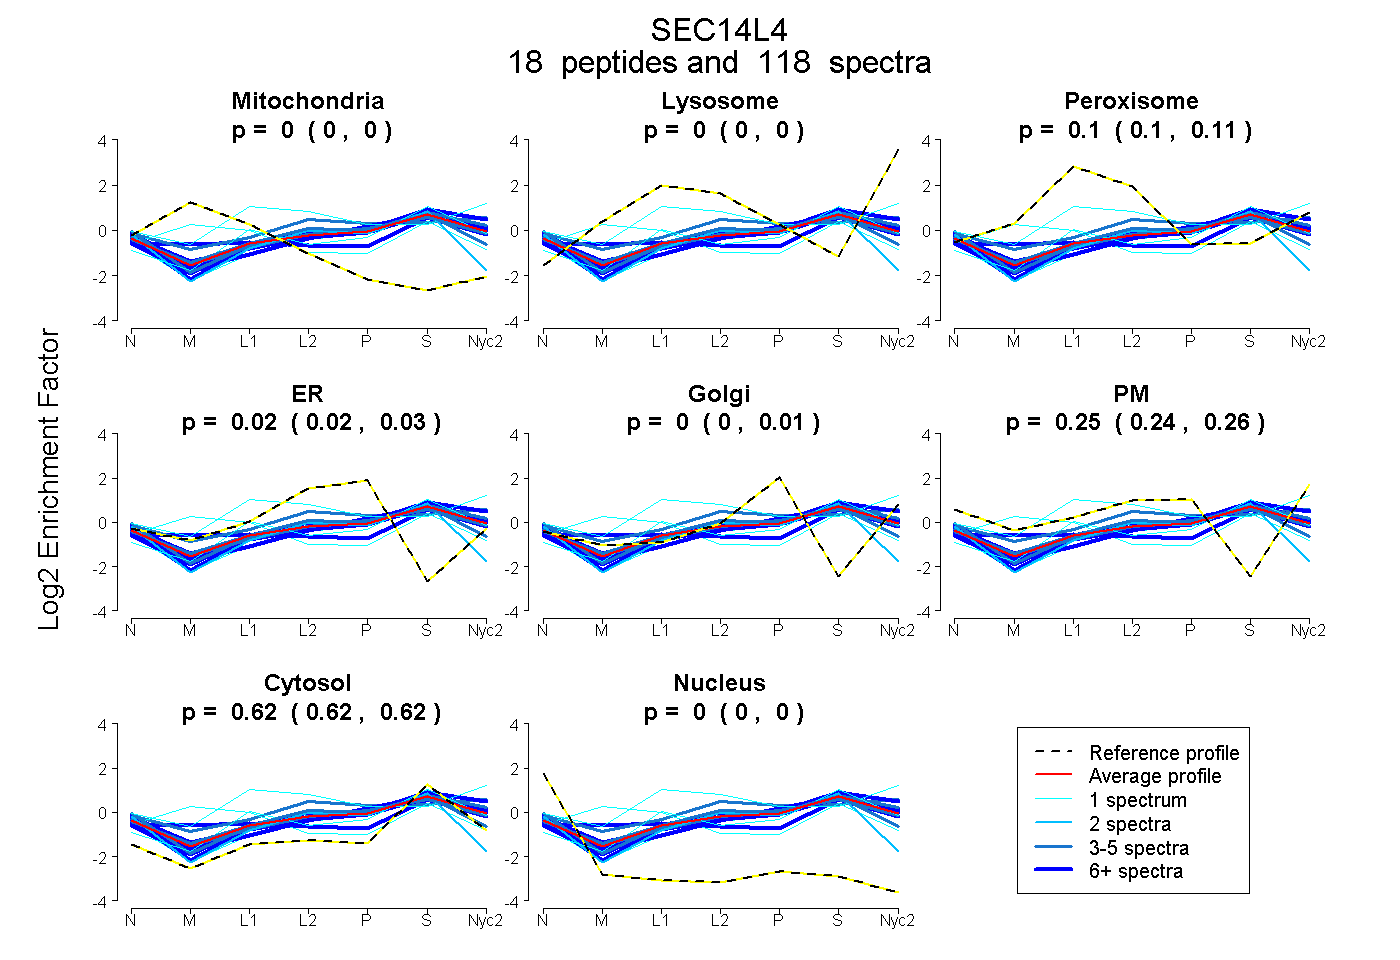
0.000 | 0.000
0.000 | 0.000
0.099 | 0.106
0.015 | 0.031
0.000 | 0.006
0.244 | 0.260
0.616 | 0.621
0.000 | 0.000
12peptides
spectra
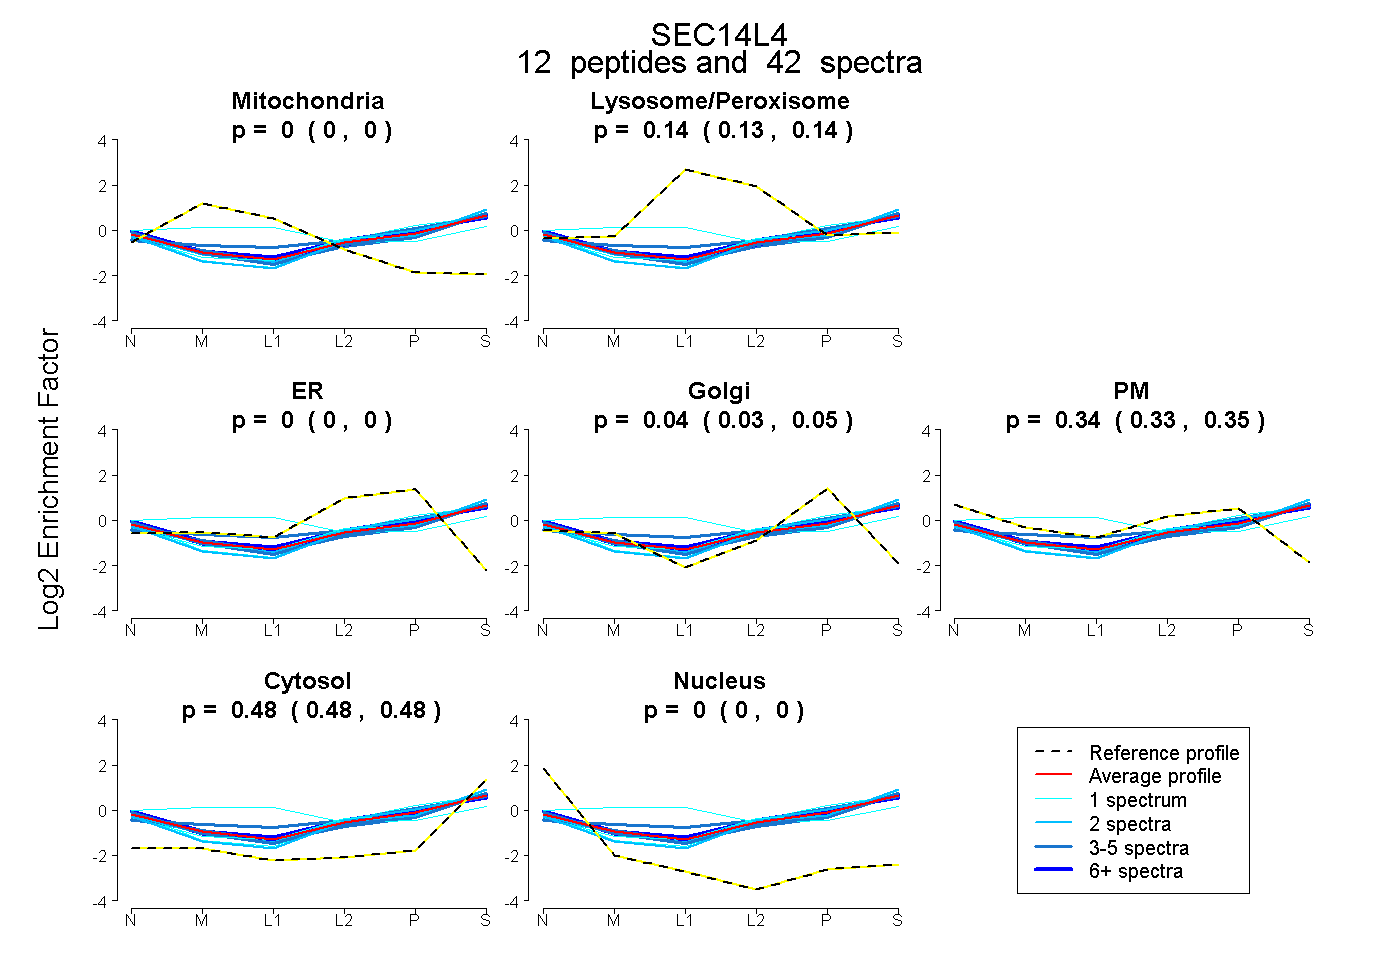
0.000 | 0.000
0.130 | 0.141
0.000 | 0.000
0.027 | 0.047
0.331 | 0.354
0.479 | 0.485
0.000 | 0.000
17peptides
spectra
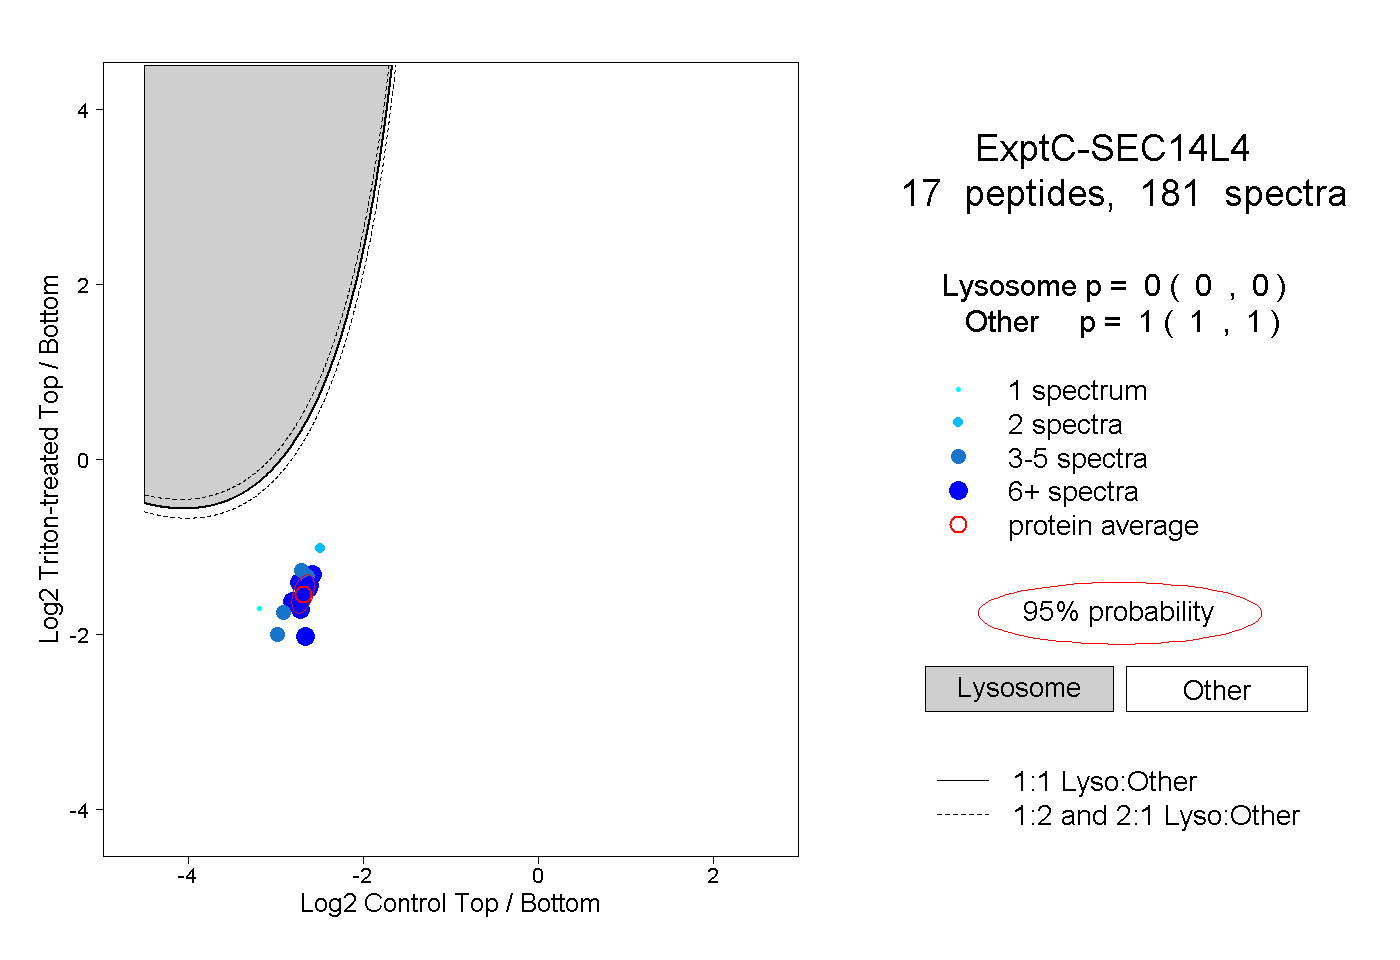
0.000 | 0.000
1.000 | 1.000
6peptides
spectra
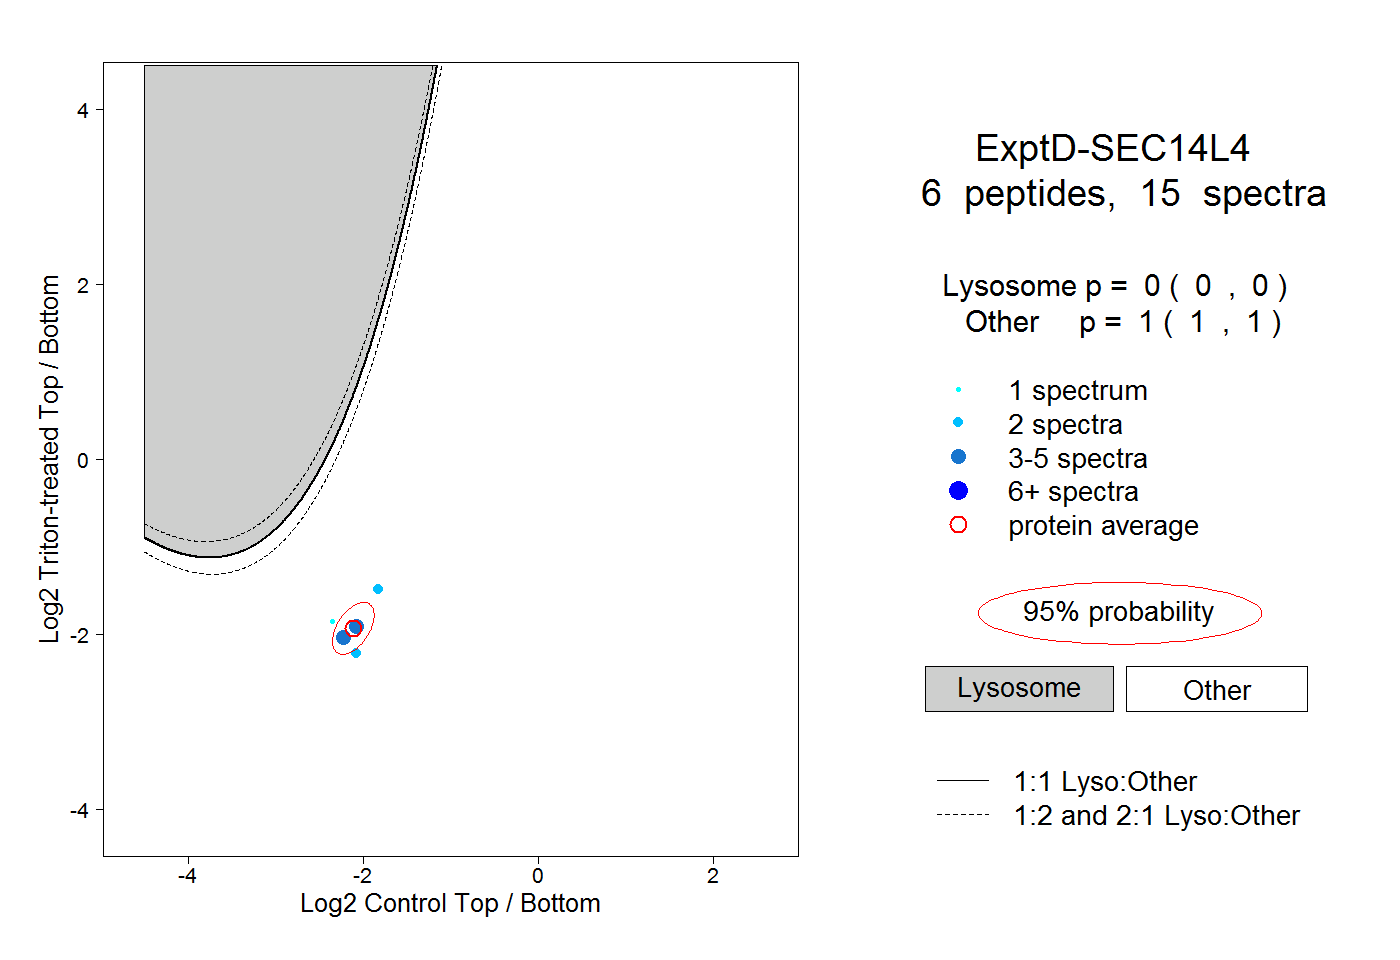
0.000 | 0.000
1.000 | 1.000