 10
10peptides
spectra
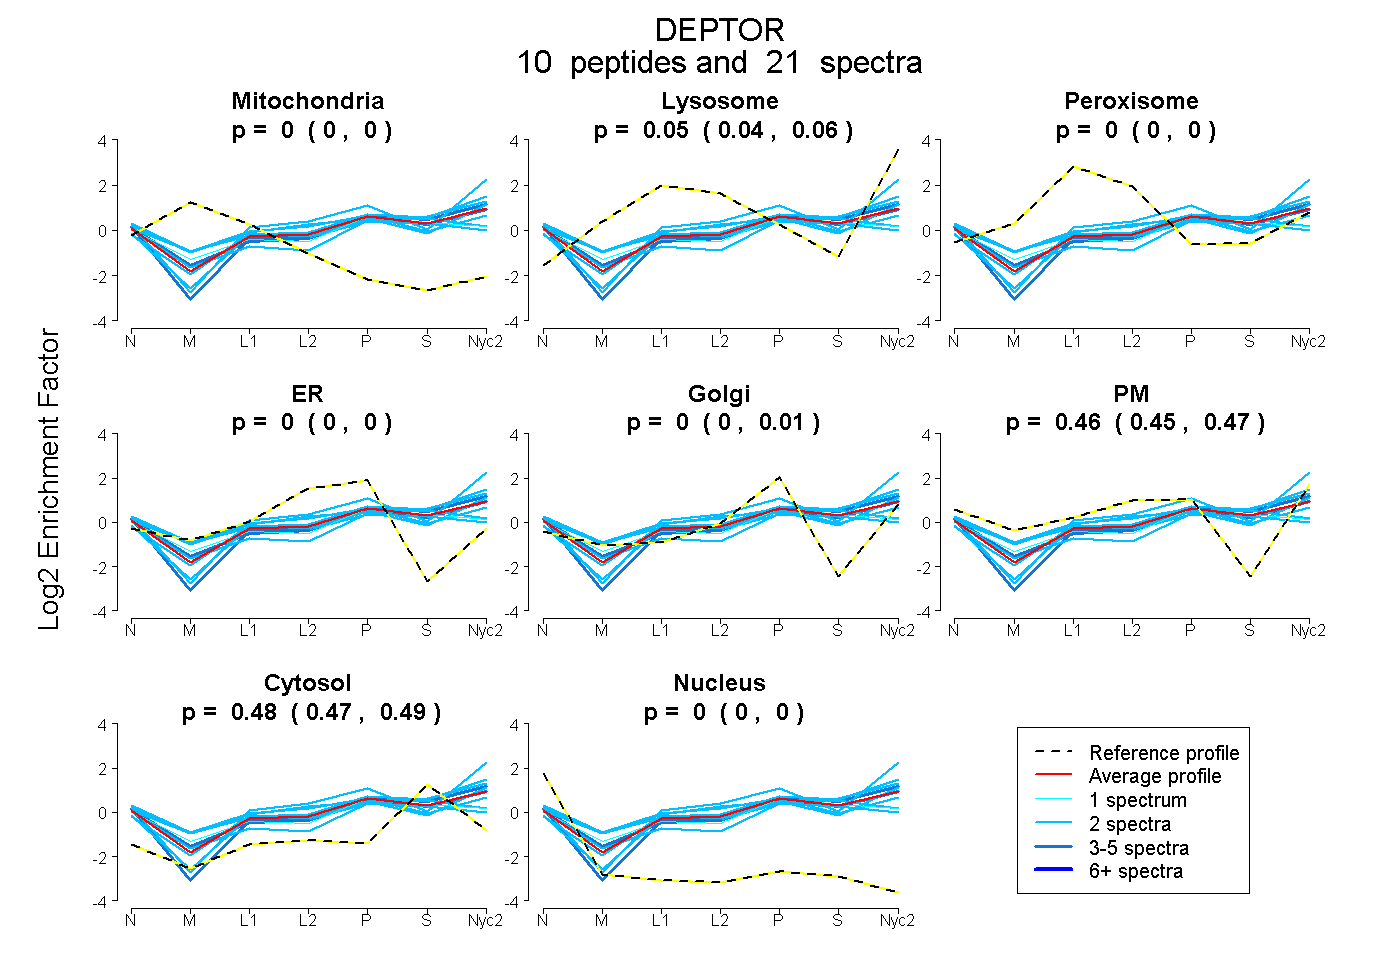
0.000 | 0.000
0.037 | 0.064
0.000 | 0.000
0.000 | 0.000
0.000 | 0.010
0.449 | 0.473
0.474 | 0.491
0.000 | 0.000
4peptides
spectra
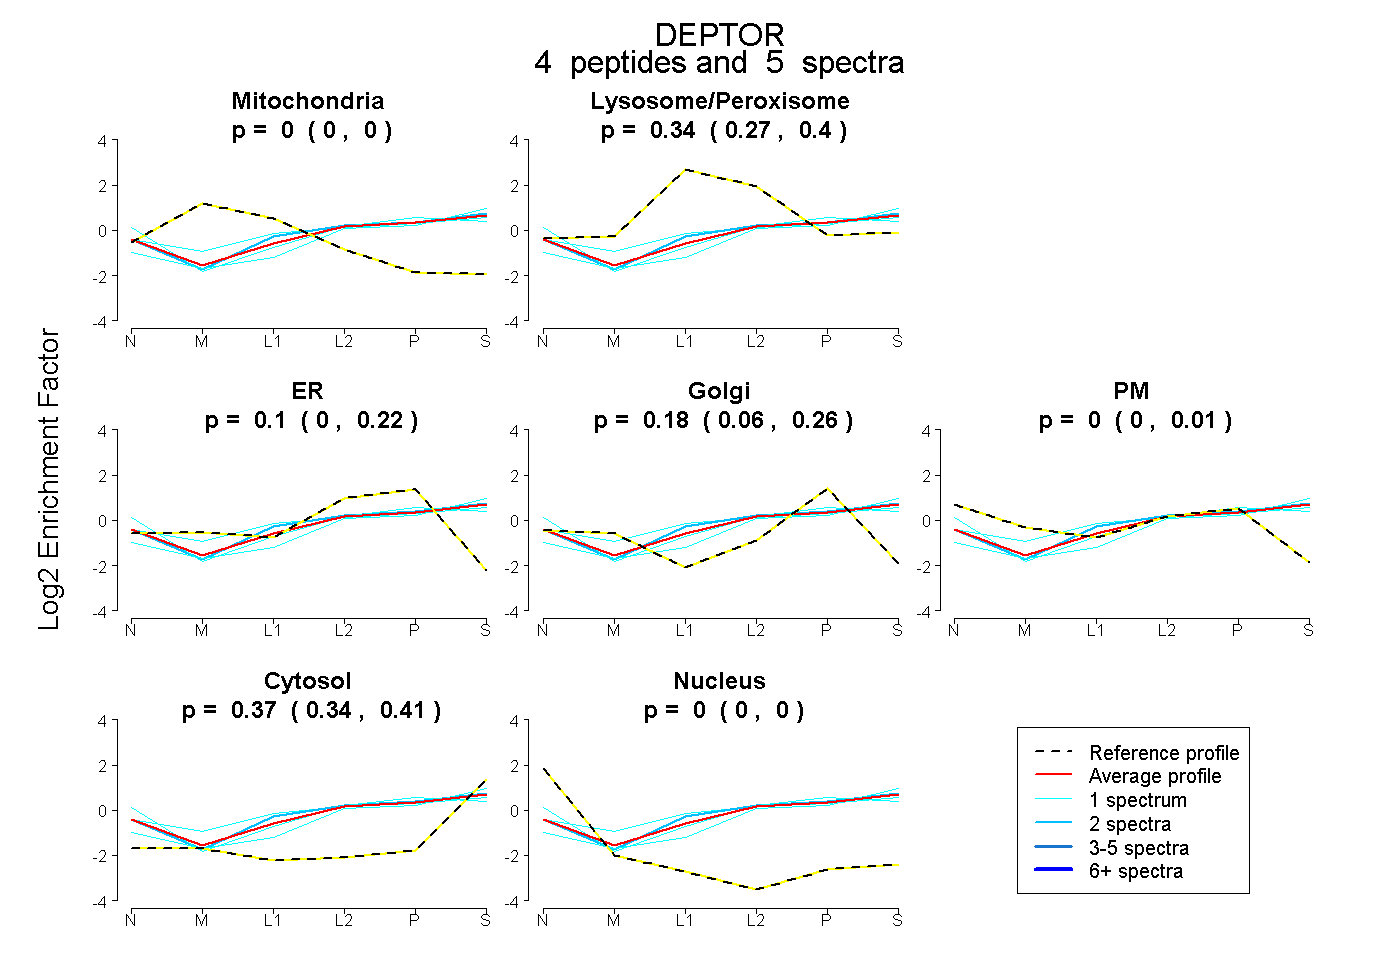
0.000 | 0.000
0.273 | 0.398
0.000 | 0.217
0.060 | 0.263
0.000 | 0.006
0.335 | 0.414
0.000 | 0.000
10peptides
spectra
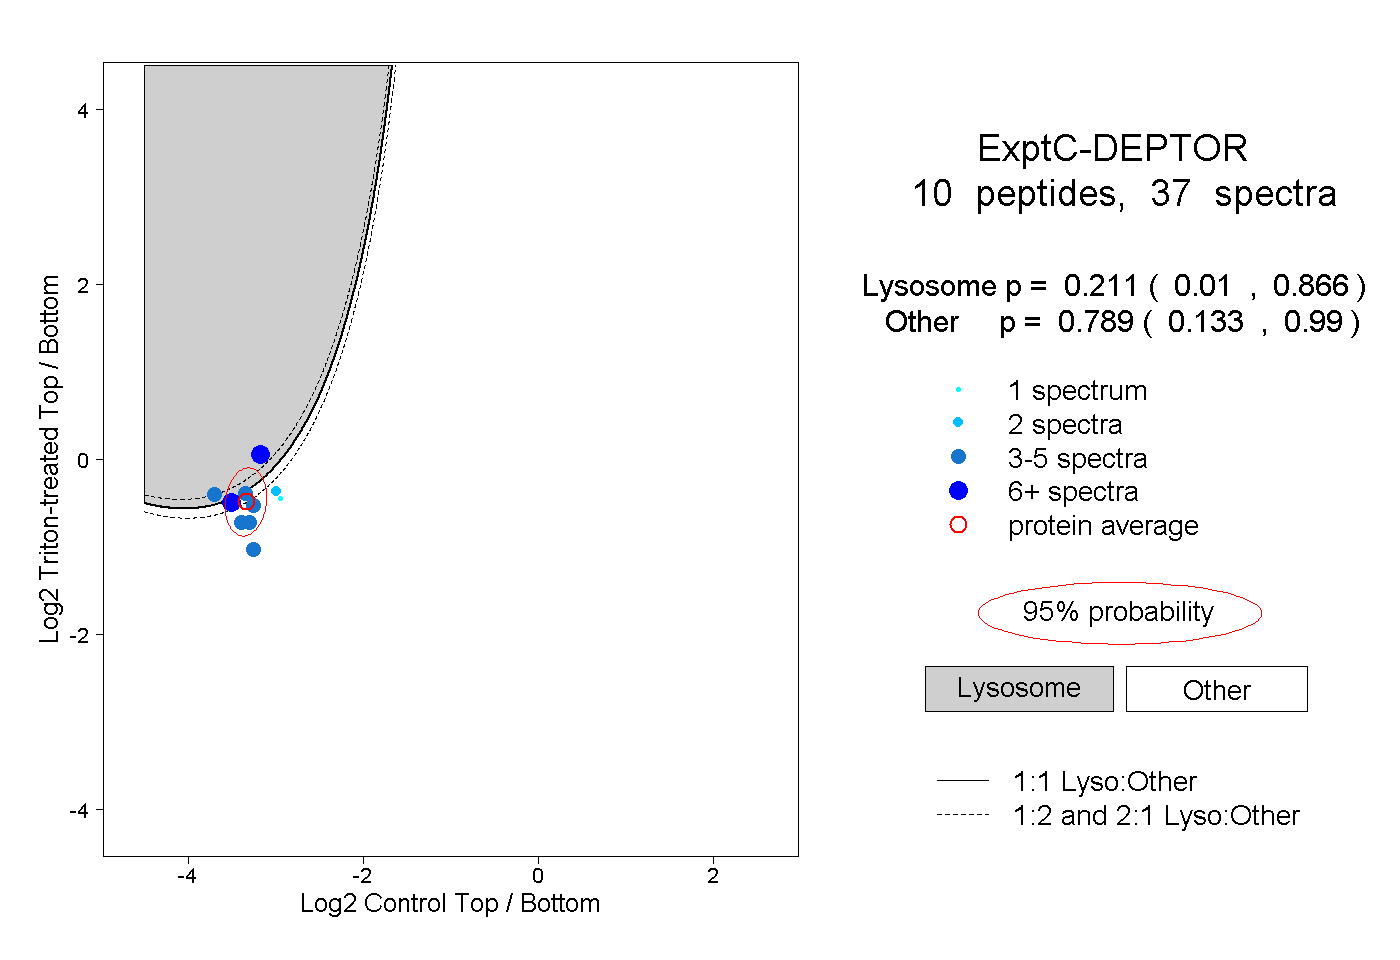
0.010 | 0.866
0.133 | 0.990
2peptides
spectra
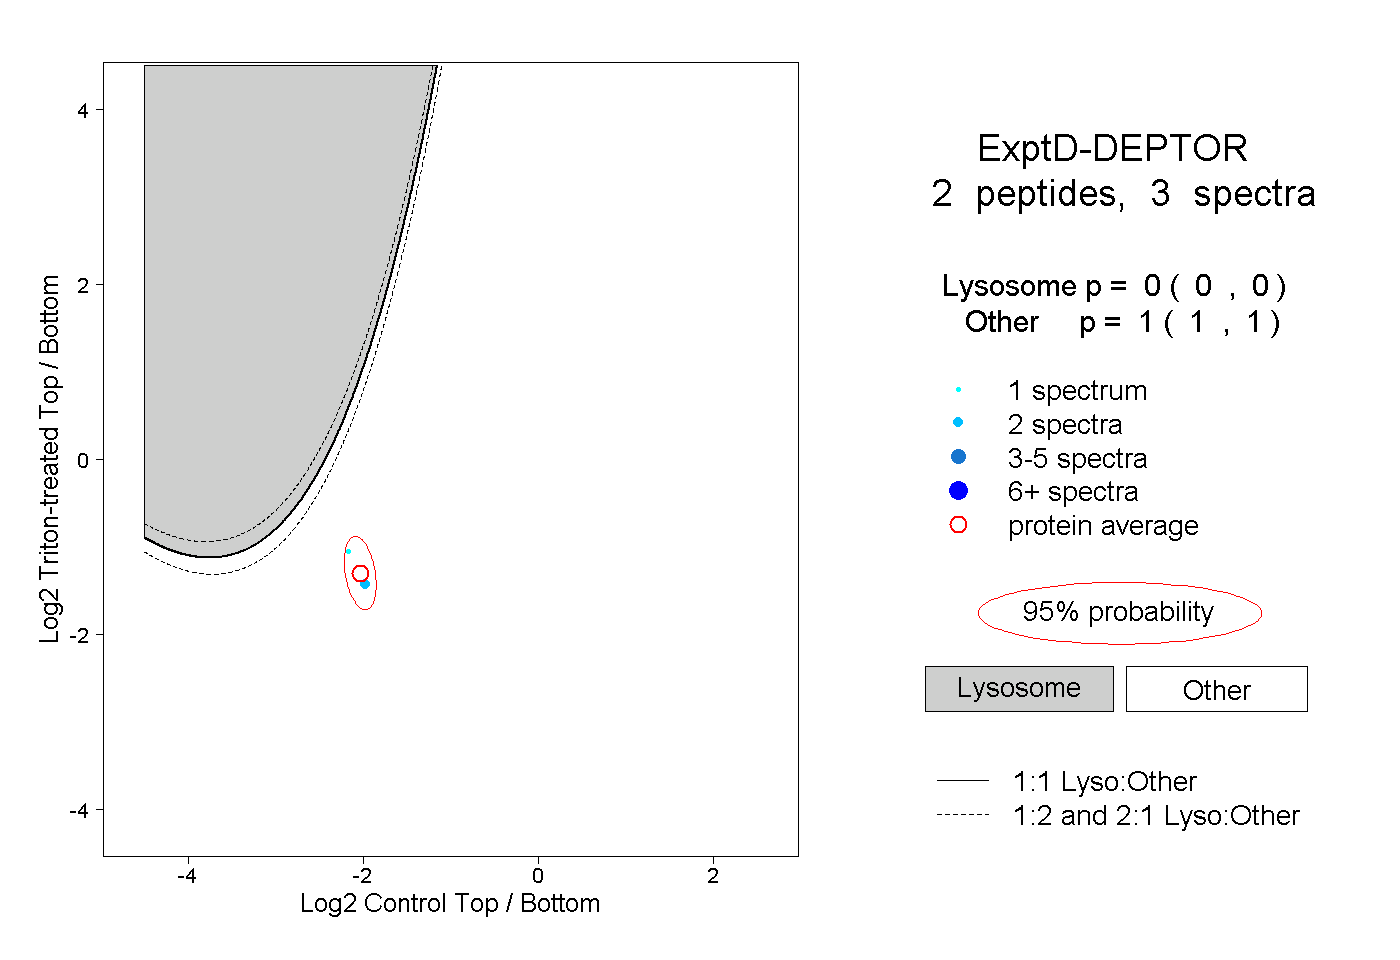
0.000 | 0.000
1.000 | 1.000