DEPTOR
[ENSRNOP00000005722]
Main page
| | | Plot |
Mito |
Lyso |
|
Perox |
ER |
Golgi |
PM |
Cytosol |
Nucleus |
|
| Expt A |
 10
10
peptides |
21
spectra |
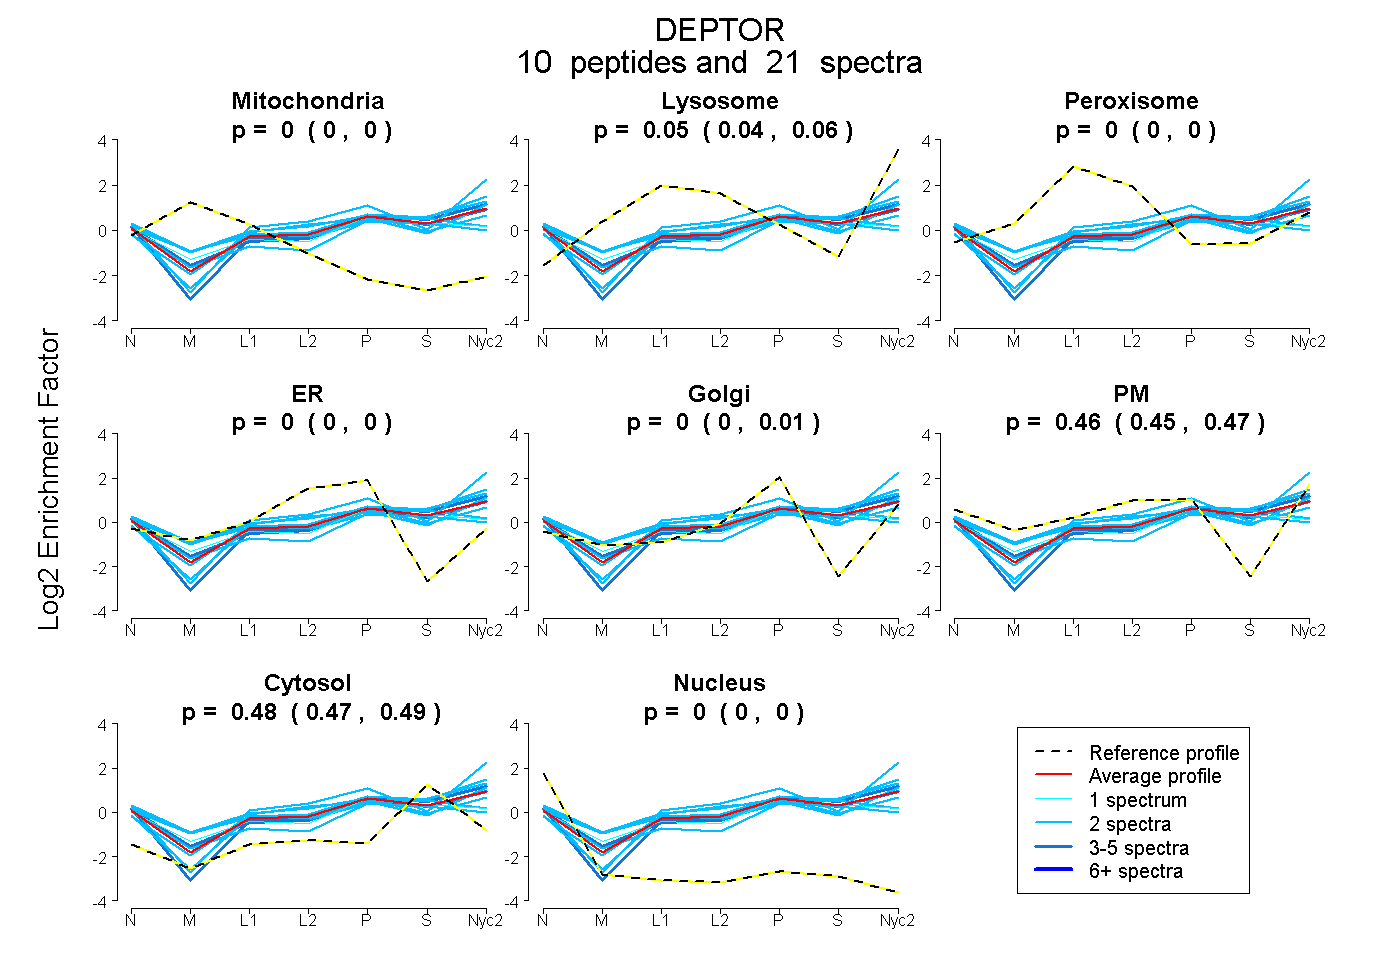 |
0.000
0.000 | 0.000 |
0.052
0.037 | 0.064 |
|
0.000
0.000 | 0.000 |
0.000
0.000 | 0.000 |
0.000
0.000 | 0.010 |
0.465
0.449 | 0.473 |
0.484
0.474 | 0.491 |
0.000
0.000 | 0.000 |
|
| | | Plot |
Mito |
|
Lyso or Perox |
|
ER |
Golgi |
PM |
Cytosol |
Nucleus |
|
| Expt B |
4
peptides |
5
spectra |
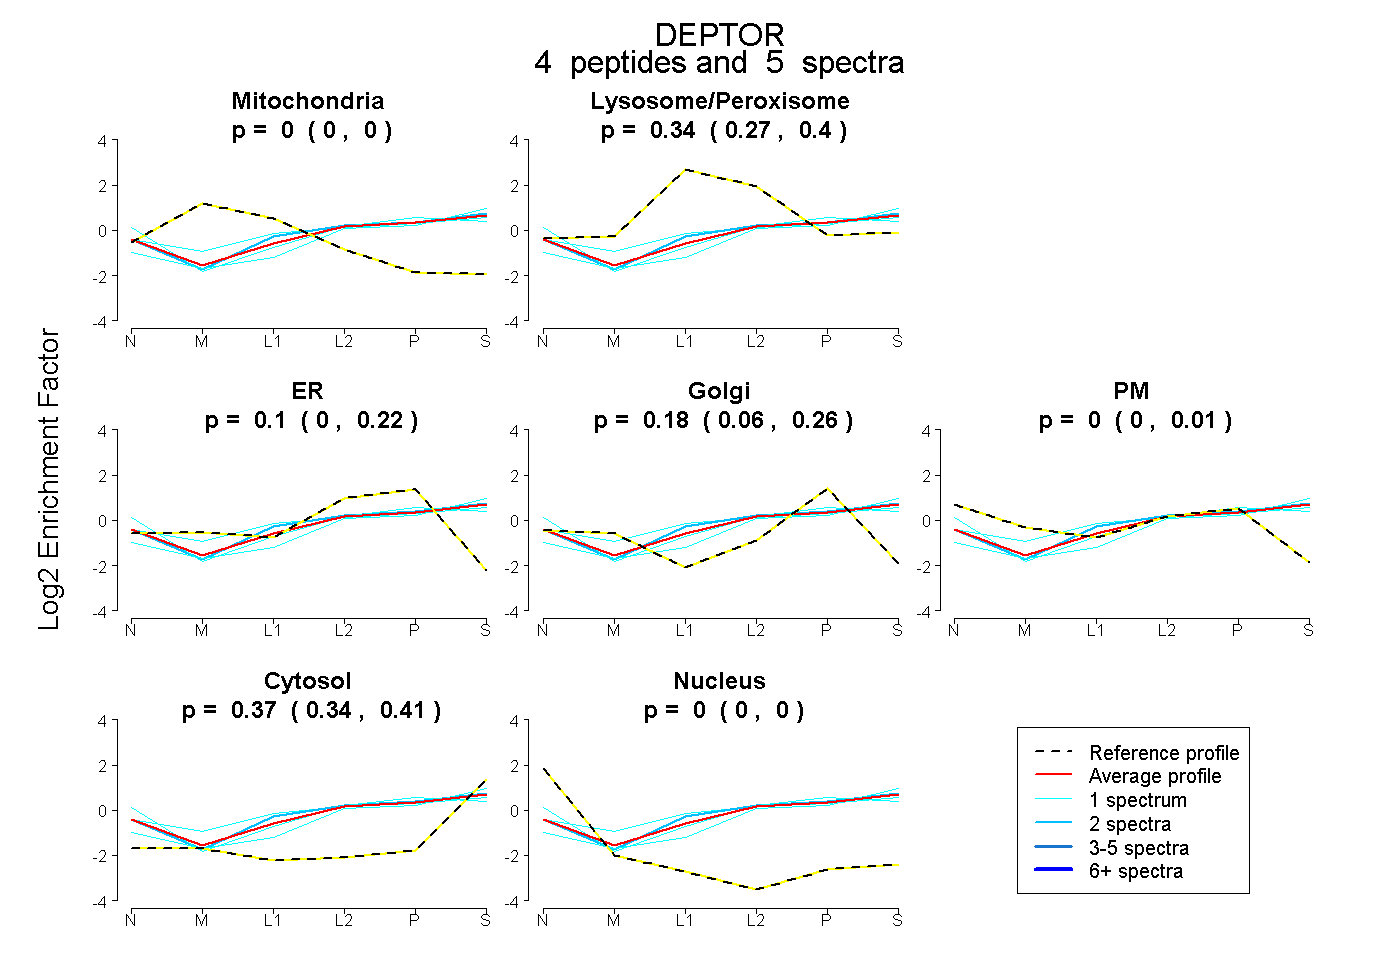 |
0.000
0.000 | 0.000 |
|
0.344
0.273 | 0.398 |
|
0.096
0.000 | 0.217 |
0.185
0.060 | 0.263 |
0.000
0.000 | 0.006 |
0.375
0.335 | 0.414 |
0.000
0.000 | 0.000 |
|
| 1 spectrum, LMELLNEK |
0.000 |
|
0.184 |
|
0.285 |
0.000 |
0.000 |
0.531 |
0.000 |
|
| 1 spectrum, IVSAVR |
0.000 |
|
0.266 |
|
0.062 |
0.157 |
0.198 |
0.317 |
0.000 |
|
| 2 spectra, ELIDWLIEHK |
0.000 |
|
0.408 |
|
0.049 |
0.178 |
0.000 |
0.365 |
0.000 |
|
| 1 spectrum, DDGTFPLDNEVK |
0.000 |
|
0.445 |
|
0.000 |
0.254 |
0.000 |
0.301 |
0.000 |
|
| | | Plot |
|
Lyso |
|
|
|
|
|
|
|
Other |
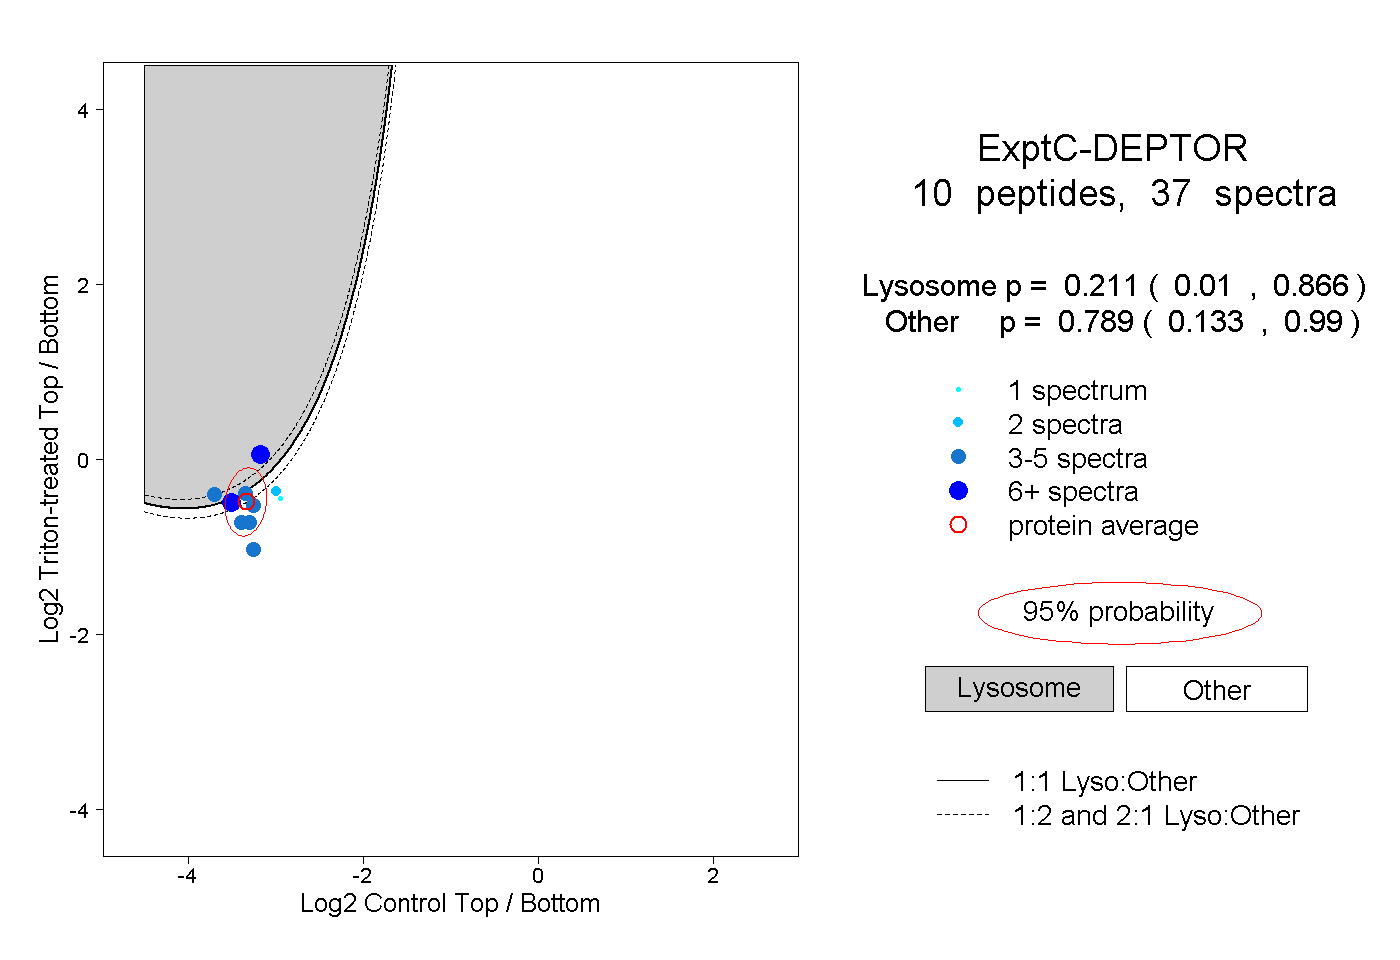
| Expt C |
10
peptides |
37
spectra |
 |
|
0.211
0.010 | 0.866 |
|
|
|
|
|
|
|
0.789
0.133 | 0.990 |
| | | Plot |
|
Lyso |
|
|
|
|
|
|
|
Other |
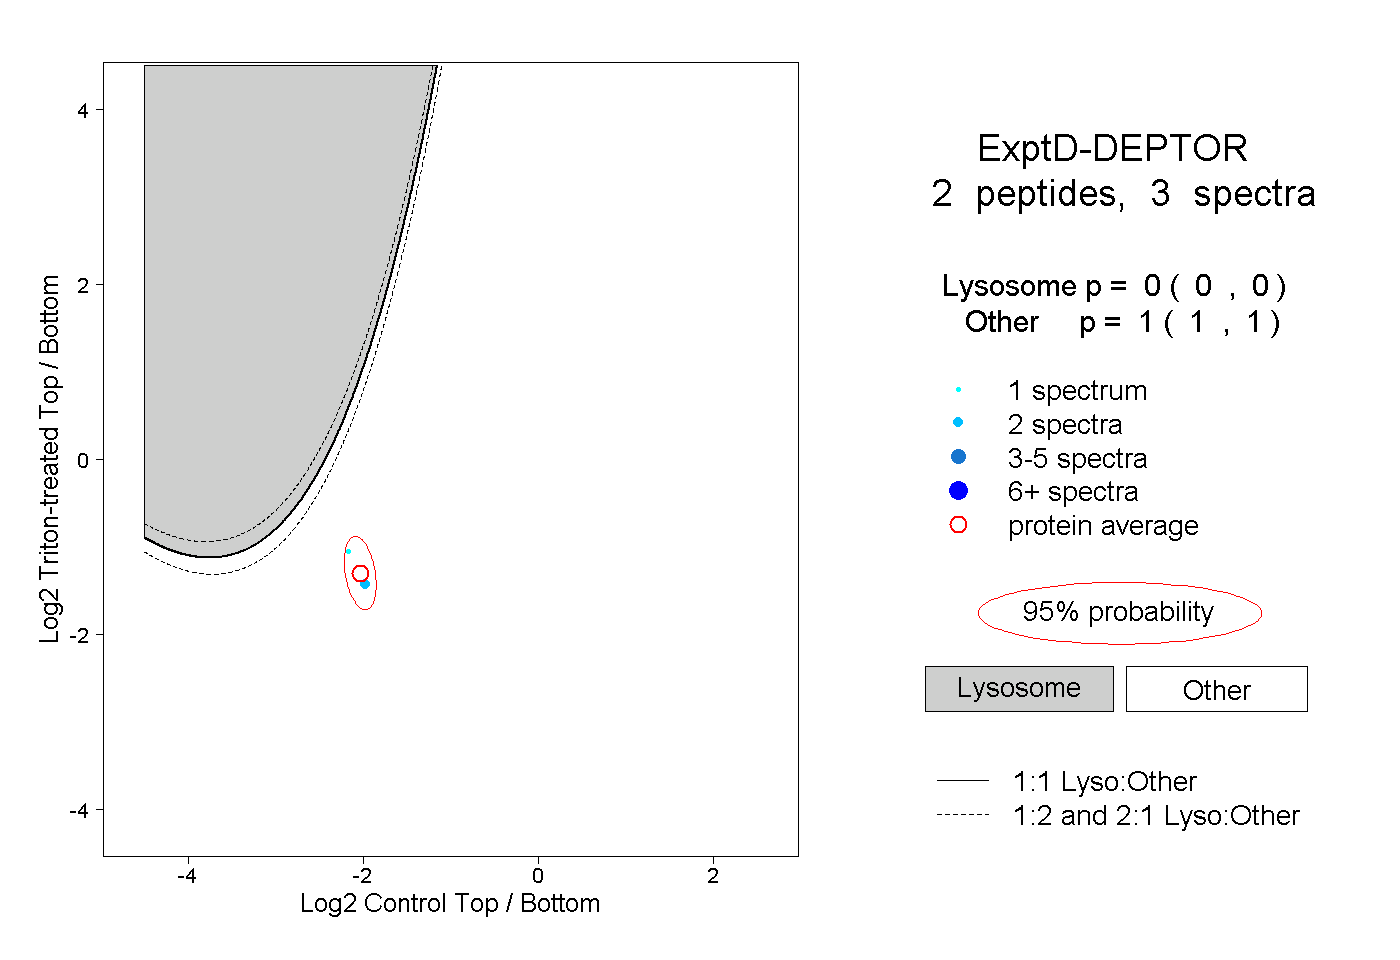
| Expt D |
2
peptides |
3
spectra |
 |
|
0.000
0.000 | 0.000 |
|
|
|
|
|
|
|
1.000
1.000 | 1.000 |