 10
10peptides
spectra
0.000 | 0.000
0.037 | 0.064
0.000 | 0.000
0.000 | 0.000
0.000 | 0.010
0.449 | 0.473
0.474 | 0.491
0.000 | 0.000
| Plot | Mito | Lyso | Perox | ER | Golgi | PM | Cytosol | Nucleus | |||||
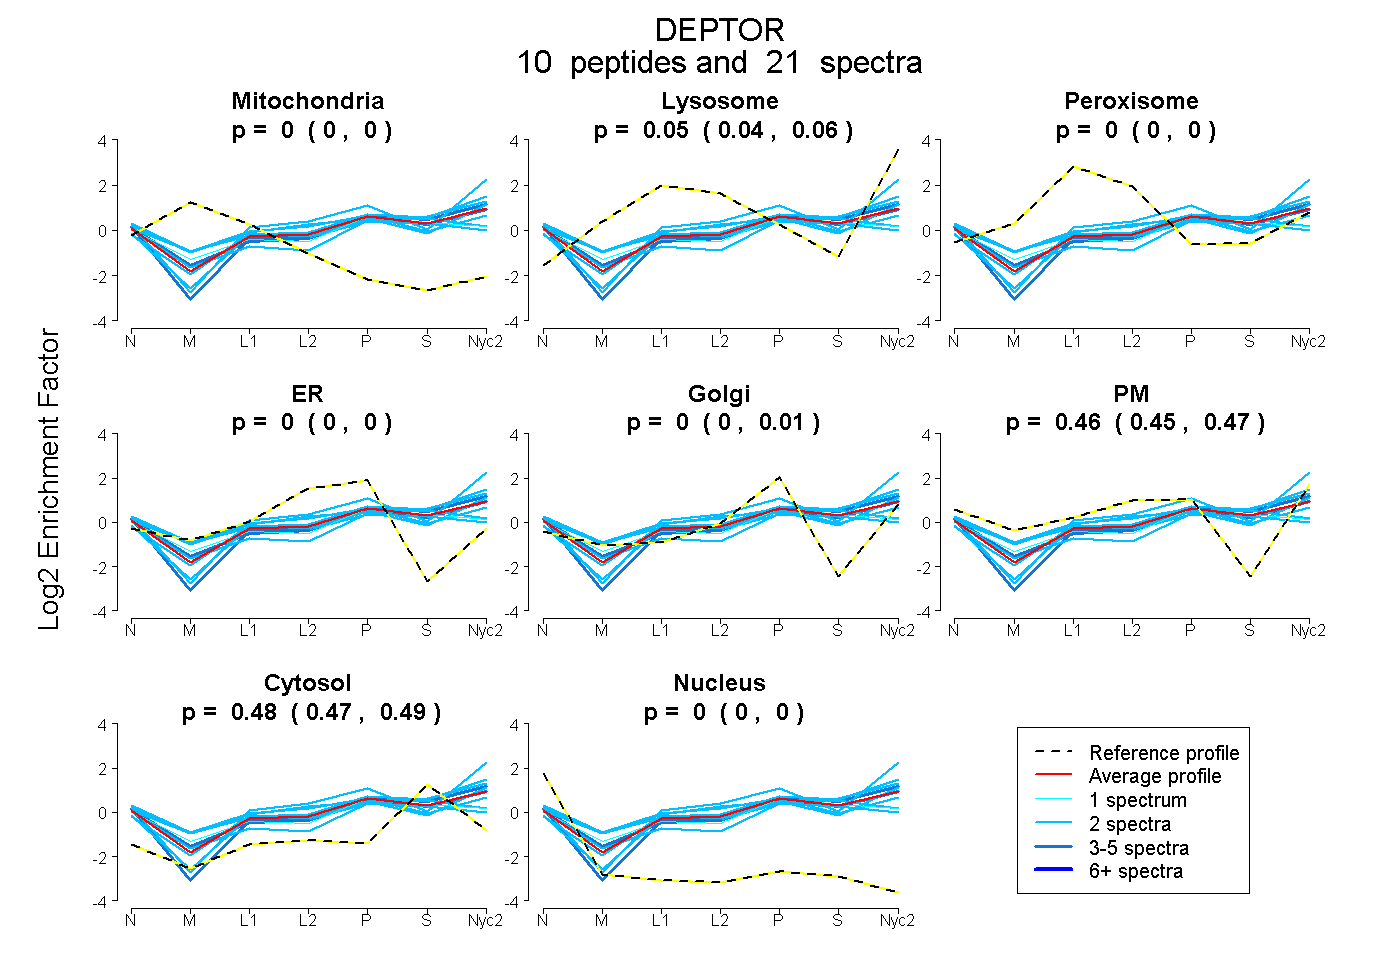
| Expt A |
10 peptides |
21 spectra |
|
0.000 0.000 | 0.000 |
0.052 0.037 | 0.064 |
0.000 0.000 | 0.000 |
0.000 0.000 | 0.000 |
0.000 0.000 | 0.010 |
0.465 0.449 | 0.473 |
0.484 0.474 | 0.491 |
0.000 0.000 | 0.000 |
| 2 spectra, MAEVLVTGEQLR | 0.000 | 0.079 | 0.050 | 0.000 | 0.000 | 0.517 | 0.354 | 0.000 | ||
| 2 spectra, LMELLNEK | 0.000 | 0.187 | 0.000 | 0.000 | 0.056 | 0.415 | 0.342 | 0.000 | ||
| 2 spectra, HPFVDSNLLYQFR | 0.000 | 0.000 | 0.000 | 0.000 | 0.133 | 0.281 | 0.586 | 0.000 | ||
| 2 spectra, RPVTSEELLTPGAPYAR | 0.000 | 0.000 | 0.114 | 0.000 | 0.010 | 0.508 | 0.368 | 0.000 | ||
| 3 spectra, ELIDWLIEHK | 0.000 | 0.000 | 0.000 | 0.000 | 0.030 | 0.421 | 0.549 | 0.000 | ||
| 2 spectra, GIIHHVCDEHK | 0.000 | 0.178 | 0.000 | 0.000 | 0.019 | 0.288 | 0.515 | 0.000 | ||
| 3 spectra, DDGTFPLDNEVK | 0.000 | 0.029 | 0.000 | 0.000 | 0.022 | 0.467 | 0.482 | 0.000 | ||
| 2 spectra, TVSNLILTGPR | 0.000 | 0.165 | 0.000 | 0.000 | 0.089 | 0.249 | 0.498 | 0.000 | ||
| 2 spectra, EAEQLCHR | 0.000 | 0.000 | 0.162 | 0.000 | 0.142 | 0.236 | 0.460 | 0.000 | ||
| 1 spectrum, TYPNCFVAK | 0.000 | 0.000 | 0.086 | 0.000 | 0.201 | 0.231 | 0.483 | 0.000 |
| Plot | Mito | Lyso or Perox | ER | Golgi | PM | Cytosol | Nucleus | ||||||
| Expt B |
4 peptides |
5 spectra |
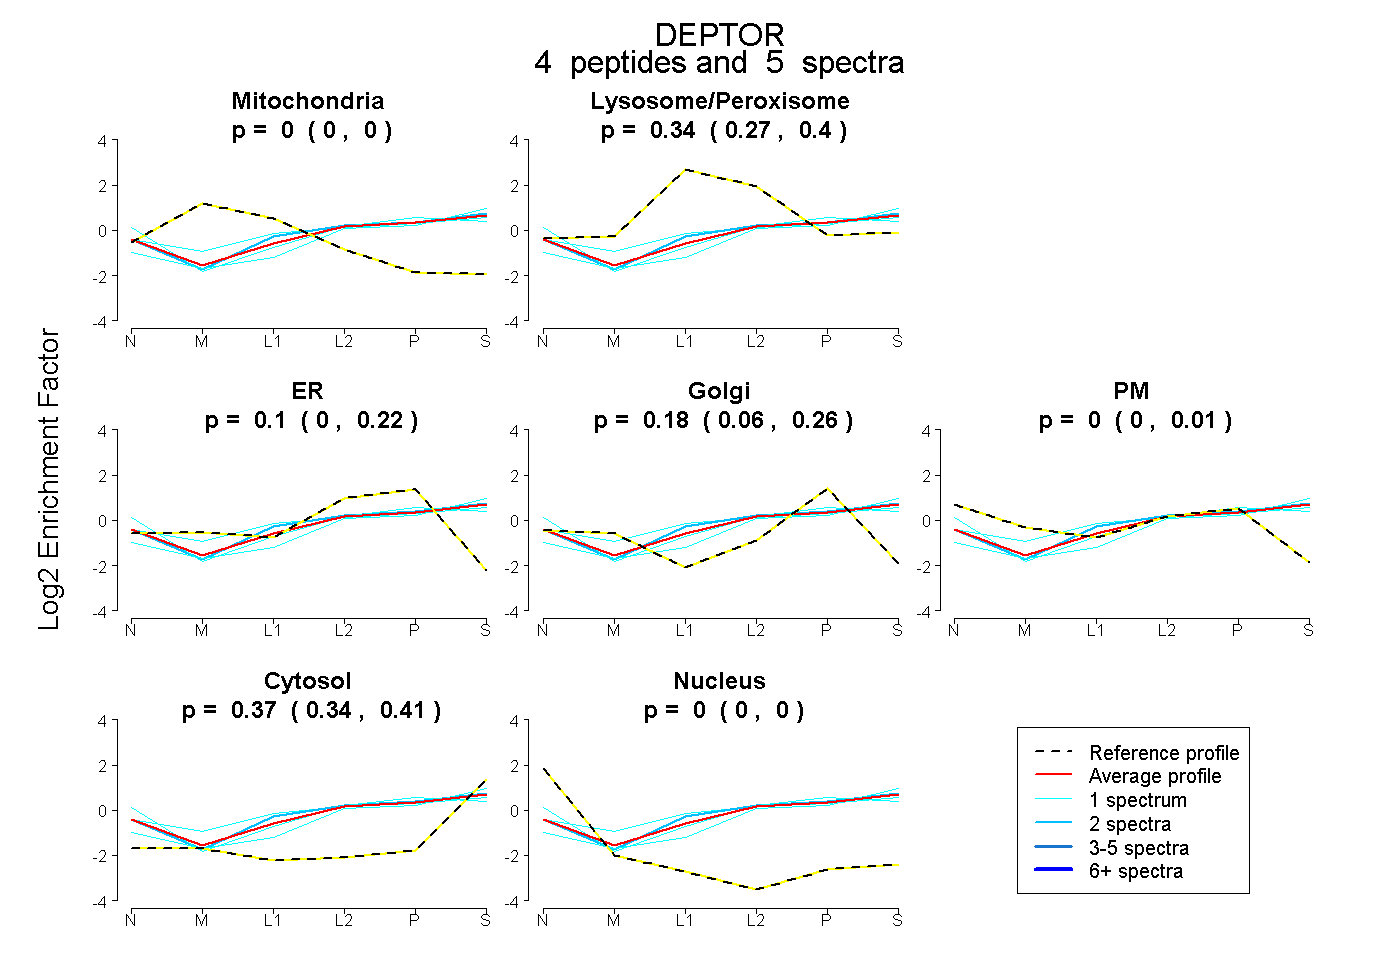 |
0.000 0.000 | 0.000 |
0.344 0.273 | 0.398 |
0.096 0.000 | 0.217 |
0.185 0.060 | 0.263 |
0.000 0.000 | 0.006 |
0.375 0.335 | 0.414 |
0.000 0.000 | 0.000 |
|||
| Plot | Lyso | Other | |||||||||||
| Expt C |
10 peptides |
37 spectra |
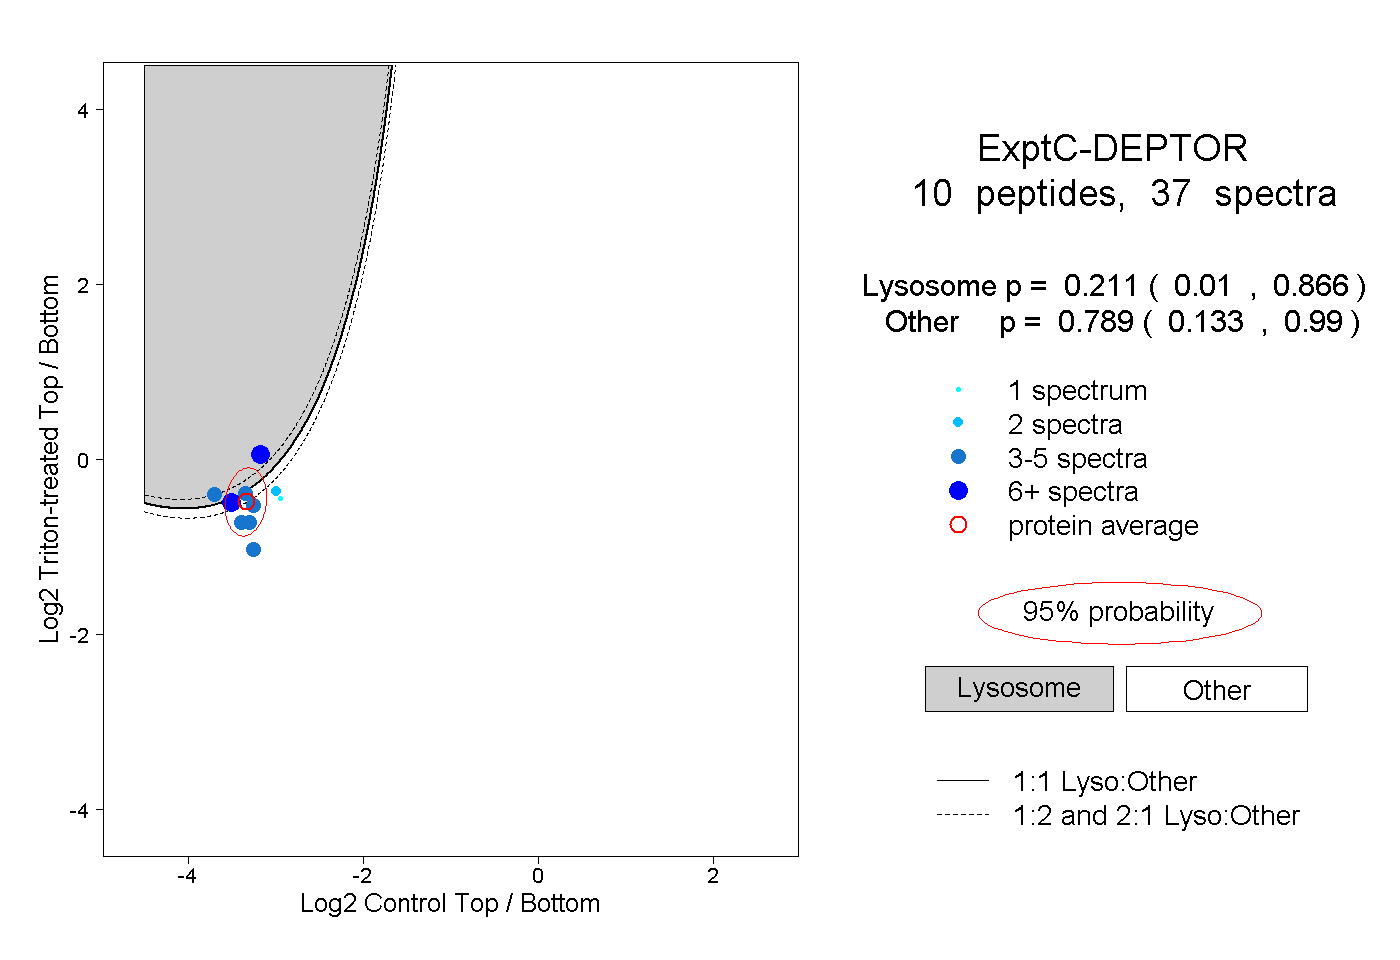 |
0.211 0.010 | 0.866 |
0.789 0.133 | 0.990 |
||||||||
| Plot | Lyso | Other | |||||||||||
| Expt D |
2 peptides |
3 spectra |
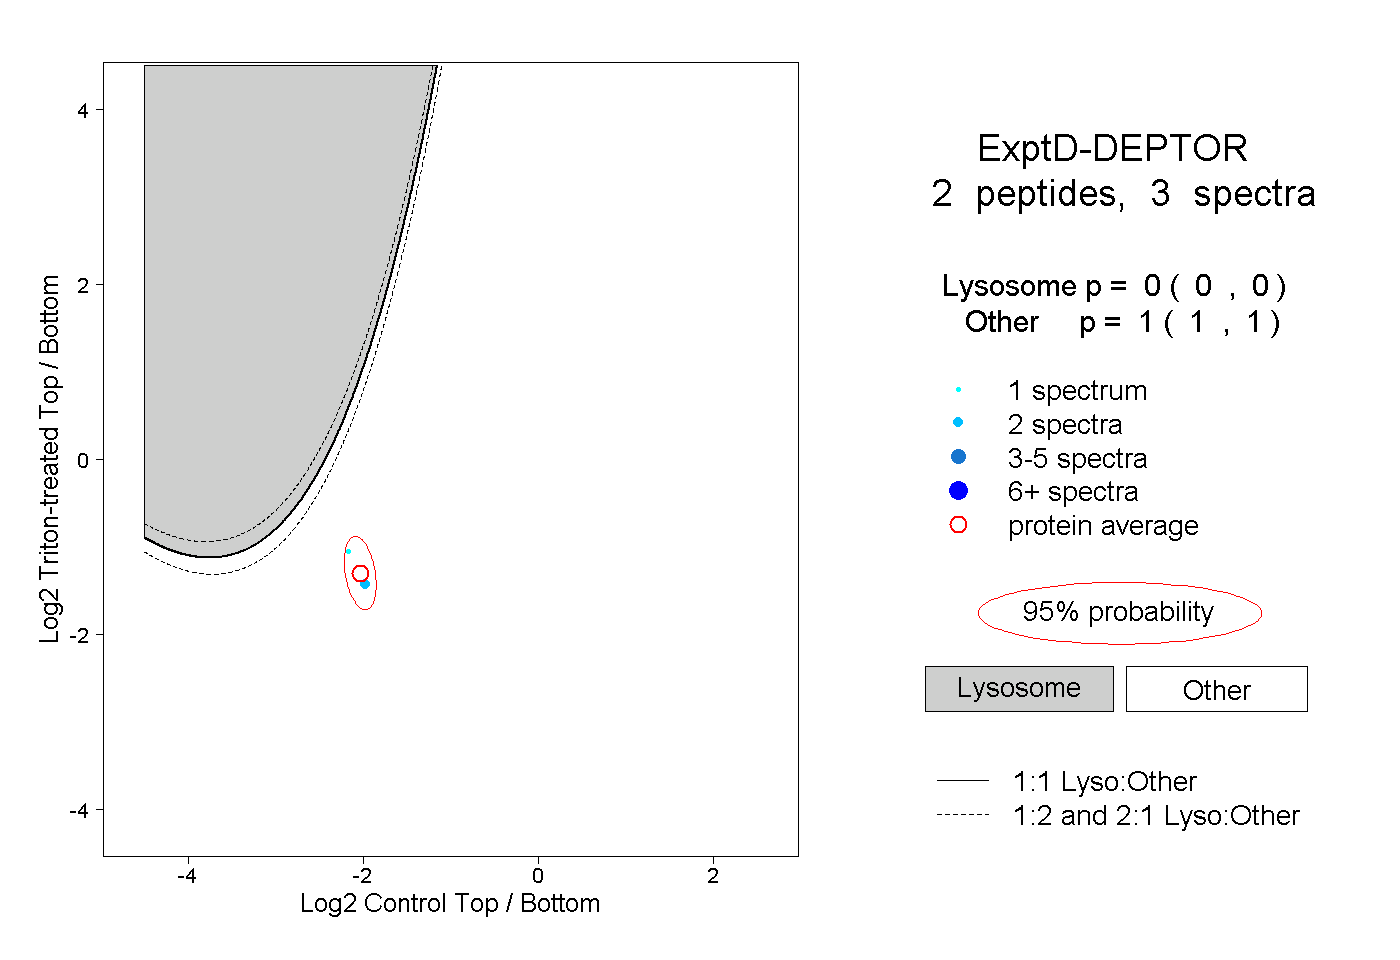 |
0.000 0.000 | 0.000 |
1.000 1.000 | 1.000 |