 10
10peptides
spectra
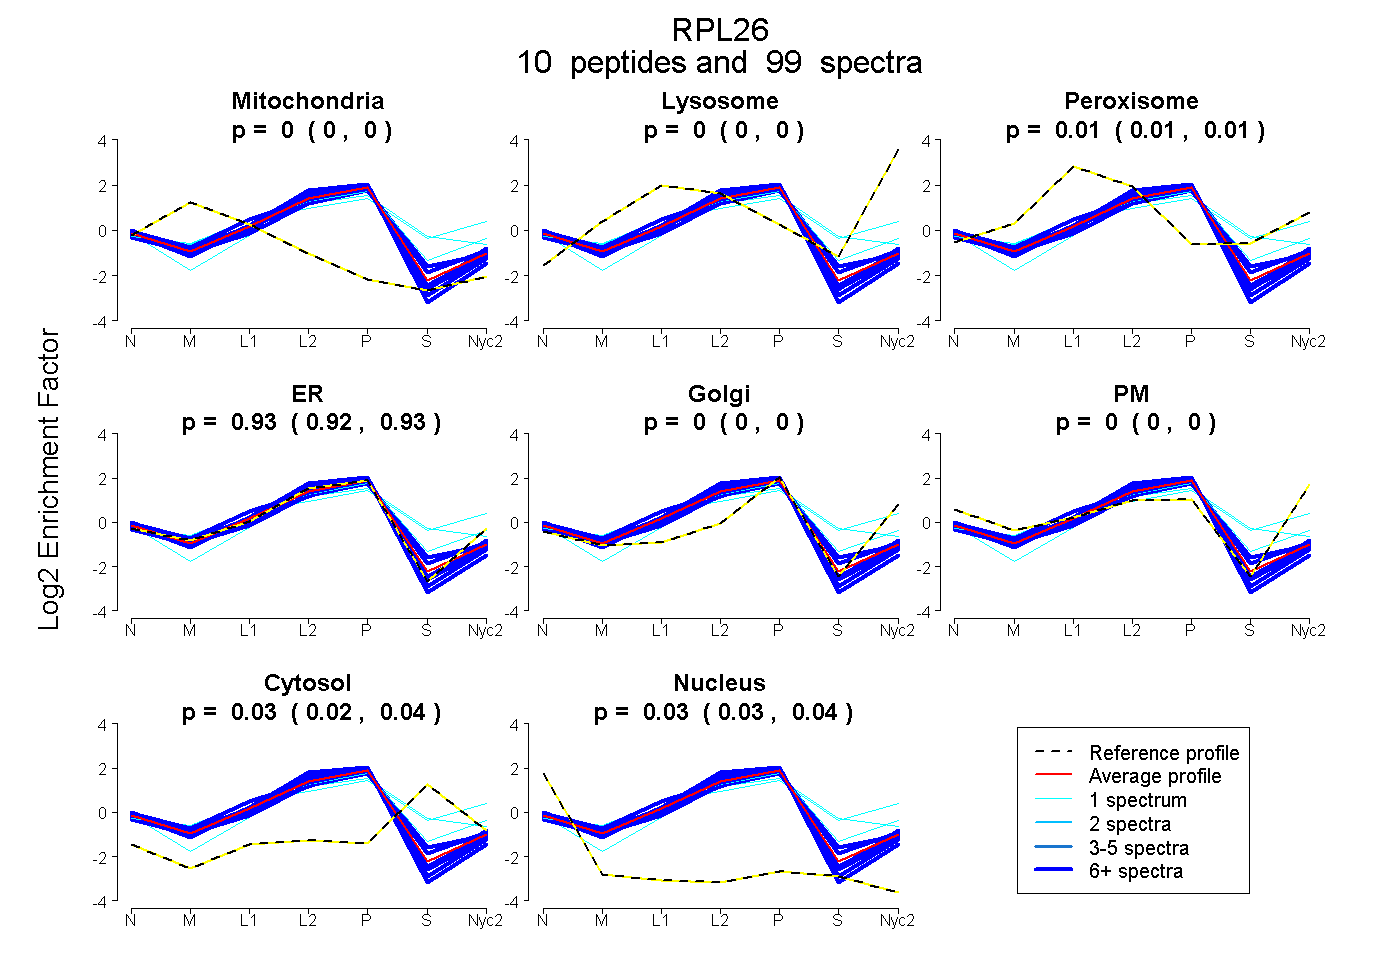
0.000 | 0.000
0.000 | 0.000
0.007 | 0.012
0.921 | 0.931
0.000 | 0.000
0.000 | 0.000
0.023 | 0.037
0.029 | 0.037
6peptides
spectra
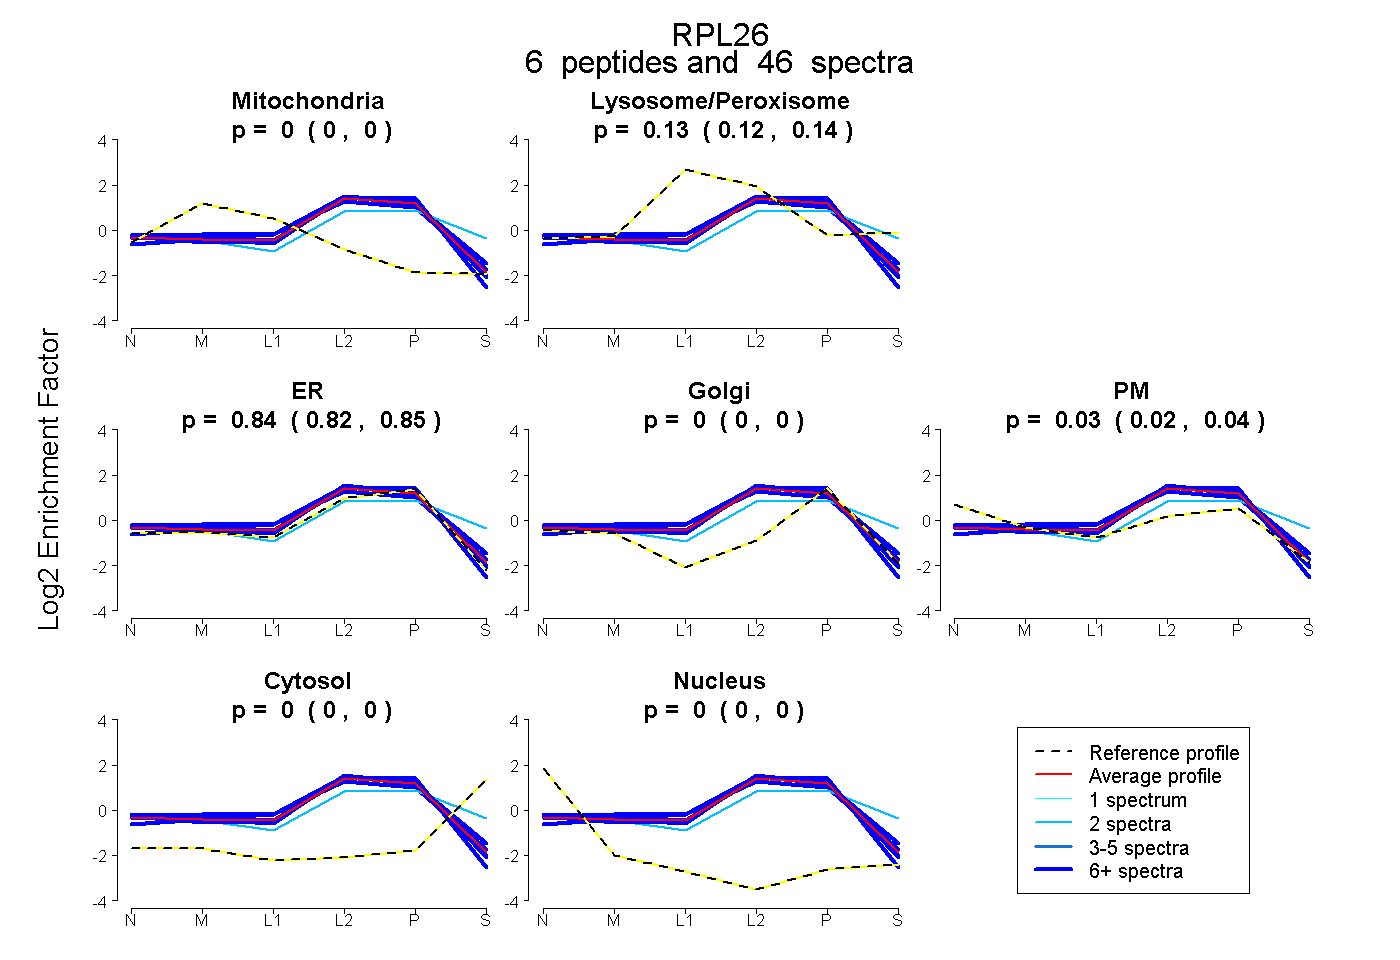
0.000 | 0.000
0.121 | 0.137
0.822 | 0.847
0.000 | 0.000
0.022 | 0.044
0.000 | 0.000
0.000 | 0.000
9peptides
spectra
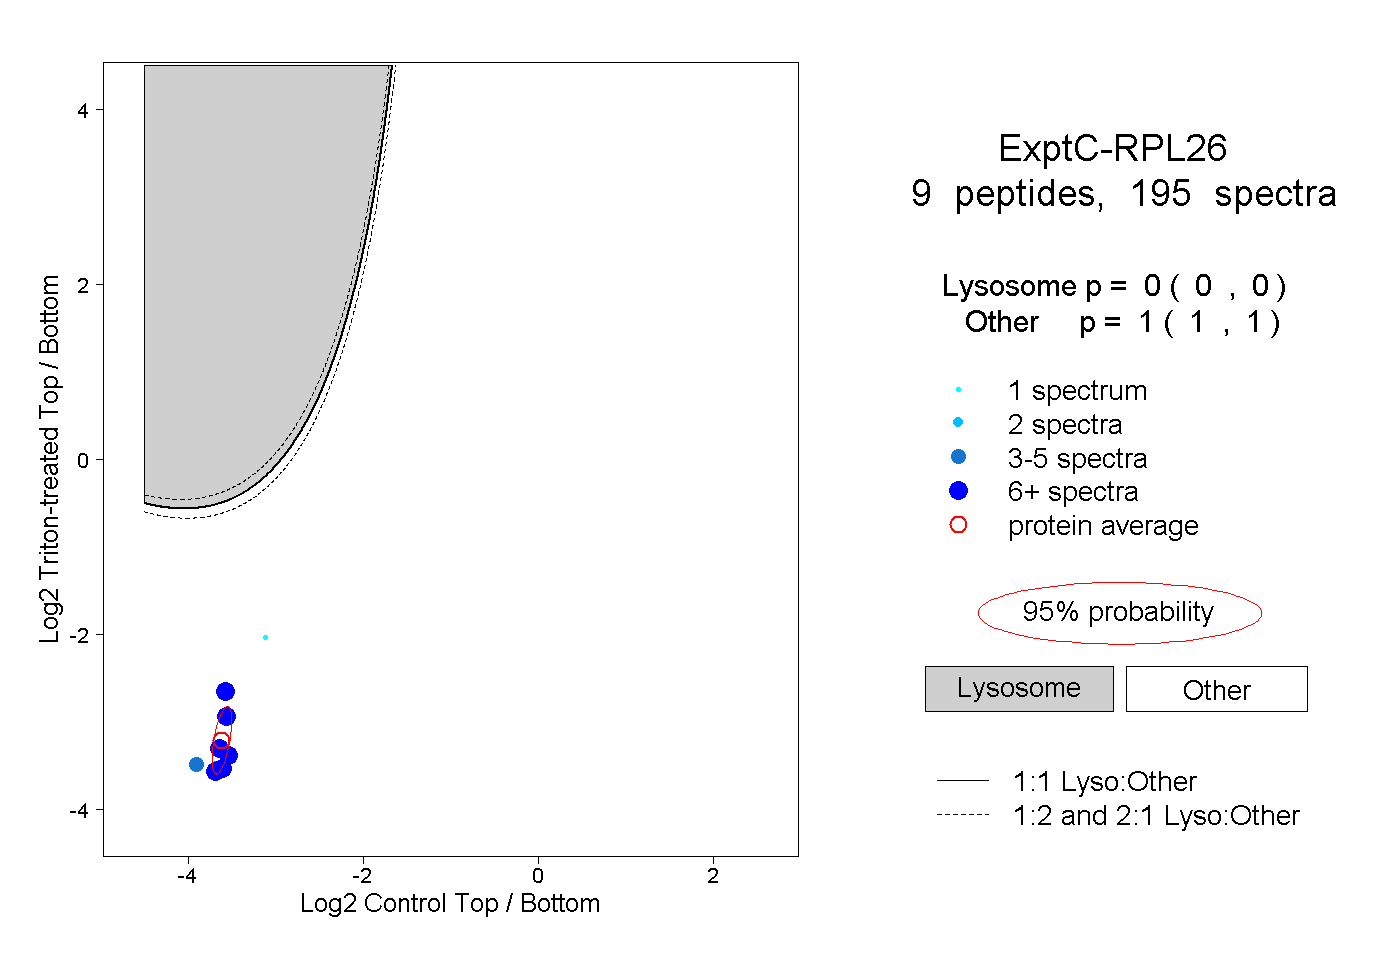
0.000 | 0.000
1.000 | 1.000
4peptides
spectra
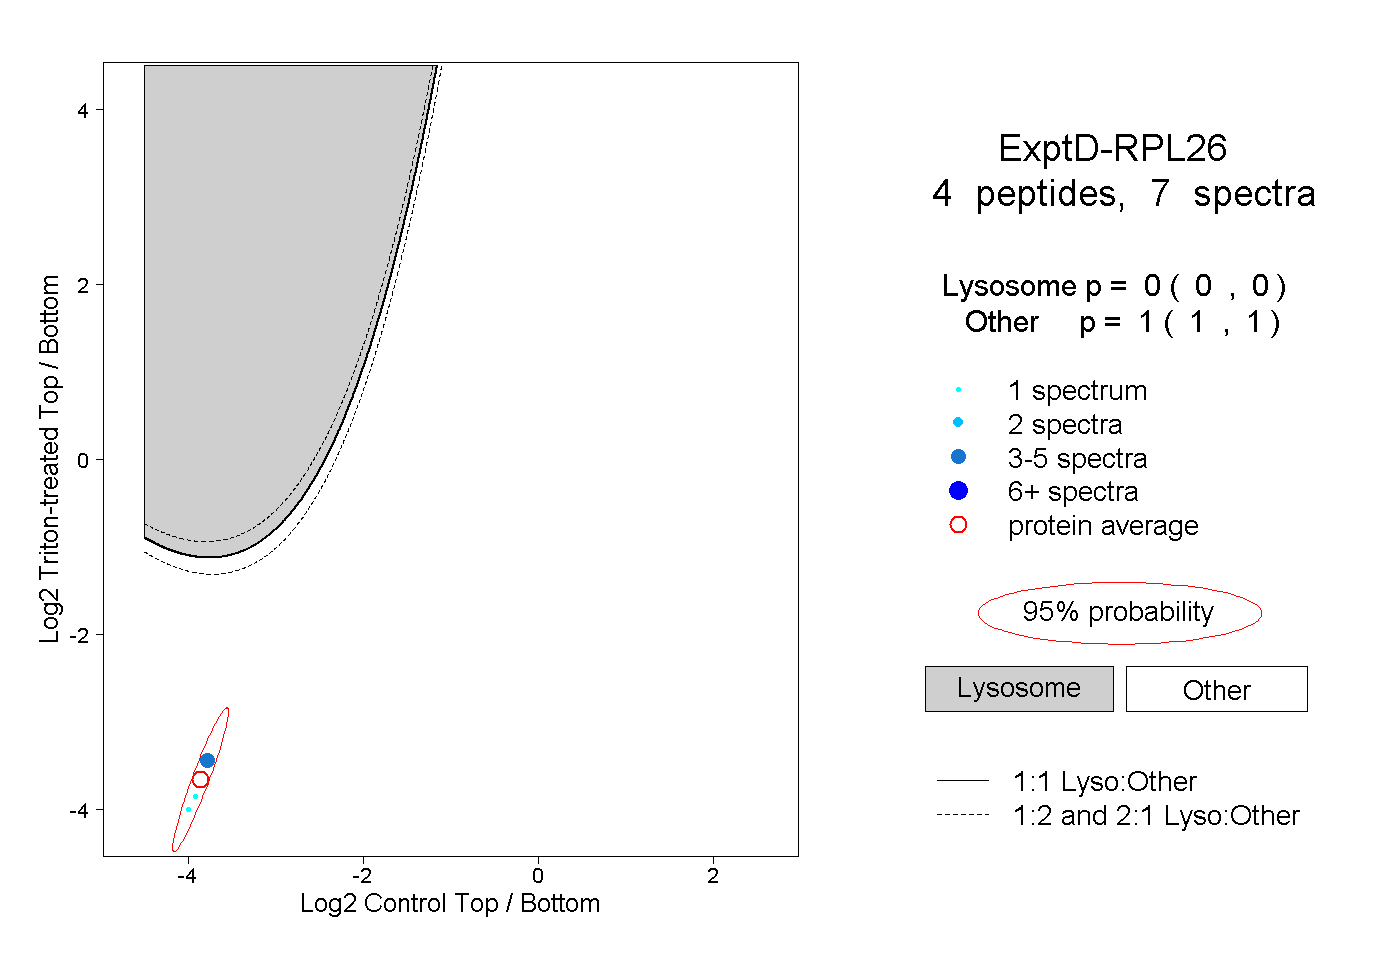
0.000 | 0.000
1.000 | 1.000