 10
10peptides
spectra
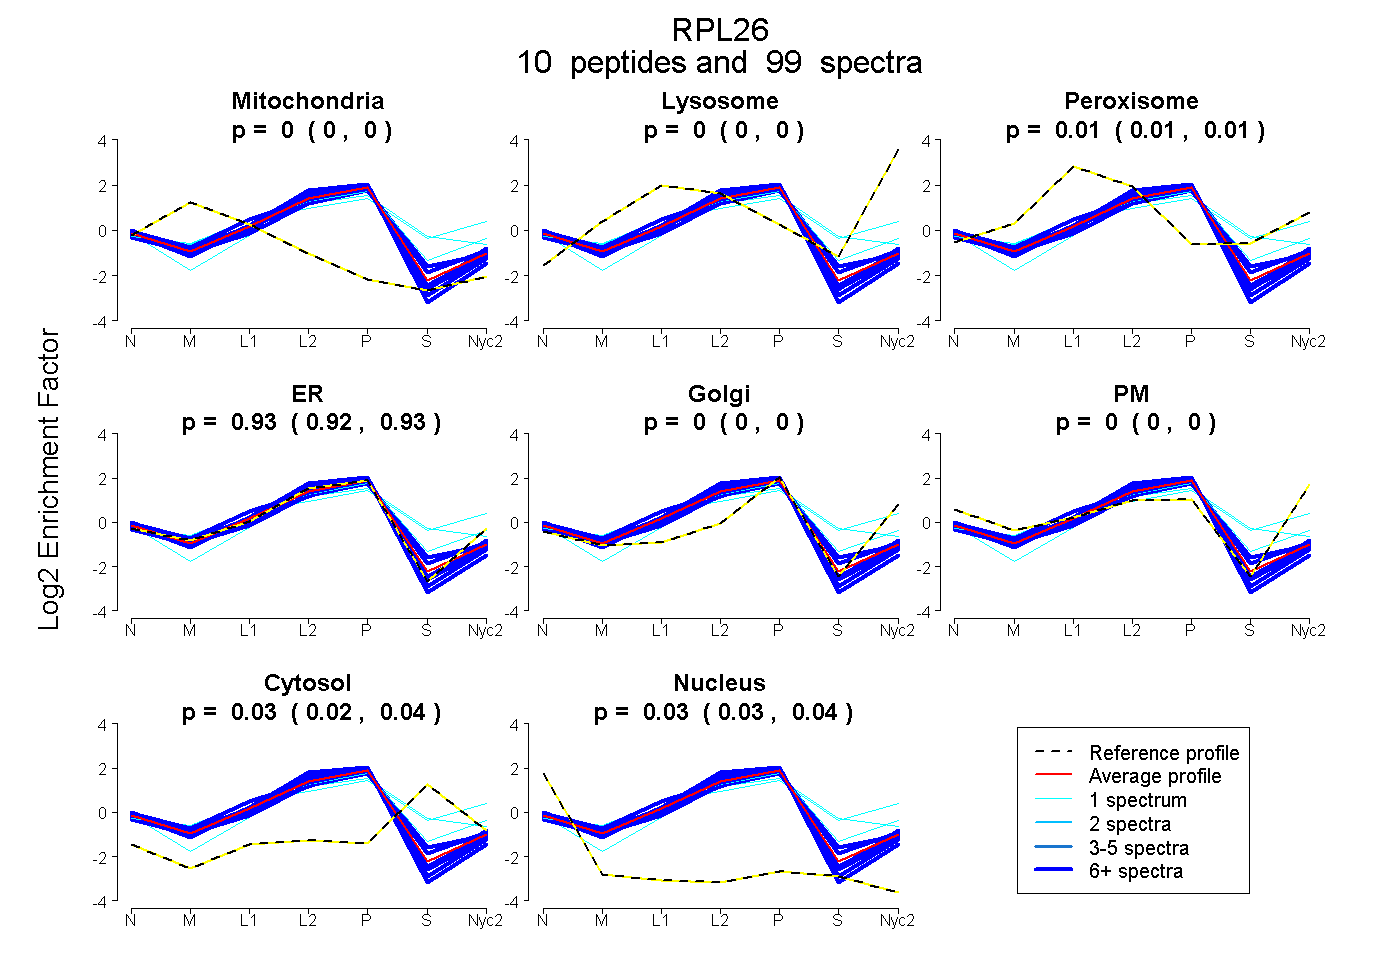
0.000 | 0.000
0.000 | 0.000
0.007 | 0.012
0.921 | 0.931
0.000 | 0.000
0.000 | 0.000
0.023 | 0.037
0.029 | 0.037
| Plot | Mito | Lyso | Perox | ER | Golgi | PM | Cytosol | Nucleus | |||||
| Expt A |
10 peptides |
99 spectra |
|
0.000 0.000 | 0.000 |
0.000 0.000 | 0.000 |
0.010 0.007 | 0.012 |
0.927 0.921 | 0.931 |
0.000 0.000 | 0.000 |
0.000 0.000 | 0.000 |
0.030 0.023 | 0.037 |
0.034 0.029 | 0.037 |
| 12 spectra, IMSSPLSK | 0.000 | 0.000 | 0.000 | 0.969 | 0.000 | 0.000 | 0.000 | 0.031 | ||
| 17 spectra, HINAPSHIR | 0.000 | 0.000 | 0.029 | 0.886 | 0.000 | 0.000 | 0.084 | 0.000 | ||
| 16 spectra, FNPFVTSDR | 0.000 | 0.000 | 0.000 | 0.842 | 0.000 | 0.000 | 0.139 | 0.019 | ||
| 25 spectra, VVQVYR | 0.048 | 0.000 | 0.012 | 0.937 | 0.000 | 0.000 | 0.000 | 0.003 | ||
| 1 spectrum, SMPIR | 0.000 | 0.000 | 0.163 | 0.736 | 0.000 | 0.000 | 0.100 | 0.000 | ||
| 9 spectra, YVIYIER | 0.000 | 0.000 | 0.000 | 0.949 | 0.000 | 0.000 | 0.000 | 0.051 | ||
| 1 spectrum, ANGTTVHVGIHPSK | 0.000 | 0.019 | 0.332 | 0.210 | 0.292 | 0.000 | 0.146 | 0.000 | ||
| 7 spectra, GQQIGK | 0.018 | 0.000 | 0.000 | 0.930 | 0.000 | 0.000 | 0.000 | 0.051 | ||
| 10 spectra, DDEVQVVR | 0.000 | 0.000 | 0.000 | 0.959 | 0.000 | 0.000 | 0.000 | 0.041 | ||
| 1 spectrum, EETIEK | 0.000 | 0.000 | 0.025 | 0.646 | 0.000 | 0.000 | 0.329 | 0.000 |
| Plot | Mito | Lyso or Perox | ER | Golgi | PM | Cytosol | Nucleus | ||||||
| Expt B |
6 peptides |
46 spectra |
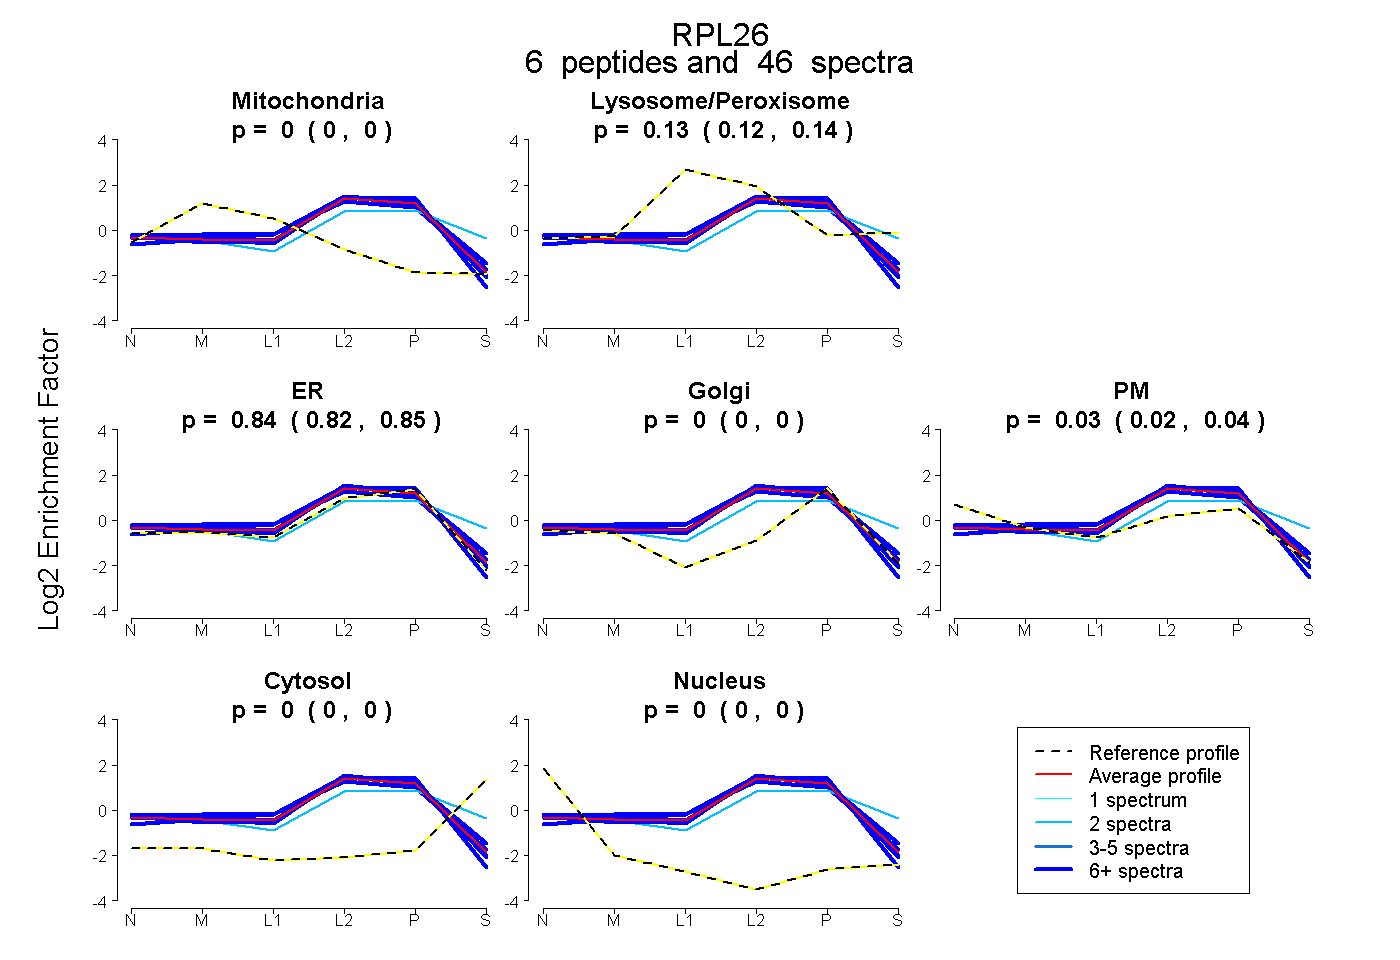 |
0.000 0.000 | 0.000 |
0.130 0.121 | 0.137 |
0.836 0.822 | 0.847 |
0.000 0.000 | 0.000 |
0.034 0.022 | 0.044 |
0.000 0.000 | 0.000 |
0.000 0.000 | 0.000 |
|||
| Plot | Lyso | Other | |||||||||||
| Expt C |
9 peptides |
195 spectra |
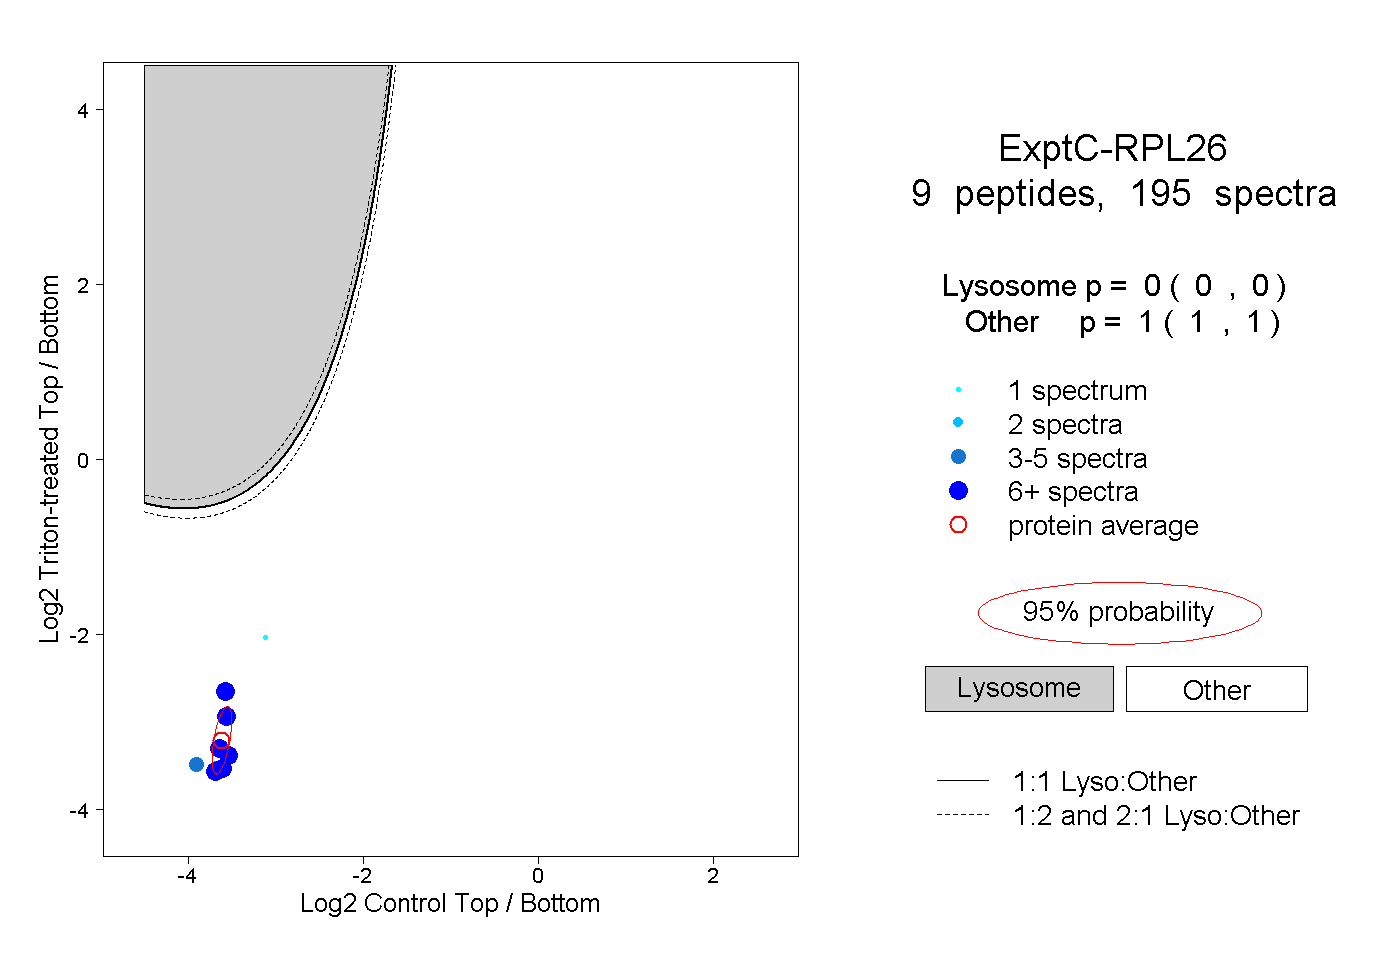 |
0.000 0.000 | 0.000 |
1.000 1.000 | 1.000 |
||||||||
| Plot | Lyso | Other | |||||||||||
| Expt D |
4 peptides |
7 spectra |
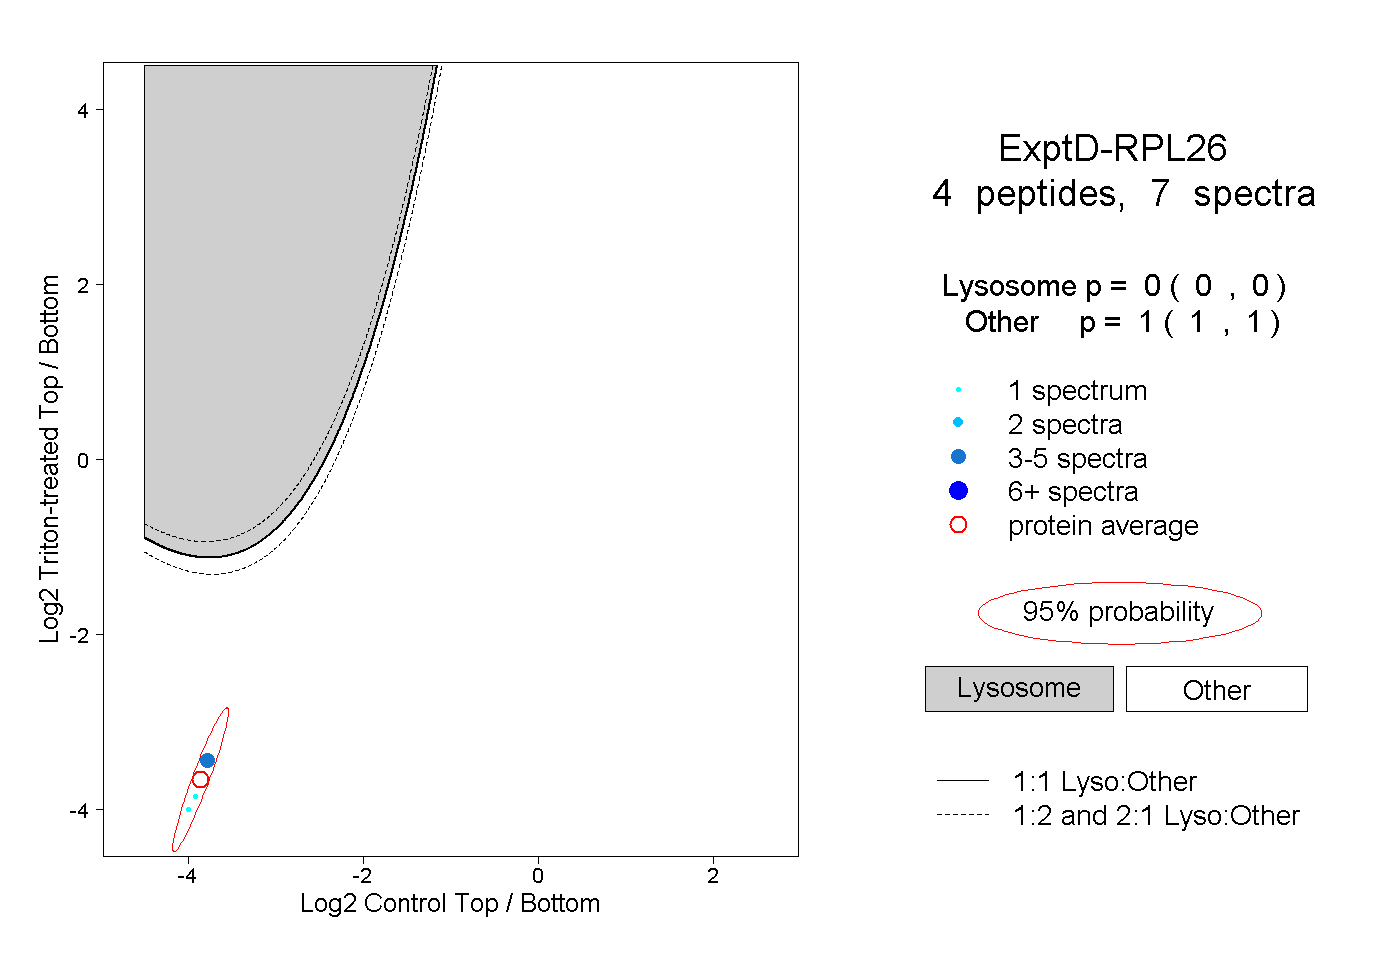 |
0.000 0.000 | 0.000 |
1.000 1.000 | 1.000 |