RPL26
[ENSRNOP00000005588]
Main page
| | | Plot |
Mito |
Lyso |
|
Perox |
ER |
Golgi |
PM |
Cytosol |
Nucleus |
|
| Expt A |
 10
10
peptides |
99
spectra |
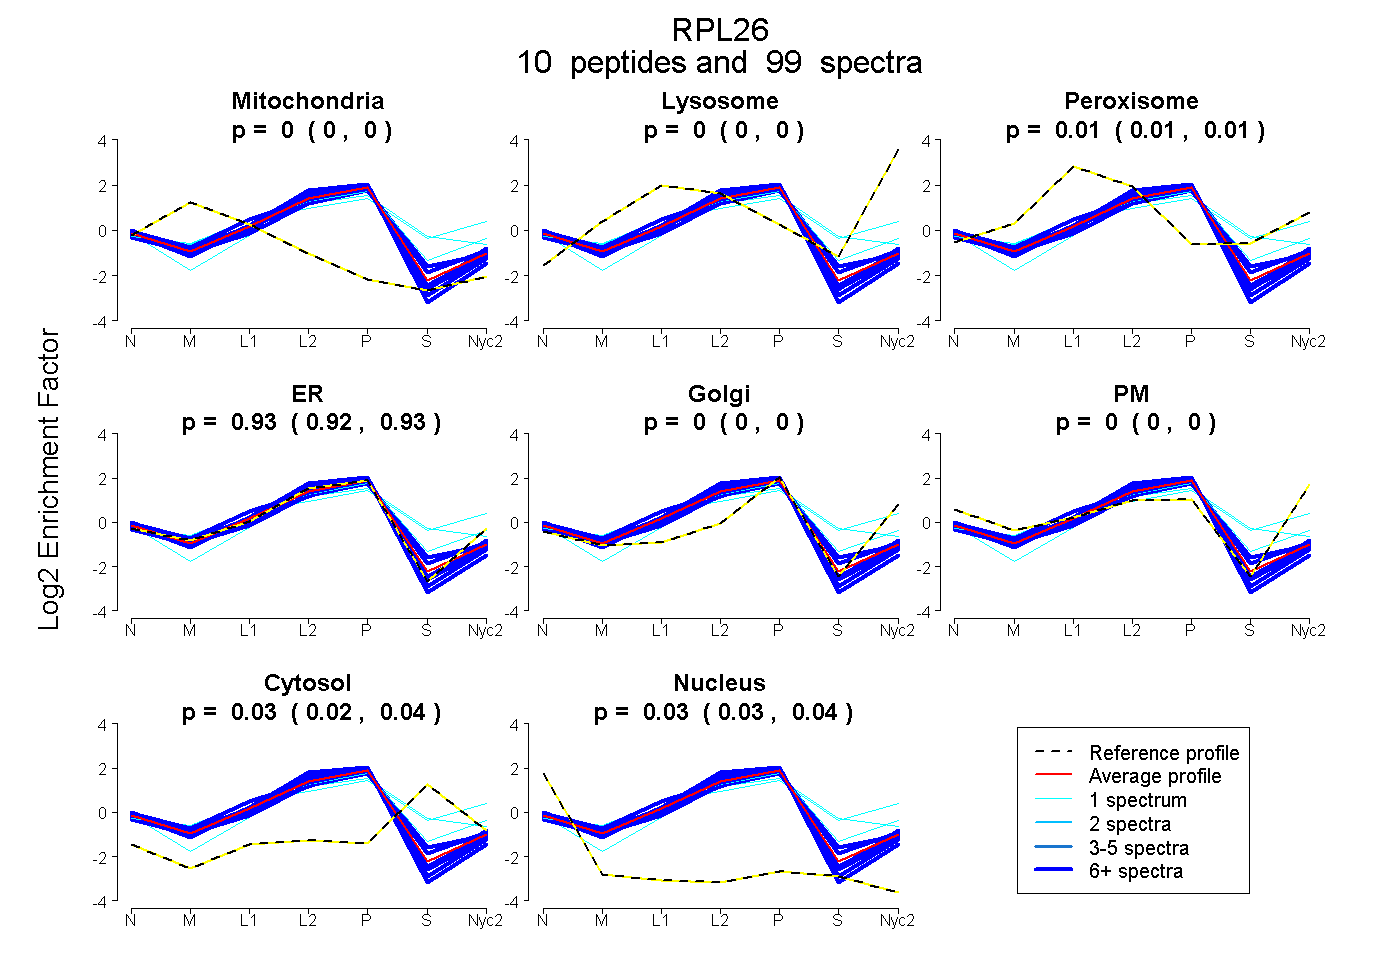 |
0.000
0.000 | 0.000 |
0.000
0.000 | 0.000 |
|
0.010
0.007 | 0.012 |
0.927
0.921 | 0.931 |
0.000
0.000 | 0.000 |
0.000
0.000 | 0.000 |
0.030
0.023 | 0.037 |
0.034
0.029 | 0.037 |
|
| | | Plot |
Mito |
|
Lyso or Perox |
|
ER |
Golgi |
PM |
Cytosol |
Nucleus |
|
| Expt B |
6
peptides |
46
spectra |
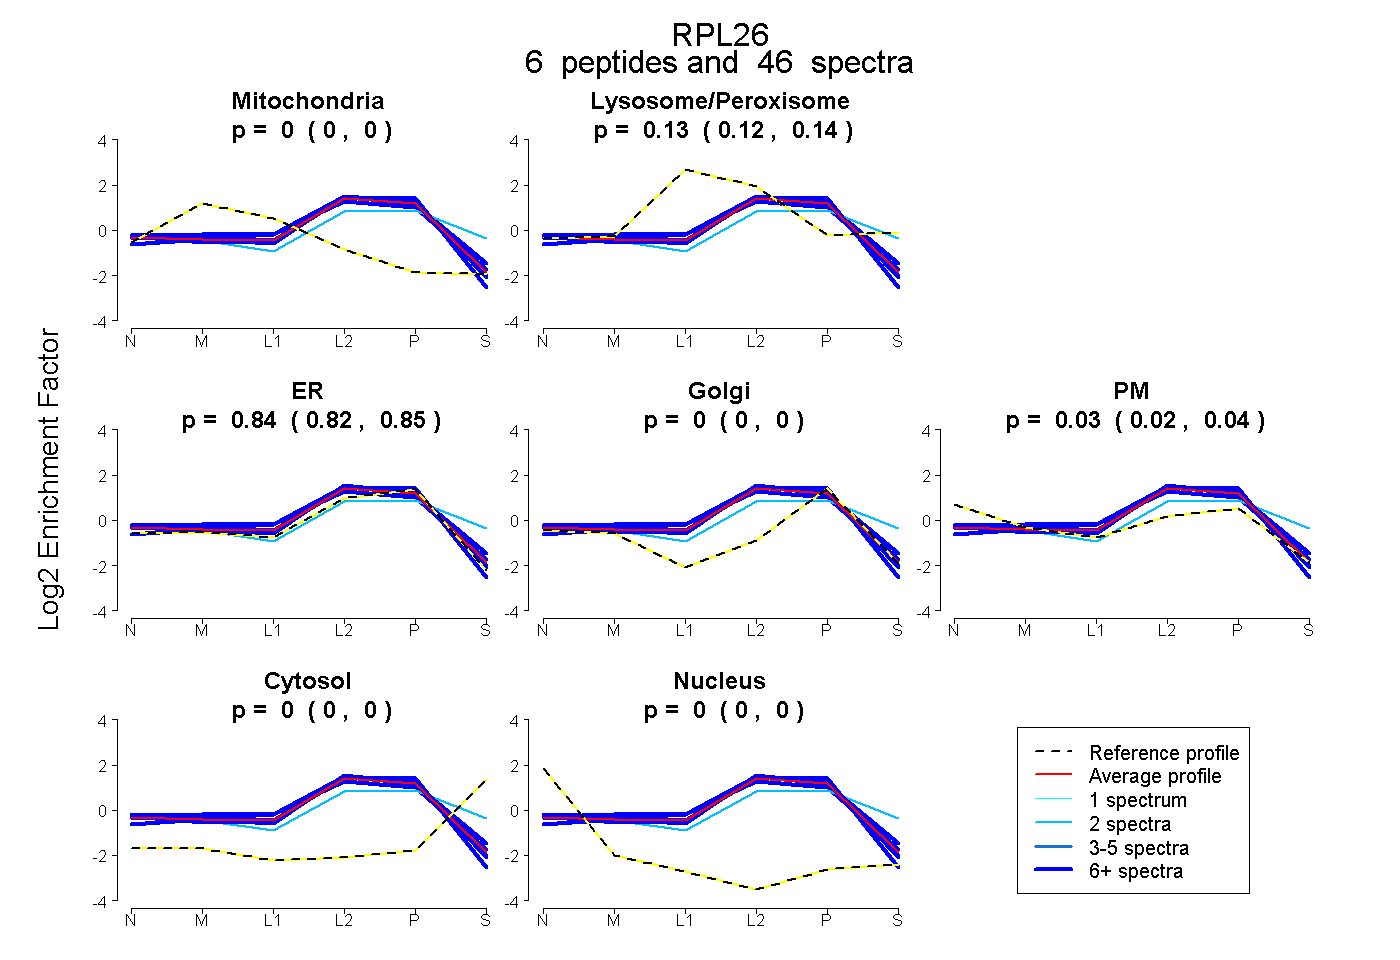 |
0.000
0.000 | 0.000 |
|
0.130
0.121 | 0.137 |
|
0.836
0.822 | 0.847 |
0.000
0.000 | 0.000 |
0.034
0.022 | 0.044 |
0.000
0.000 | 0.000 |
0.000
0.000 | 0.000 |
|
| 10 spectra, HFNAPSHIR |
0.000 |
|
0.151 |
|
0.831 |
0.000 |
0.000 |
0.018 |
0.000 |
|
| 7 spectra, VVQVYR |
0.000 |
|
0.157 |
|
0.842 |
0.000 |
0.001 |
0.000 |
0.000 |
|
| 2 spectra, IMSSPLSK |
0.000 |
|
0.178 |
|
0.470 |
0.059 |
0.112 |
0.182 |
0.000 |
|
| 8 spectra, DDEVQVIR |
0.000 |
|
0.044 |
|
0.956 |
0.000 |
0.000 |
0.000 |
0.000 |
|
| 7 spectra, YVIYIER |
0.000 |
|
0.084 |
|
0.916 |
0.000 |
0.000 |
0.000 |
0.000 |
|
| 12 spectra, FNPFVTSDR |
0.000 |
|
0.189 |
|
0.664 |
0.000 |
0.147 |
0.000 |
0.000 |
|
| | | Plot |
|
Lyso |
|
|
|
|
|
|
|
Other |
| Expt C |
9
peptides |
195
spectra |
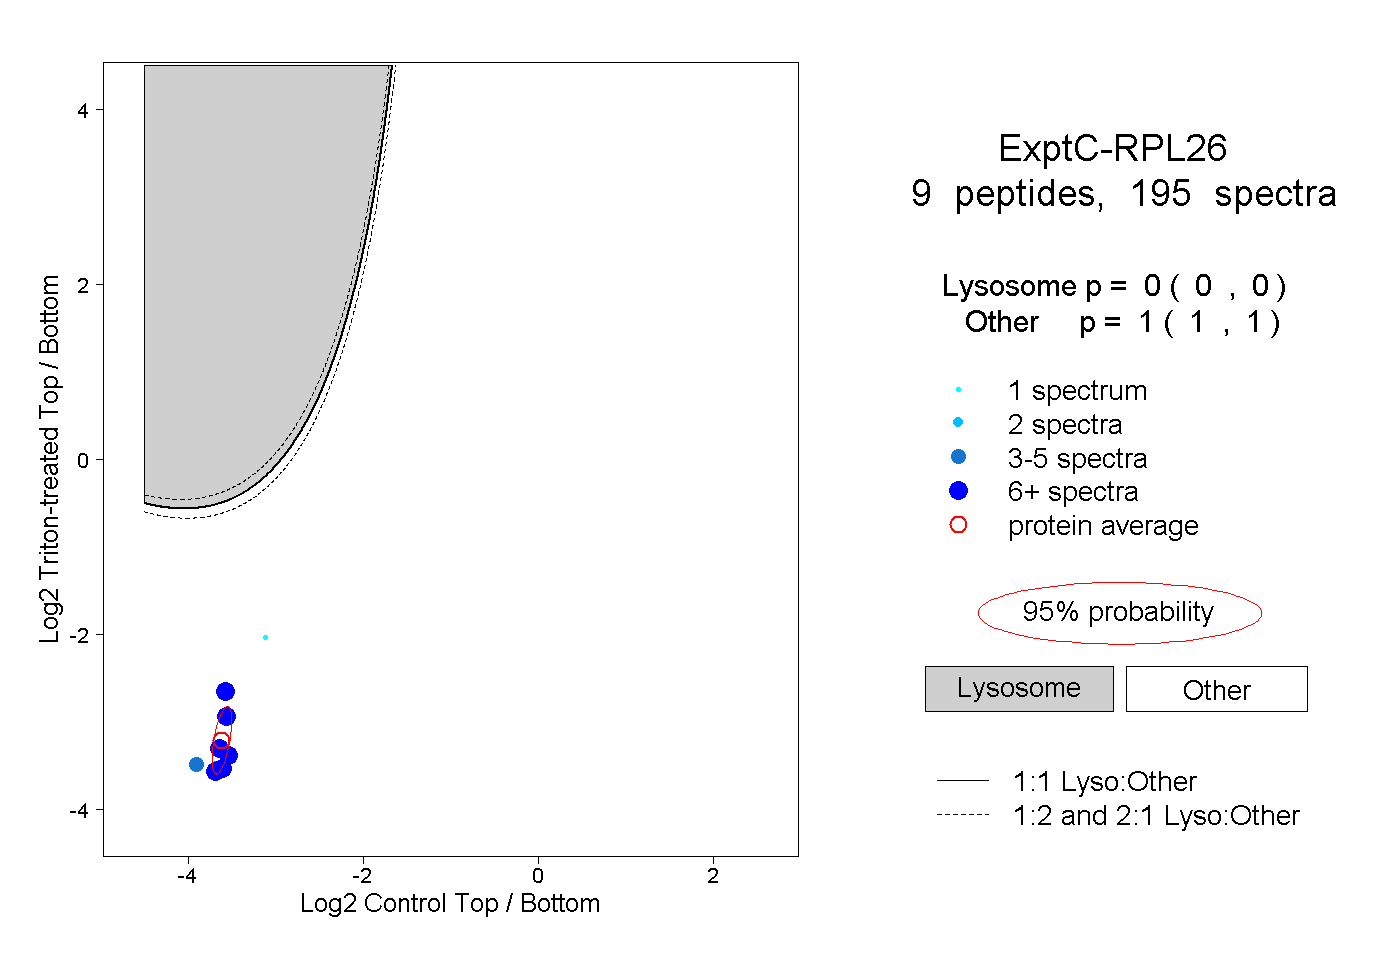 |
|
0.000
0.000 | 0.000 |
|
|
|
|
|
|
|
1.000
1.000 | 1.000 |
| | | Plot |
|
Lyso |
|
|
|
|
|
|
|
Other |
| Expt D |
4
peptides |
7
spectra |
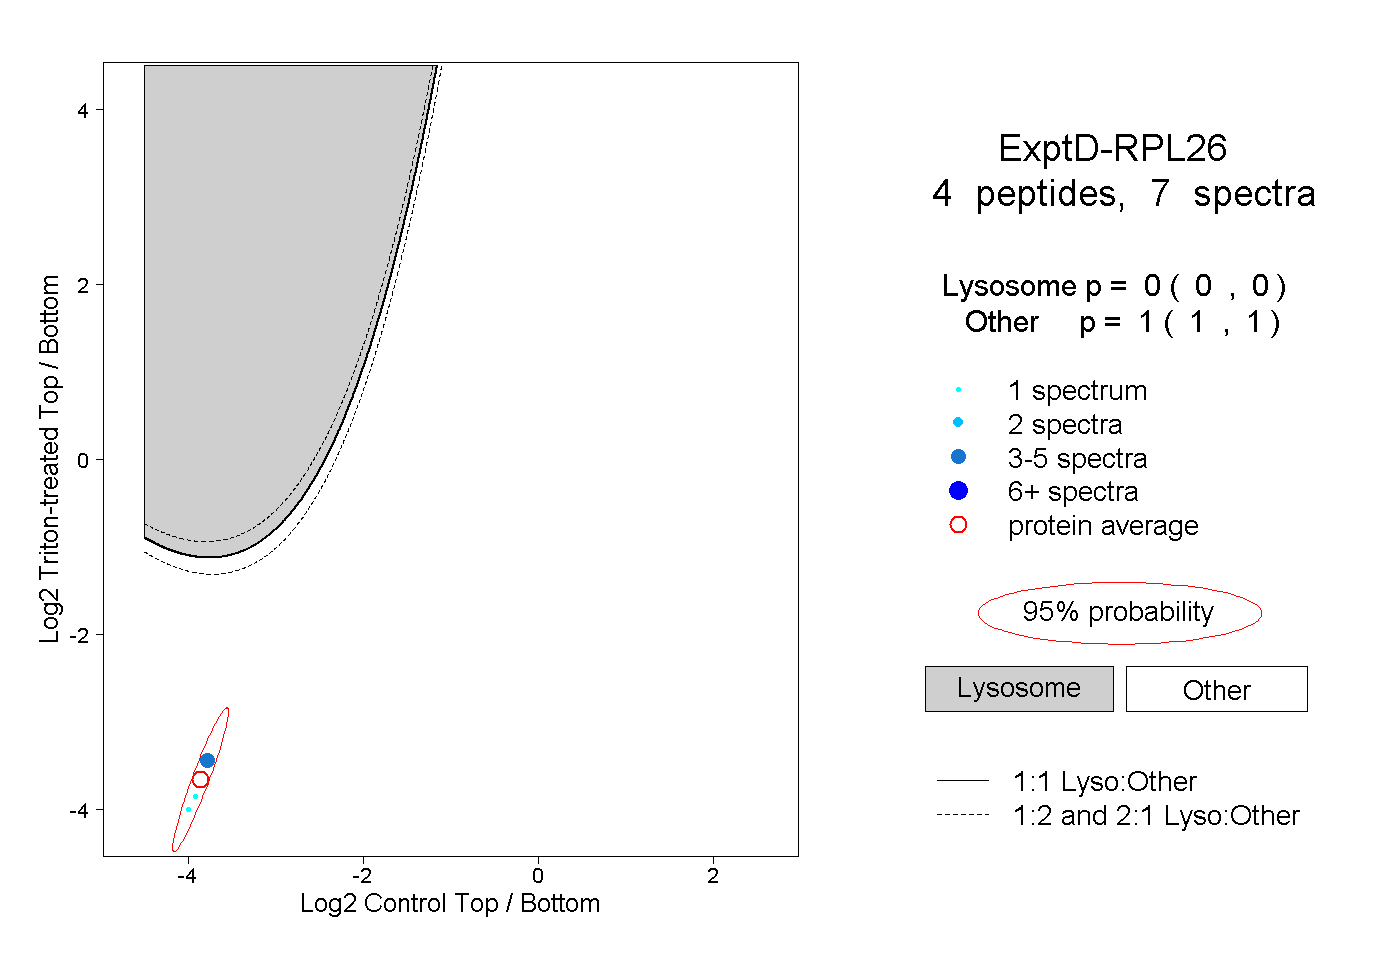 |
|
0.000
0.000 | 0.000 |
|
|
|
|
|
|
|
1.000
1.000 | 1.000 |