 10
10peptides
spectra
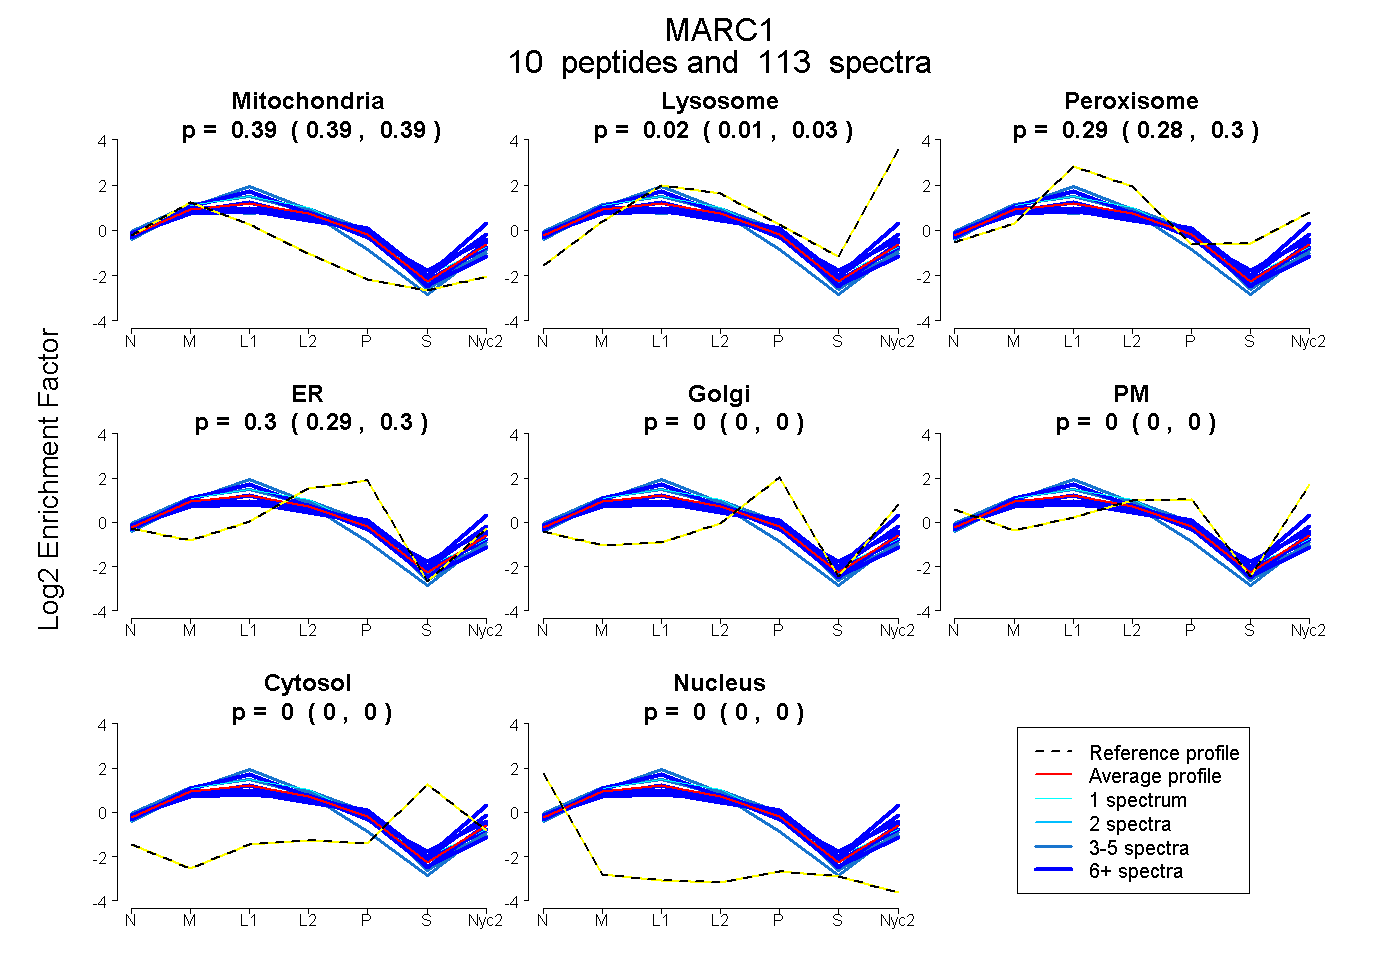
0.388 | 0.393
0.014 | 0.028
0.283 | 0.299
0.291 | 0.299
0.000 | 0.000
0.000 | 0.000
0.000 | 0.000
0.000 | 0.000
10peptides
spectra
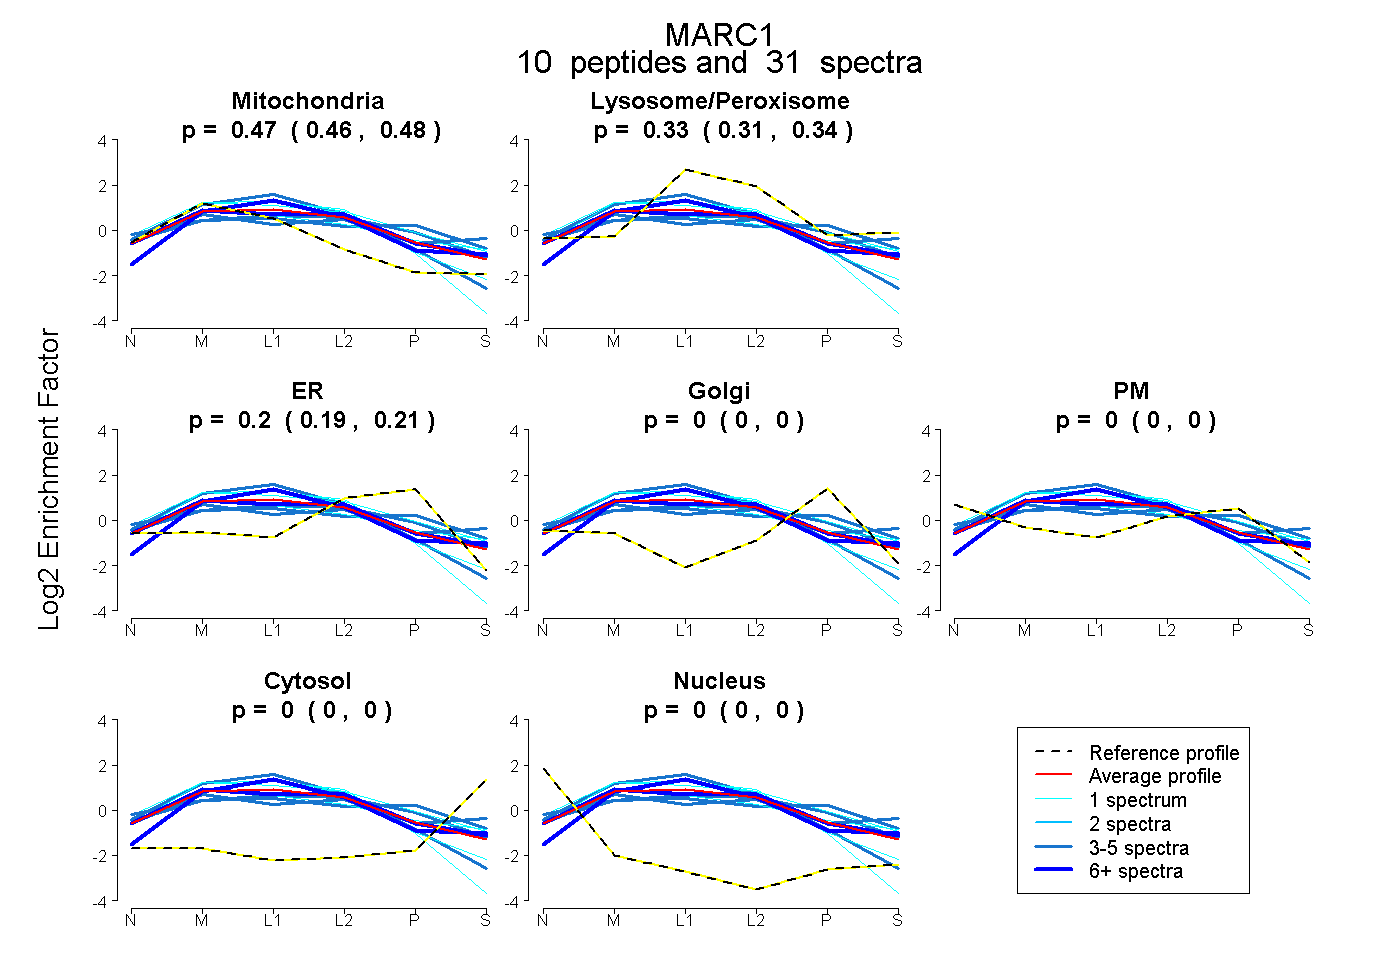
0.463 | 0.481
0.312 | 0.339
0.186 | 0.212
0.000 | 0.000
0.000 | 0.000
0.000 | 0.000
0.000 | 0.000
13peptides
spectra
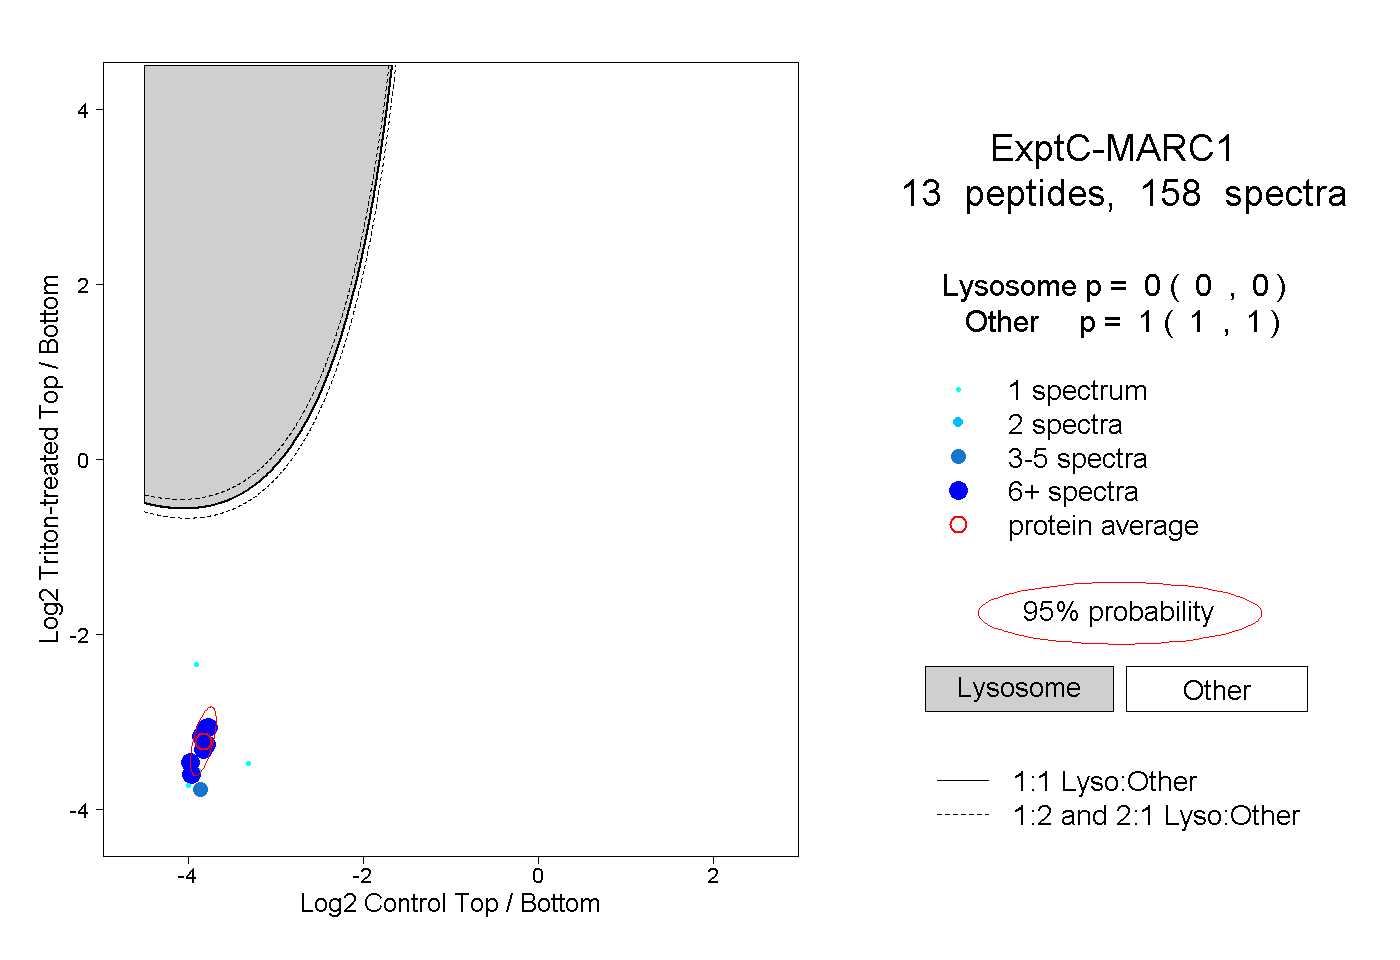
0.000 | 0.000
1.000 | 1.000
7peptides
spectra
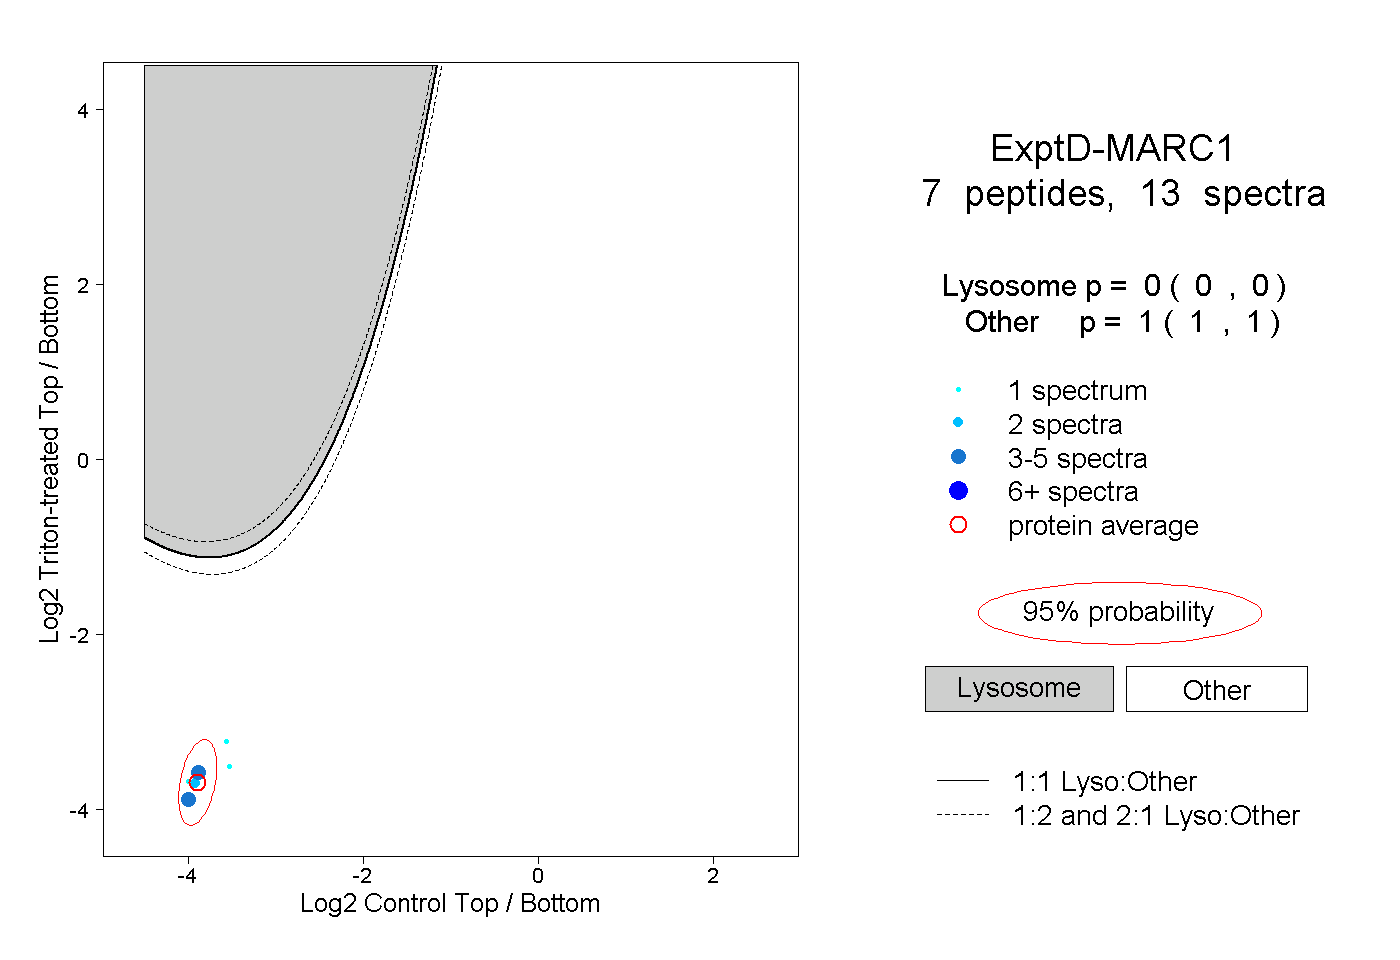
0.000 | 0.000
1.000 | 1.000