 10
10peptides
spectra
0.388 | 0.393
0.014 | 0.028
0.283 | 0.299
0.291 | 0.299
0.000 | 0.000
0.000 | 0.000
0.000 | 0.000
0.000 | 0.000
| Plot | Mito | Lyso | Perox | ER | Golgi | PM | Cytosol | Nucleus | |||||
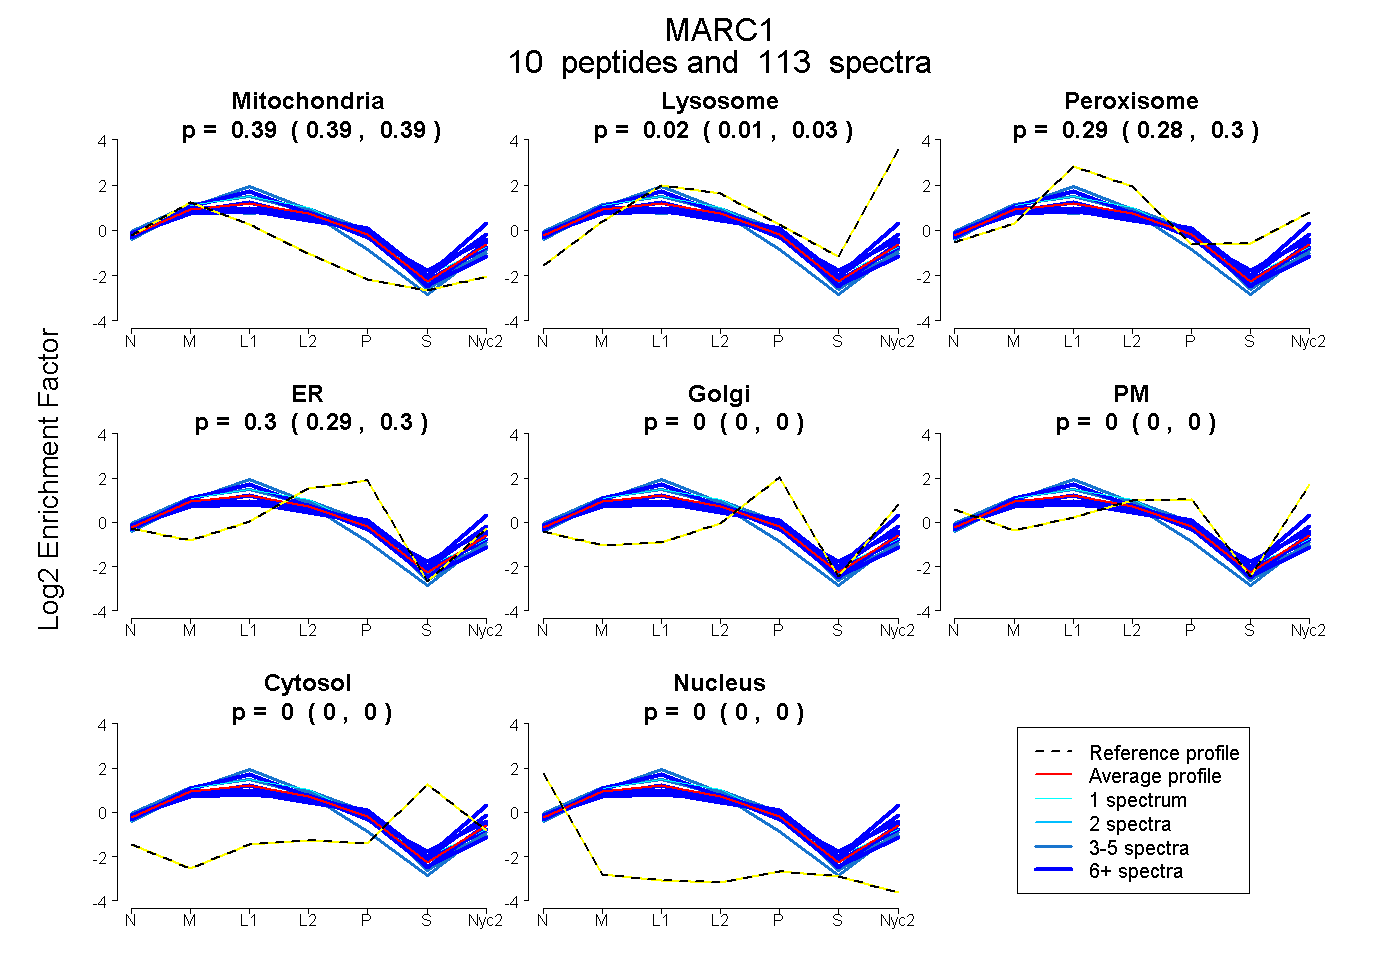
| Expt A |
10 peptides |
113 spectra |
|
0.391 0.388 | 0.393 |
0.022 0.014 | 0.028 |
0.292 0.283 | 0.299 |
0.296 0.291 | 0.299 |
0.000 0.000 | 0.000 |
0.000 0.000 | 0.000 |
0.000 0.000 | 0.000 |
0.000 0.000 | 0.000 |
| 7 spectra, LVHFEPHMHPR | 0.379 | 0.108 | 0.156 | 0.231 | 0.000 | 0.126 | 0.000 | 0.000 | ||
| 21 spectra, GVSVTEAECTAMGLR | 0.436 | 0.000 | 0.333 | 0.231 | 0.000 | 0.000 | 0.000 | 0.000 | ||
| 7 spectra, FWLVVNEEGNMVTAR | 0.325 | 0.150 | 0.125 | 0.152 | 0.000 | 0.248 | 0.000 | 0.000 | ||
| 1 spectrum, LQQVGTVAQLWIYPIK | 0.363 | 0.000 | 0.403 | 0.234 | 0.000 | 0.000 | 0.000 | 0.000 | ||
| 4 spectra, DCGEDAAQWISGFLK | 0.377 | 0.000 | 0.406 | 0.217 | 0.000 | 0.000 | 0.000 | 0.000 | ||
| 7 spectra, LCEPSEQALCGK | 0.393 | 0.000 | 0.284 | 0.323 | 0.000 | 0.000 | 0.000 | 0.000 | ||
| 33 spectra, VMPCTR | 0.414 | 0.094 | 0.145 | 0.347 | 0.000 | 0.000 | 0.000 | 0.000 | ||
| 3 spectra, EPLETLK | 0.493 | 0.000 | 0.323 | 0.180 | 0.000 | 0.004 | 0.000 | 0.000 | ||
| 25 spectra, VHGLEVQGR | 0.373 | 0.000 | 0.333 | 0.185 | 0.000 | 0.109 | 0.000 | 0.000 | ||
| 5 spectra, CLLTTVDPDTGIMDK | 0.401 | 0.000 | 0.179 | 0.420 | 0.000 | 0.000 | 0.000 | 0.000 |
| Plot | Mito | Lyso or Perox | ER | Golgi | PM | Cytosol | Nucleus | ||||||
| Expt B |
10 peptides |
31 spectra |
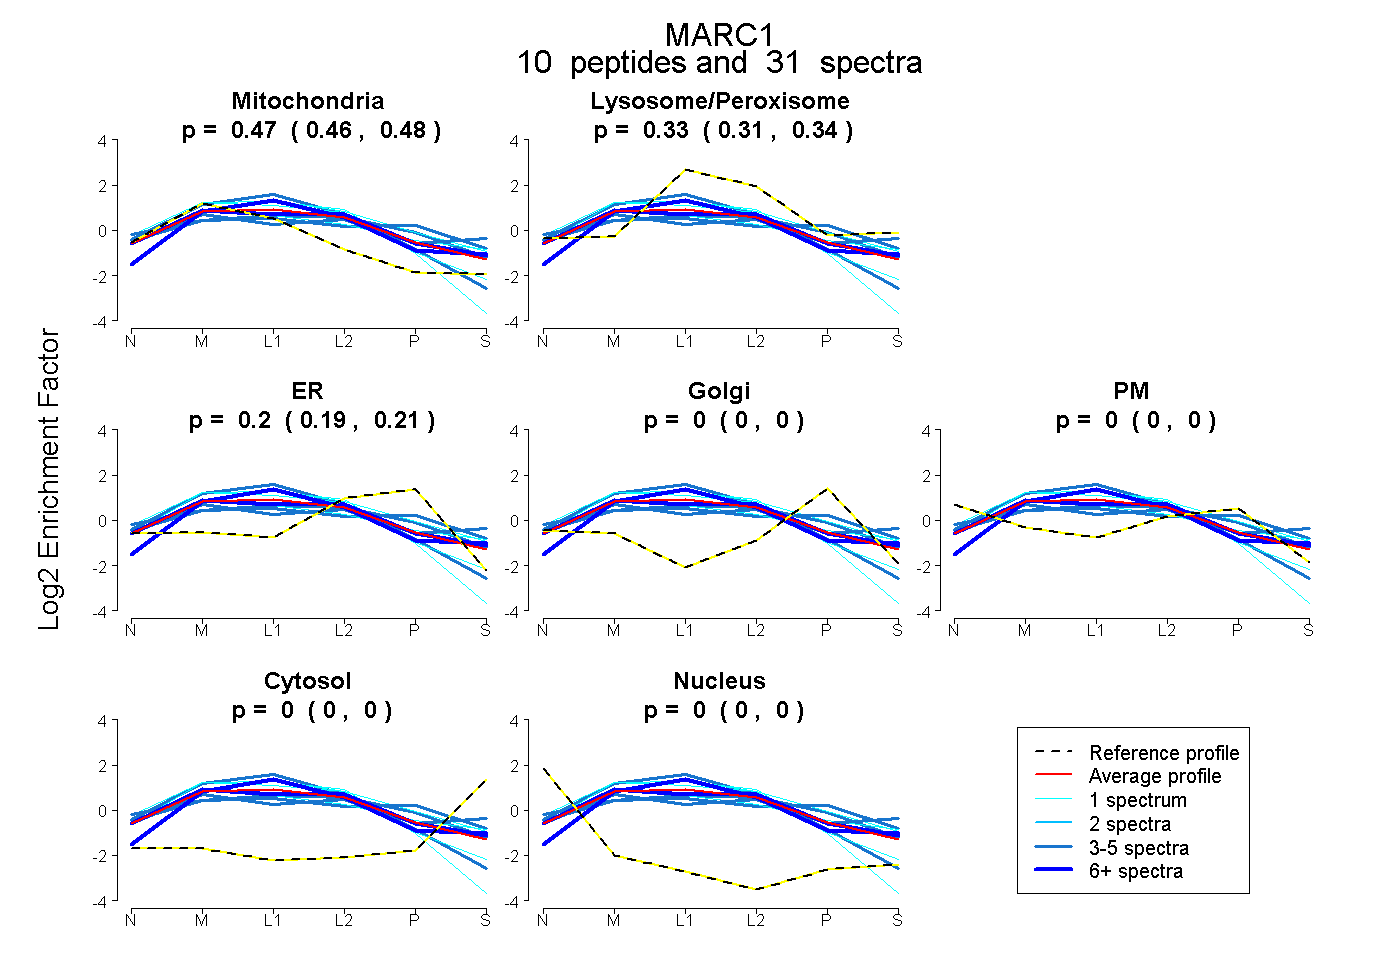 |
0.473 0.463 | 0.481 |
0.326 0.312 | 0.339 |
0.201 0.186 | 0.212 |
0.000 0.000 | 0.000 |
0.000 0.000 | 0.000 |
0.000 0.000 | 0.000 |
0.000 0.000 | 0.000 |
|||
| Plot | Lyso | Other | |||||||||||
| Expt C |
13 peptides |
158 spectra |
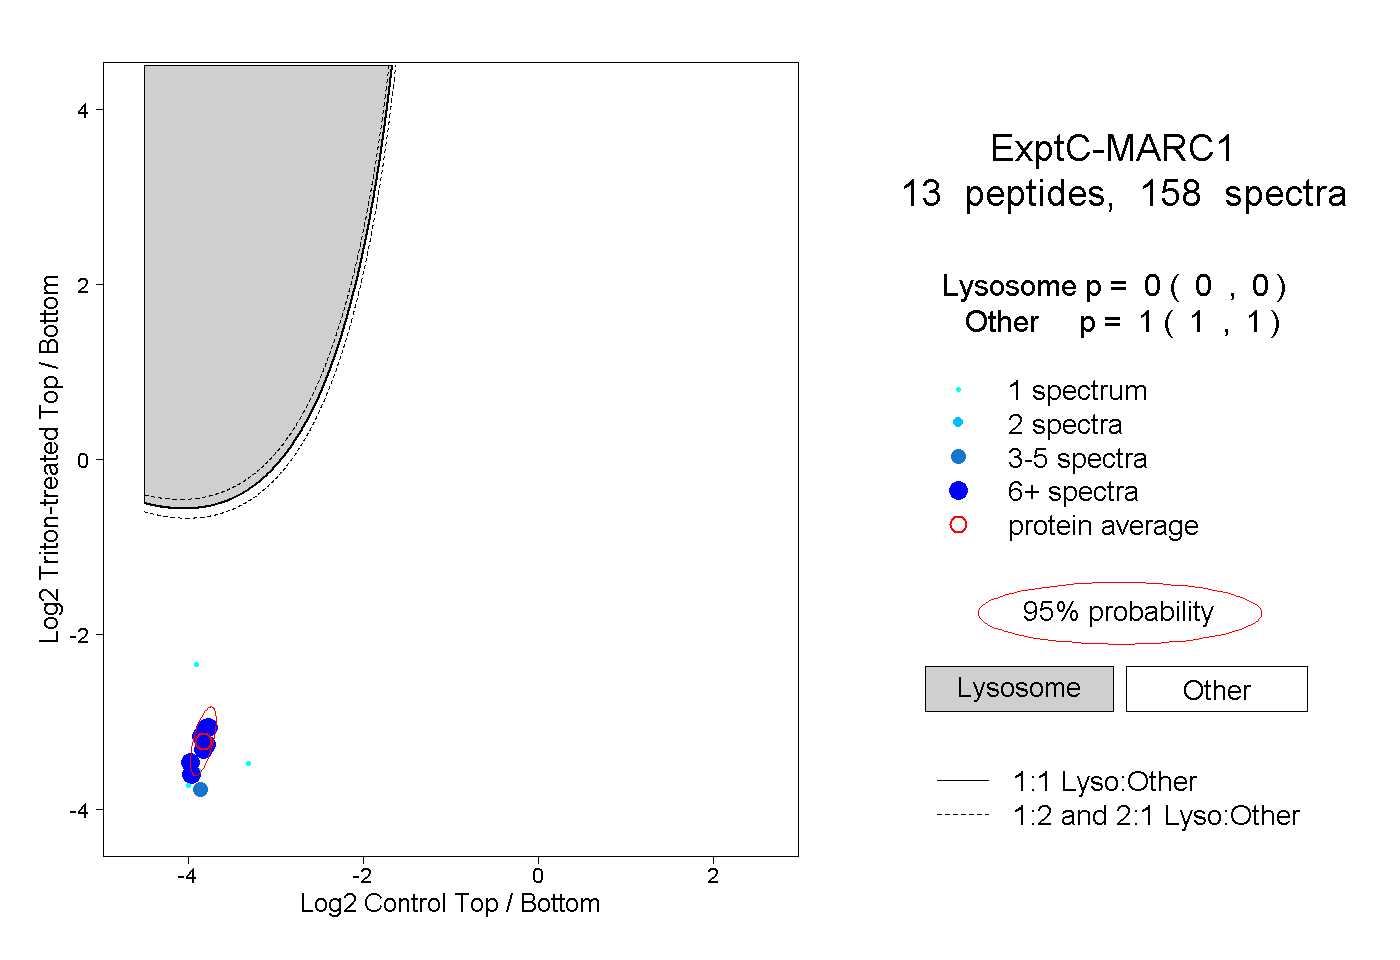 |
0.000 0.000 | 0.000 |
1.000 1.000 | 1.000 |
||||||||
| Plot | Lyso | Other | |||||||||||
| Expt D |
7 peptides |
13 spectra |
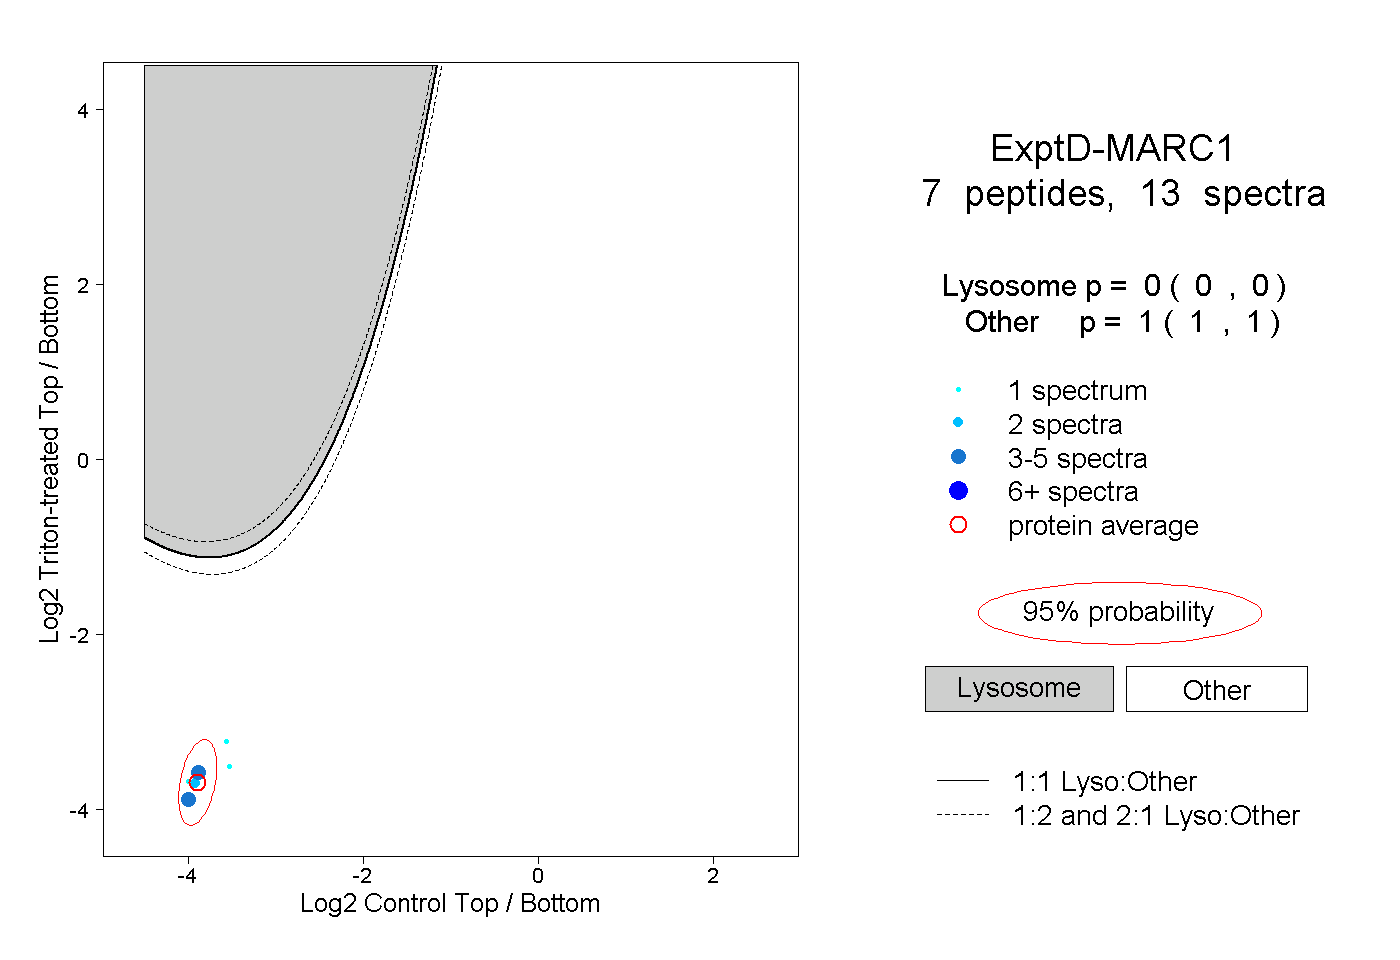 |
0.000 0.000 | 0.000 |
1.000 1.000 | 1.000 |