 4
4peptides
spectra
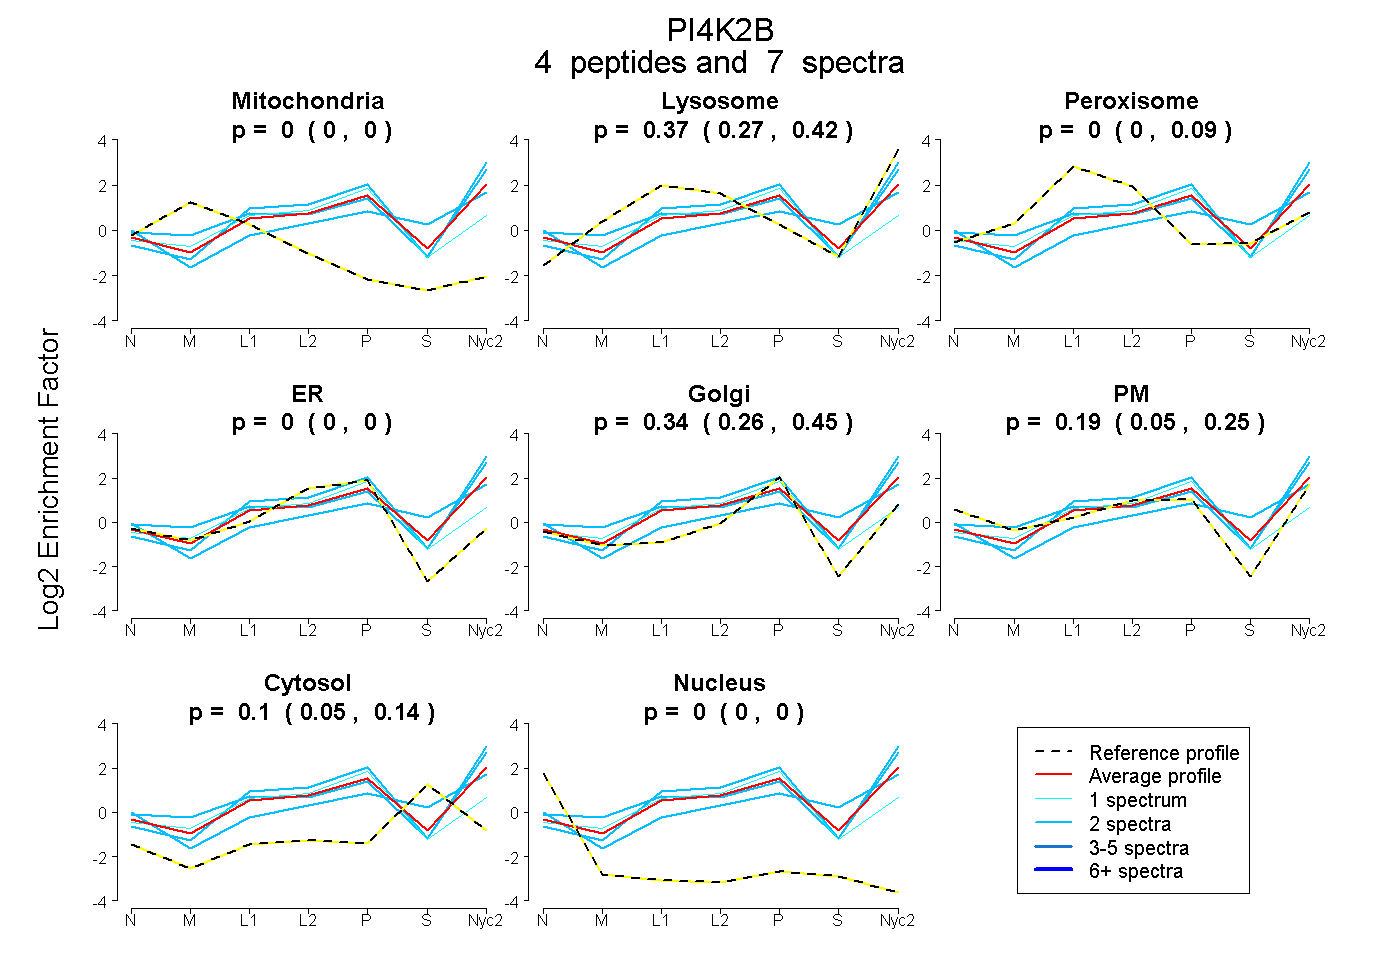
0.000 | 0.000
0.268 | 0.421
0.000 | 0.094
0.000 | 0.000
0.256 | 0.448
0.049 | 0.252
0.052 | 0.135
0.000 | 0.000
2peptides
spectra
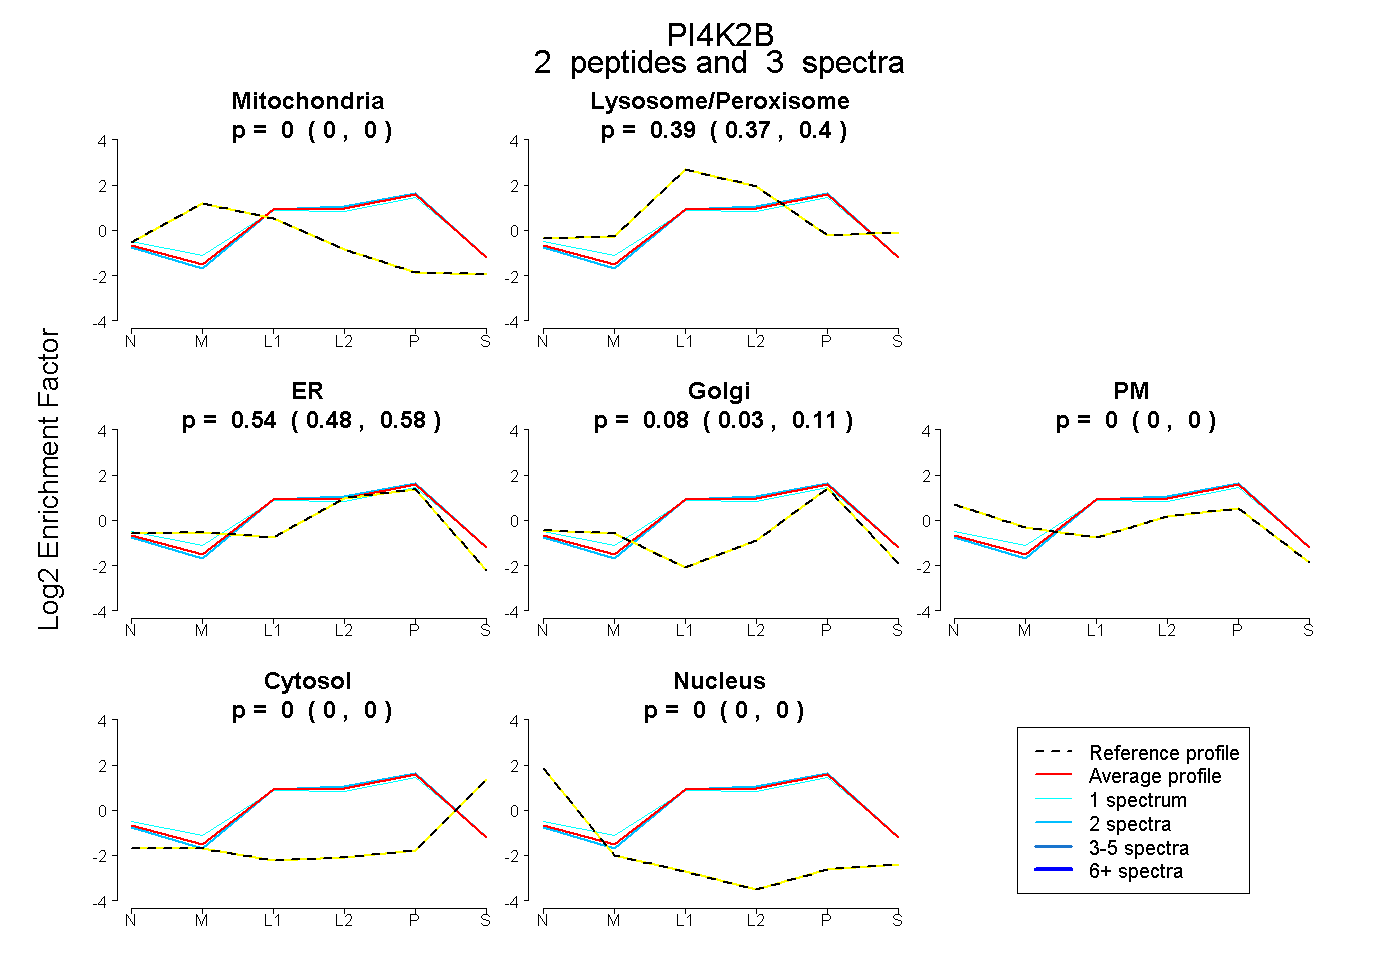
0.000 | 0.000
0.374 | 0.397
0.484 | 0.581
0.033 | 0.110
0.000 | 0.000
0.000 | 0.000
0.000 | 0.000
12peptides
spectra
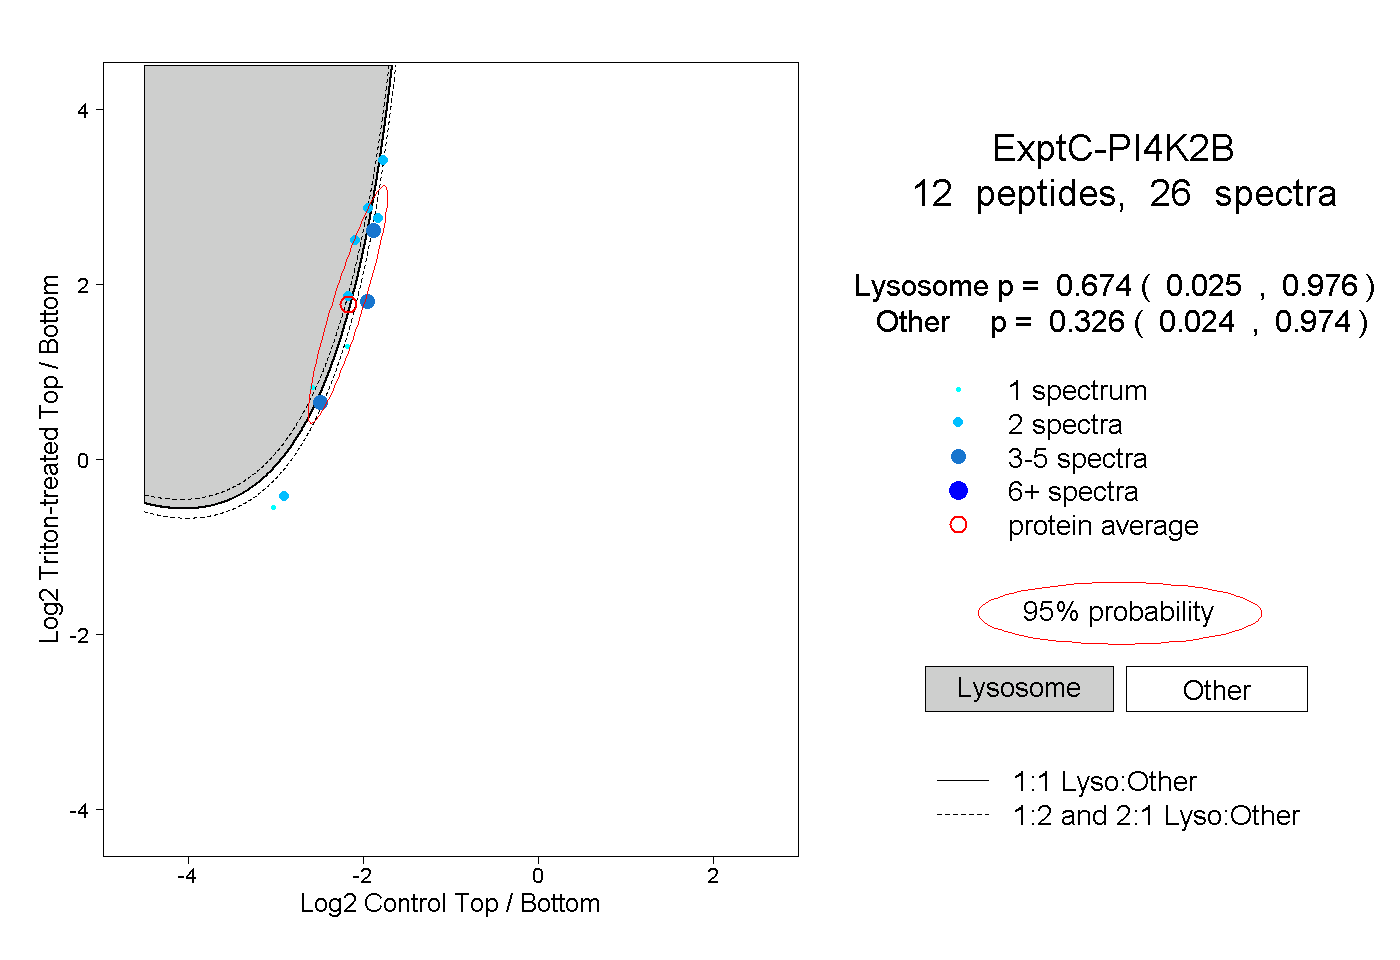
0.025 | 0.976
0.024 | 0.974
1peptide
spectra
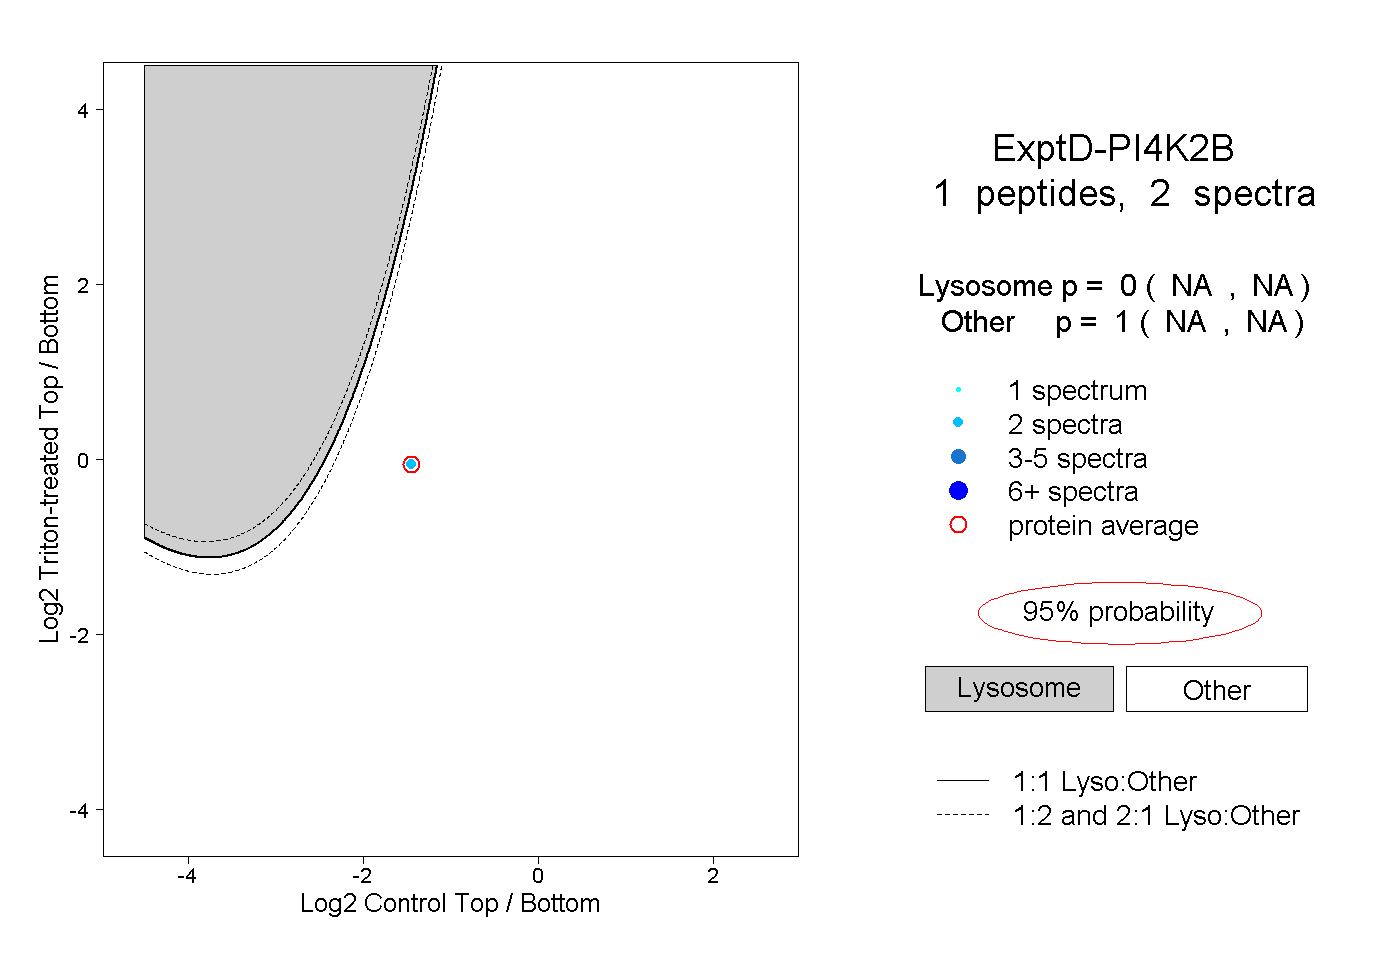
NA | NA
NA | NA