 4
4peptides
spectra
0.000 | 0.000
0.268 | 0.421
0.000 | 0.094
0.000 | 0.000
0.256 | 0.448
0.049 | 0.252
0.052 | 0.135
0.000 | 0.000
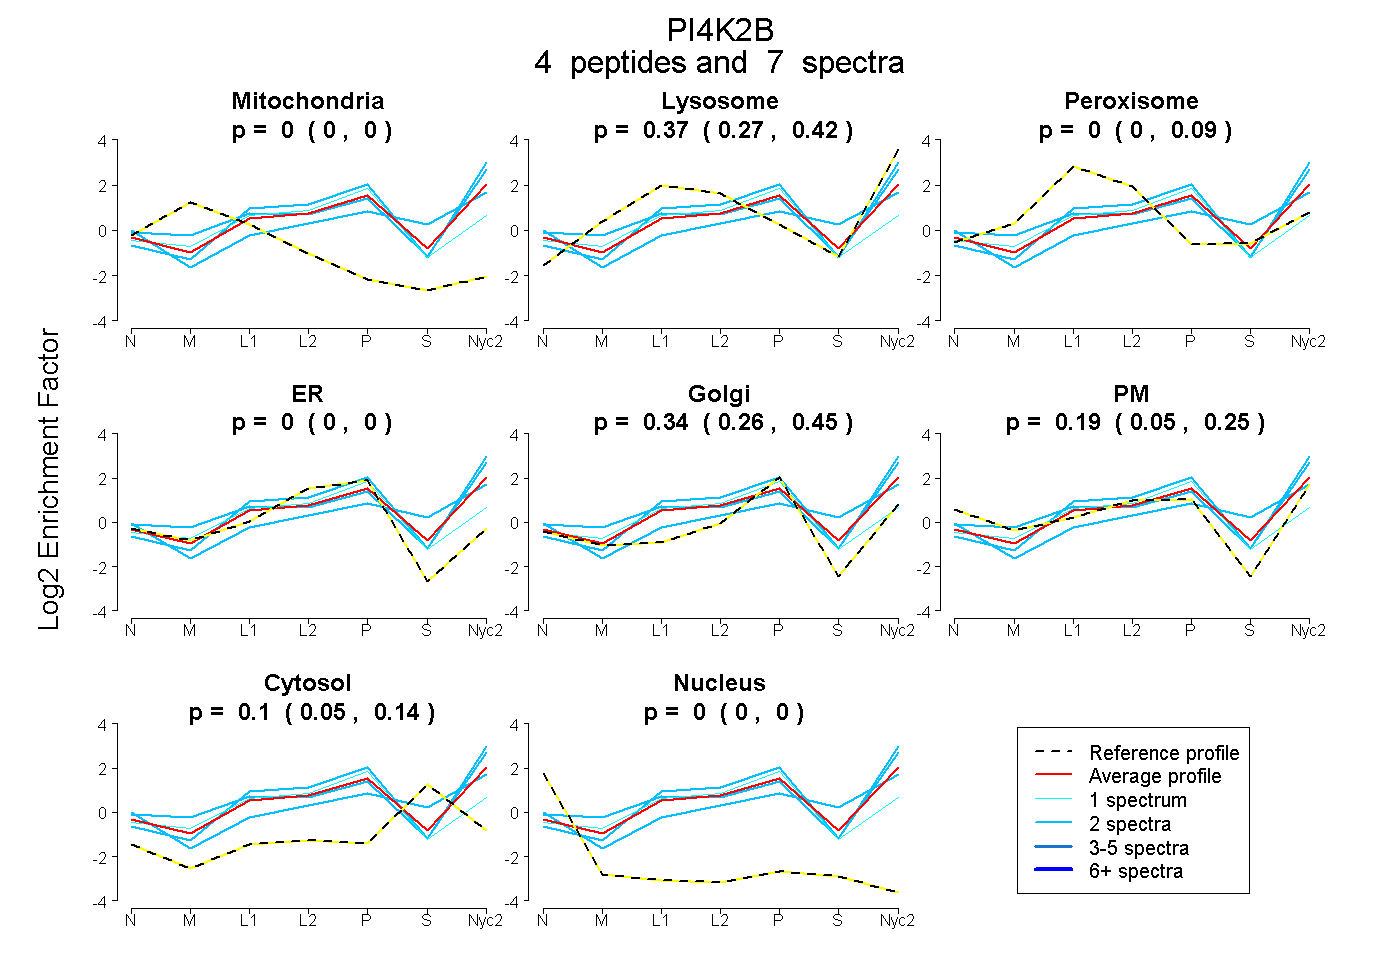
| Plot | Mito | Lyso | Perox | ER | Golgi | PM | Cytosol | Nucleus | |||||
| Expt A |
4 peptides |
7 spectra |
|
0.000 0.000 | 0.000 |
0.371 0.268 | 0.421 |
0.000 0.000 | 0.094 |
0.000 0.000 | 0.000 |
0.338 0.256 | 0.448 |
0.186 0.049 | 0.252 |
0.105 0.052 | 0.135 |
0.000 0.000 | 0.000 |
| 1 spectrum, VCCPCCFGR | 0.000 | 0.029 | 0.292 | 0.167 | 0.502 | 0.000 | 0.011 | 0.000 | ||
| 2 spectra, EAEYWLR | 0.000 | 0.436 | 0.000 | 0.000 | 0.222 | 0.333 | 0.010 | 0.000 | ||
| 2 spectra, HPDEWR | 0.000 | 0.200 | 0.000 | 0.000 | 0.052 | 0.367 | 0.380 | 0.000 | ||
| 2 spectra, GQILNLTQALR | 0.000 | 0.555 | 0.000 | 0.000 | 0.445 | 0.000 | 0.000 | 0.000 |
| Plot | Mito | Lyso or Perox | ER | Golgi | PM | Cytosol | Nucleus | ||||||
| Expt B |
2 peptides |
3 spectra |
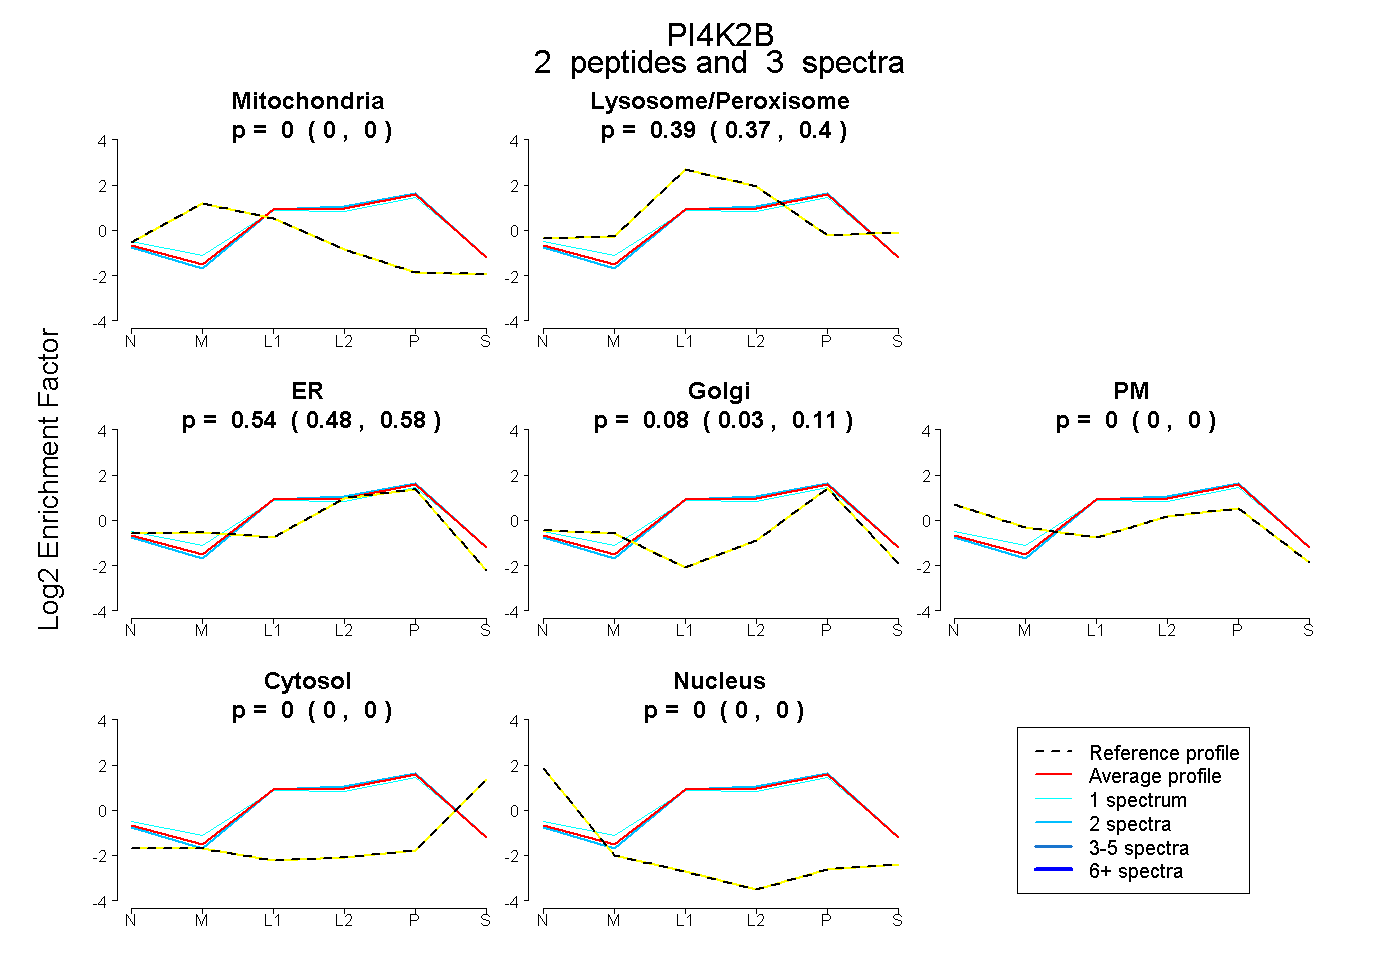 |
0.000 0.000 | 0.000 |
0.387 0.374 | 0.397 |
0.536 0.484 | 0.581 |
0.077 0.033 | 0.110 |
0.000 0.000 | 0.000 |
0.000 0.000 | 0.000 |
0.000 0.000 | 0.000 |
|||
| Plot | Lyso | Other | |||||||||||
| Expt C |
12 peptides |
26 spectra |
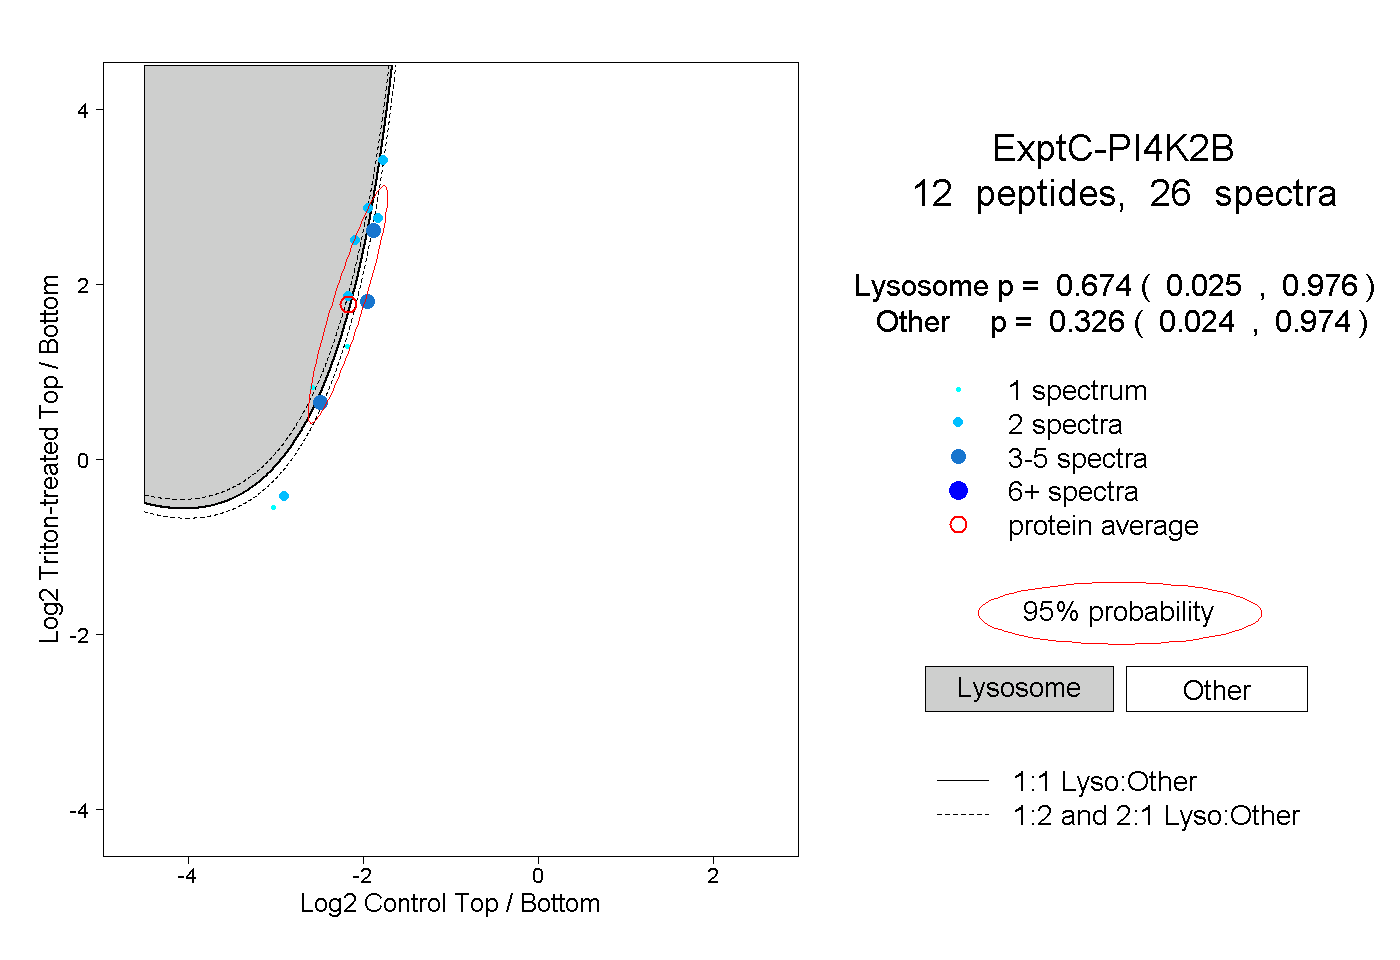 |
0.674 0.025 | 0.976 |
0.326 0.024 | 0.974 |
||||||||
| Plot | Lyso | Other | |||||||||||
| Expt D |
1 peptide |
2 spectra |
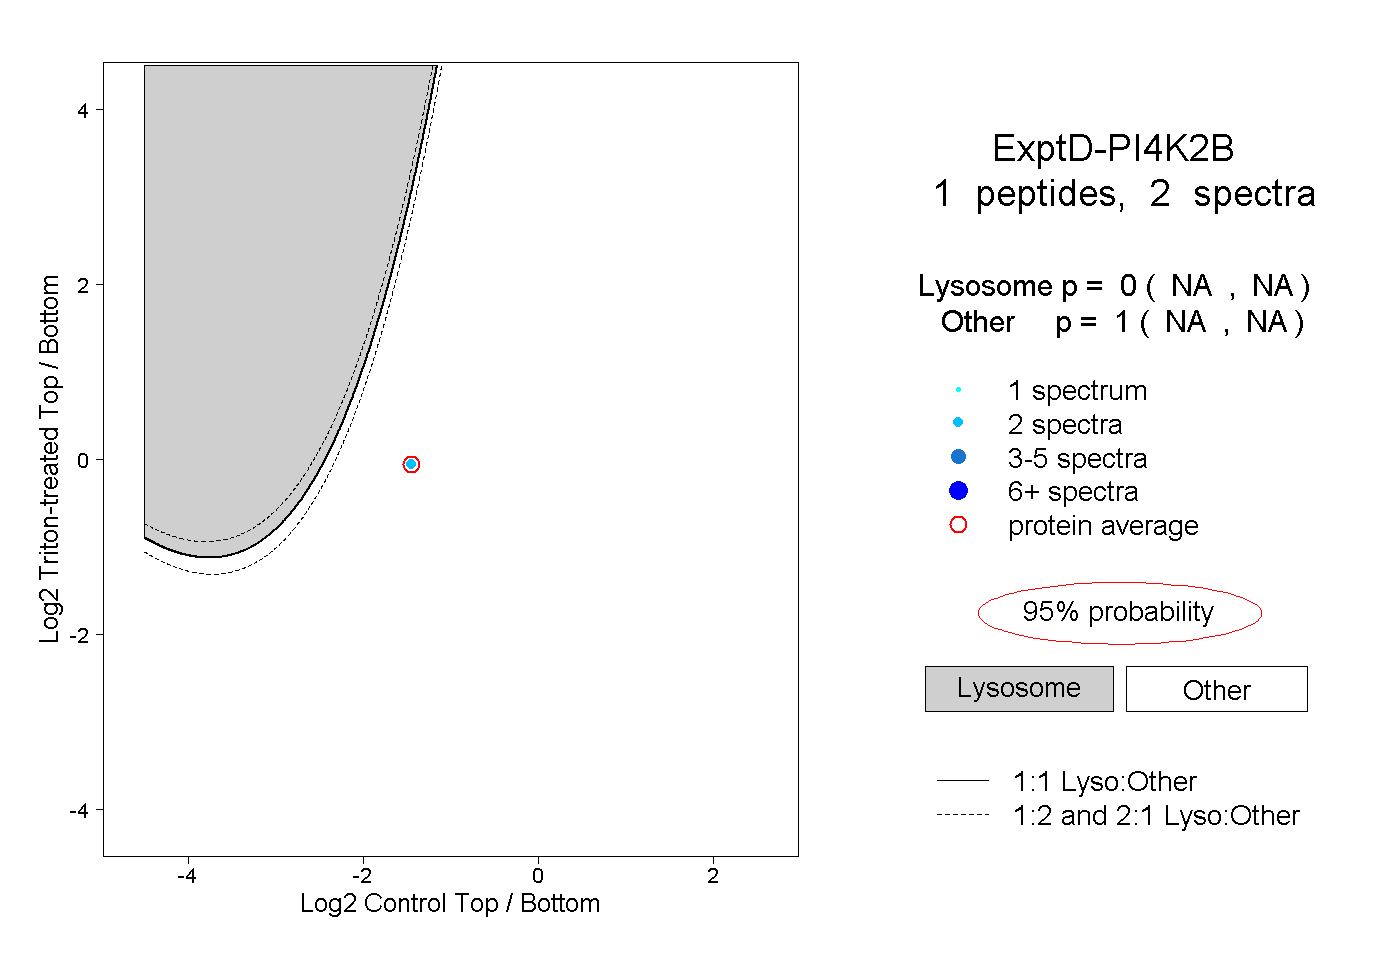 |
0.000 NA | NA |
1.000 NA | NA |