PI4K2B
[ENSRNOP00000005349]
Main page
| | | Plot |
Mito |
Lyso |
|
Perox |
ER |
Golgi |
PM |
Cytosol |
Nucleus |
|
| Expt A |
 4
4
peptides |
7
spectra |
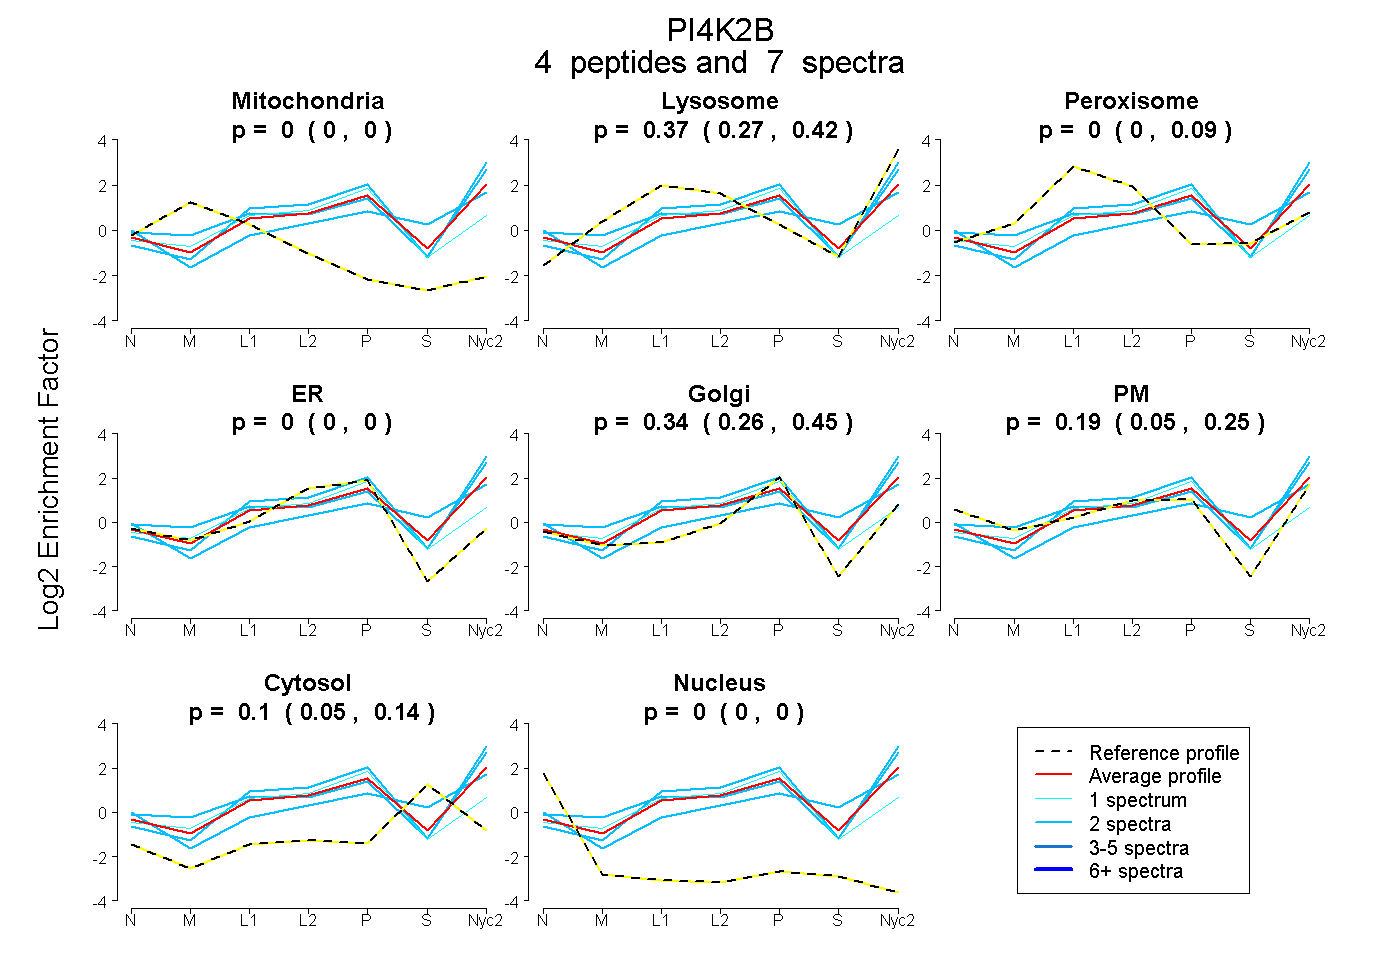 |
0.000
0.000 | 0.000 |
0.371
0.268 | 0.421 |
|
0.000
0.000 | 0.094 |
0.000
0.000 | 0.000 |
0.338
0.256 | 0.448 |
0.186
0.049 | 0.252 |
0.105
0.052 | 0.135 |
0.000
0.000 | 0.000 |
|
| | | Plot |
Mito |
|
Lyso or Perox |
|
ER |
Golgi |
PM |
Cytosol |
Nucleus |
|
| Expt B |
2
peptides |
3
spectra |
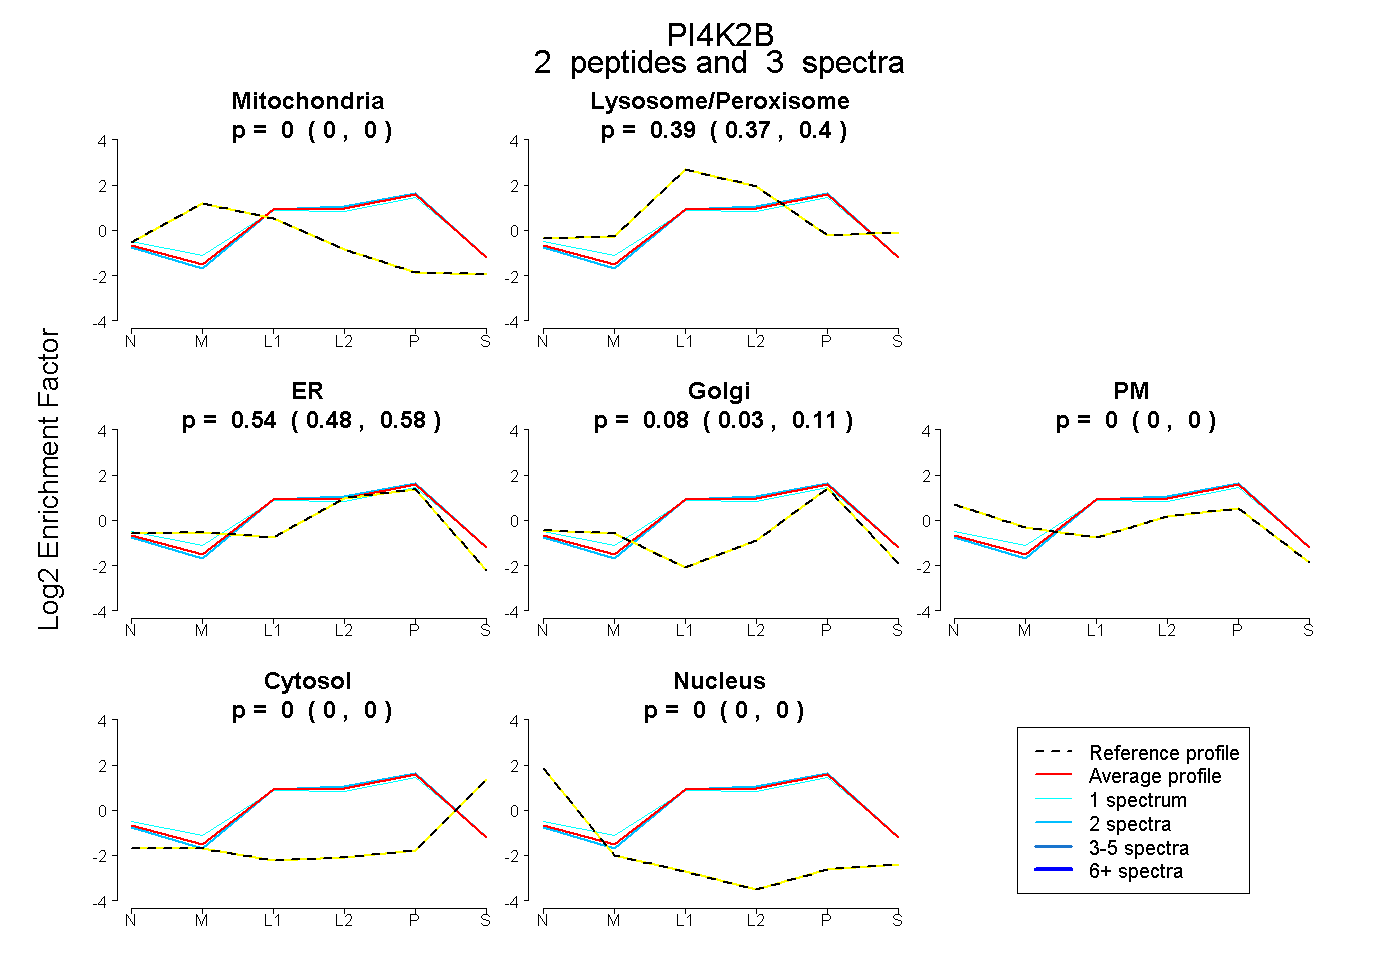 |
0.000
0.000 | 0.000 |
|
0.387
0.374 | 0.397 |
|
0.536
0.484 | 0.581 |
0.077
0.033 | 0.110 |
0.000
0.000 | 0.000 |
0.000
0.000 | 0.000 |
0.000
0.000 | 0.000 |
|
| | | Plot |
|
Lyso |
|
|
|
|
|
|
|
Other |
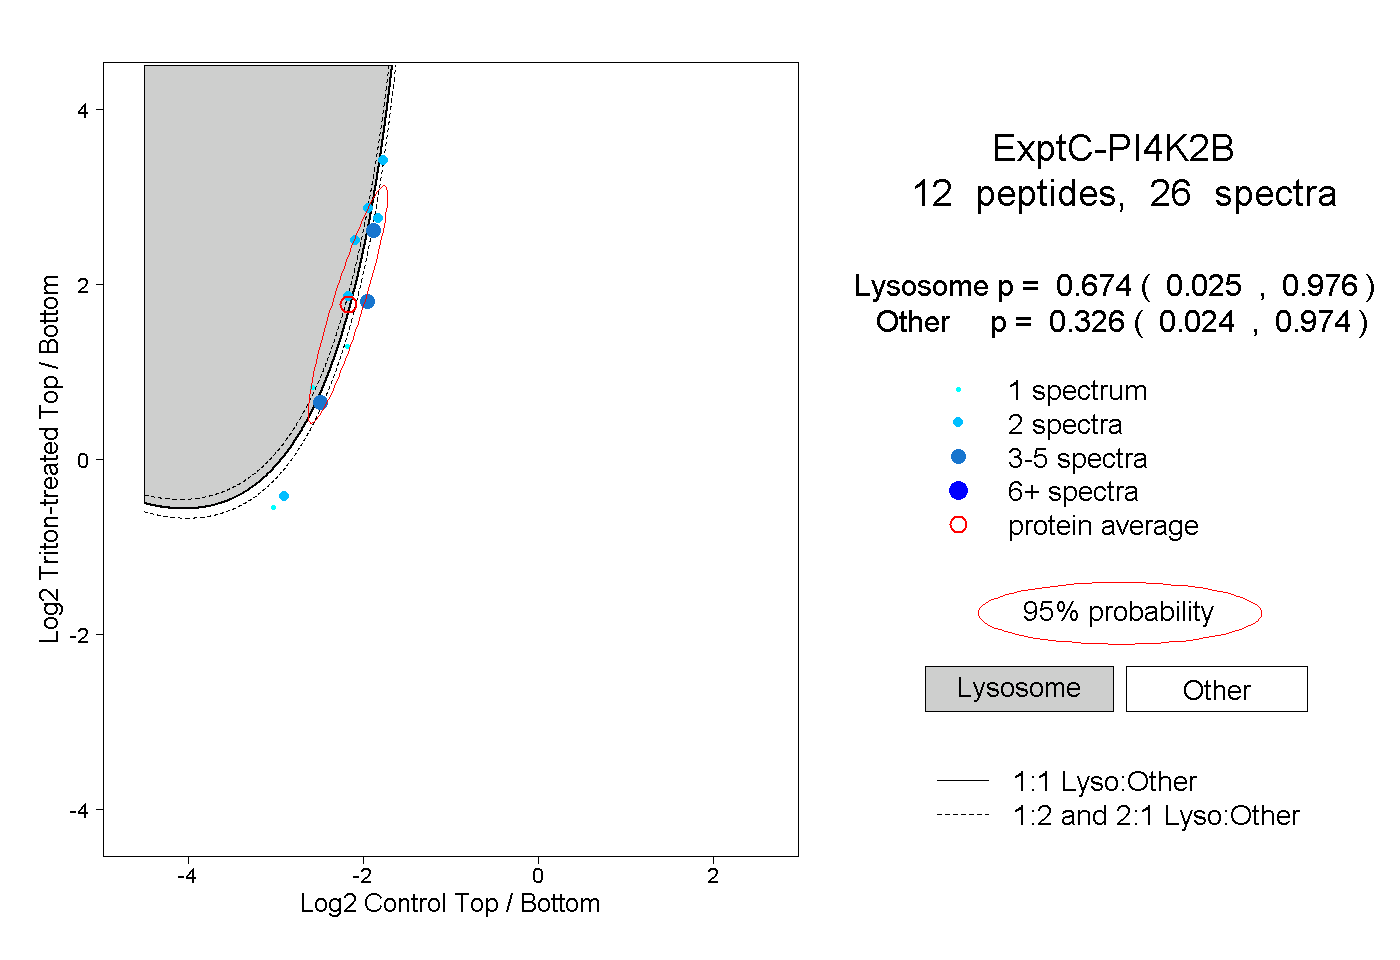
| Expt C |
12
peptides |
26
spectra |
 |
|
0.674
0.025 | 0.976 |
|
|
|
|
|
|
|
0.326
0.024 | 0.974 |
| 3 spectra, ISQGSSGSYFVK |
|
0.013 |
|
|
|
|
|
|
|
0.987 |
| 1 spectrum, VAWAQPR |
|
0.013 |
|
|
|
|
|
|
|
0.987 |
| 4 spectra, LQLGIVPK |
|
0.150 |
|
|
|
|
|
|
|
0.850 |
| 2 spectra, AYPFHWAWLPQAK |
|
0.013 |
|
|
|
|
|
|
|
0.987 |
| 2 spectra, QFQSQFER |
|
0.776 |
|
|
|
|
|
|
|
0.224 |
| 1 spectrum, LVILDYIIR |
|
0.899 |
|
|
|
|
|
|
|
0.101 |
| 2 spectra, FEAEPLPENIR |
|
0.959 |
|
|
|
|
|
|
|
0.041 |
| 2 spectra, EAEYWLR |
|
0.199 |
|
|
|
|
|
|
|
0.801 |
| 1 spectrum, IGSFQLFVK |
|
0.102 |
|
|
|
|
|
|
|
0.898 |
| 4 spectra, VPFSEETR |
|
0.297 |
|
|
|
|
|
|
|
0.703 |
| 2 spectra, SEEPYGQLNPK |
|
0.758 |
|
|
|
|
|
|
|
0.242 |
| 2 spectra, GQILNLTQALR |
|
0.051 |
|
|
|
|
|
|
|
0.949 |
| | | Plot |
|
Lyso |
|
|
|
|
|
|
|
Other |
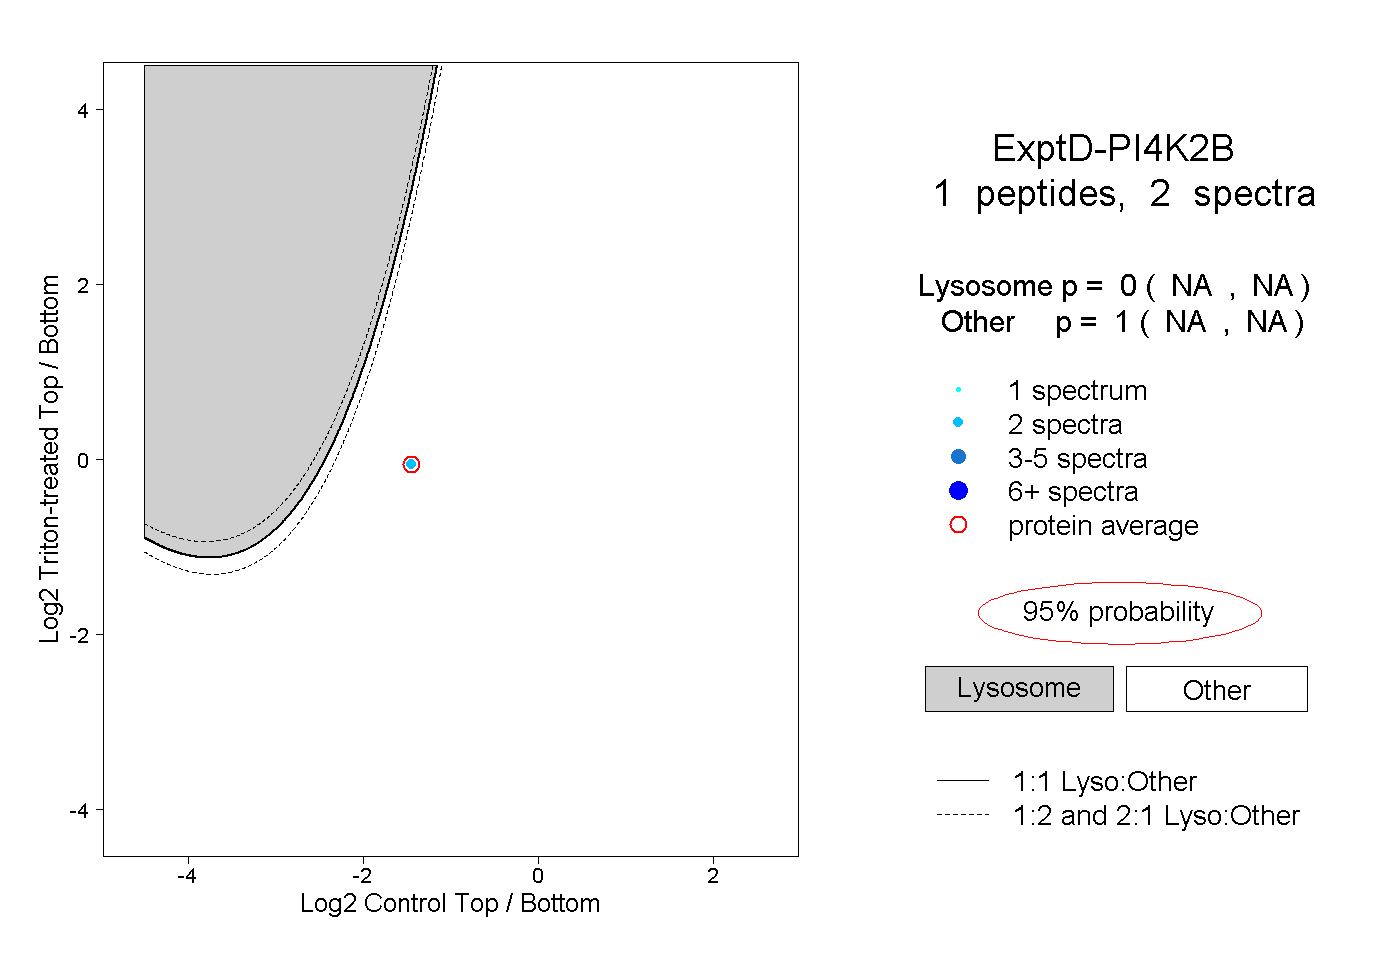
| Expt D |
1
peptide |
2
spectra |
 |
|
0.000
NA | NA |
|
|
|
|
|
|
|
1.000
NA | NA |