 5
5peptides
spectra
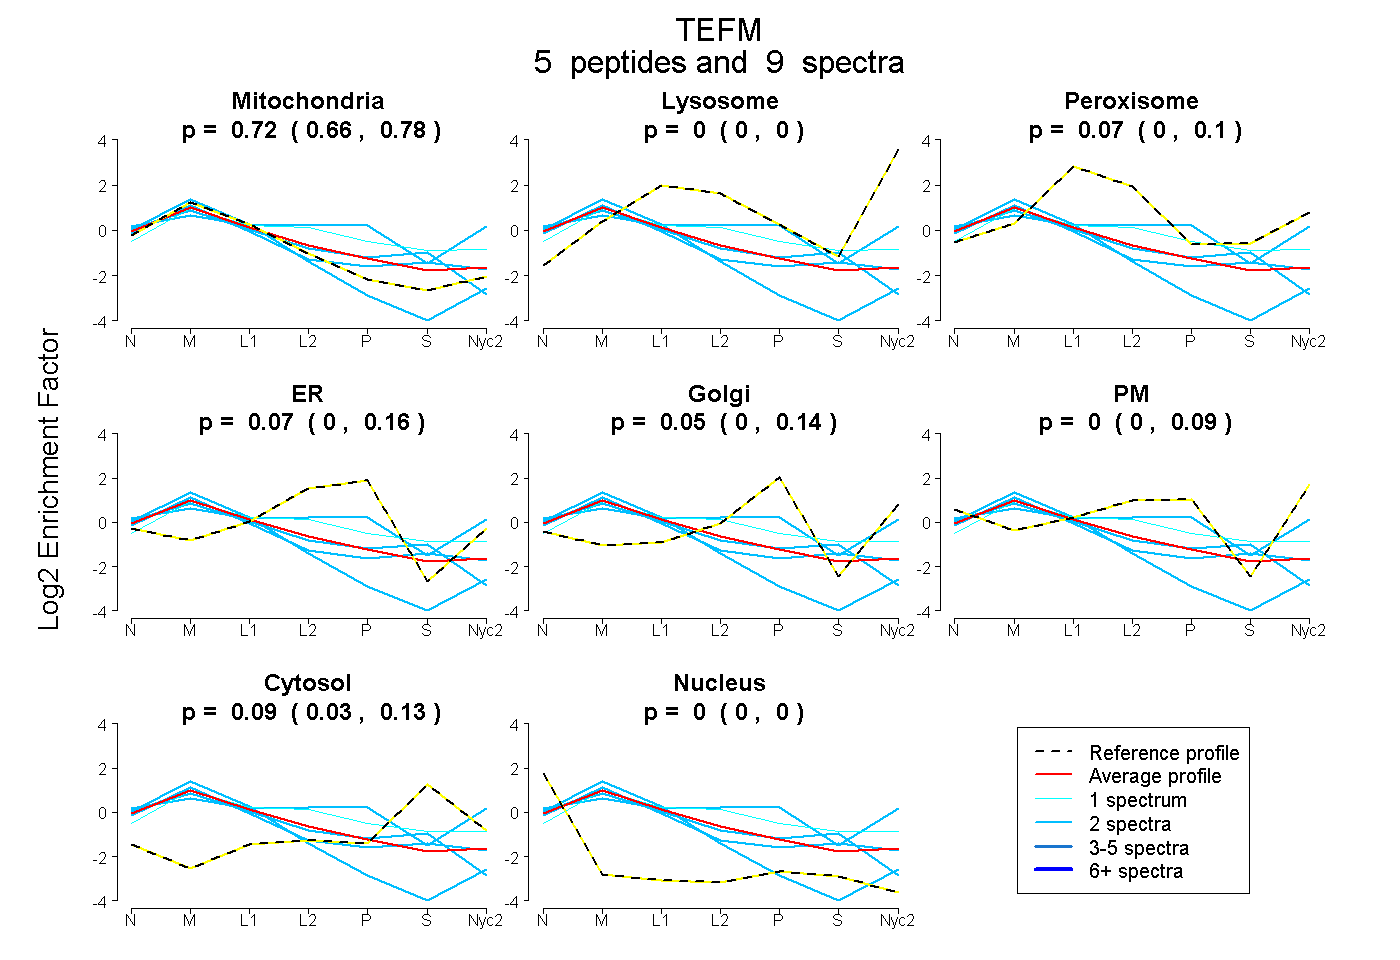
0.663 | 0.778
0.000 | 0.000
0.004 | 0.103
0.000 | 0.160
0.000 | 0.136
0.000 | 0.094
0.033 | 0.133
0.000 | 0.000
2peptides
spectra
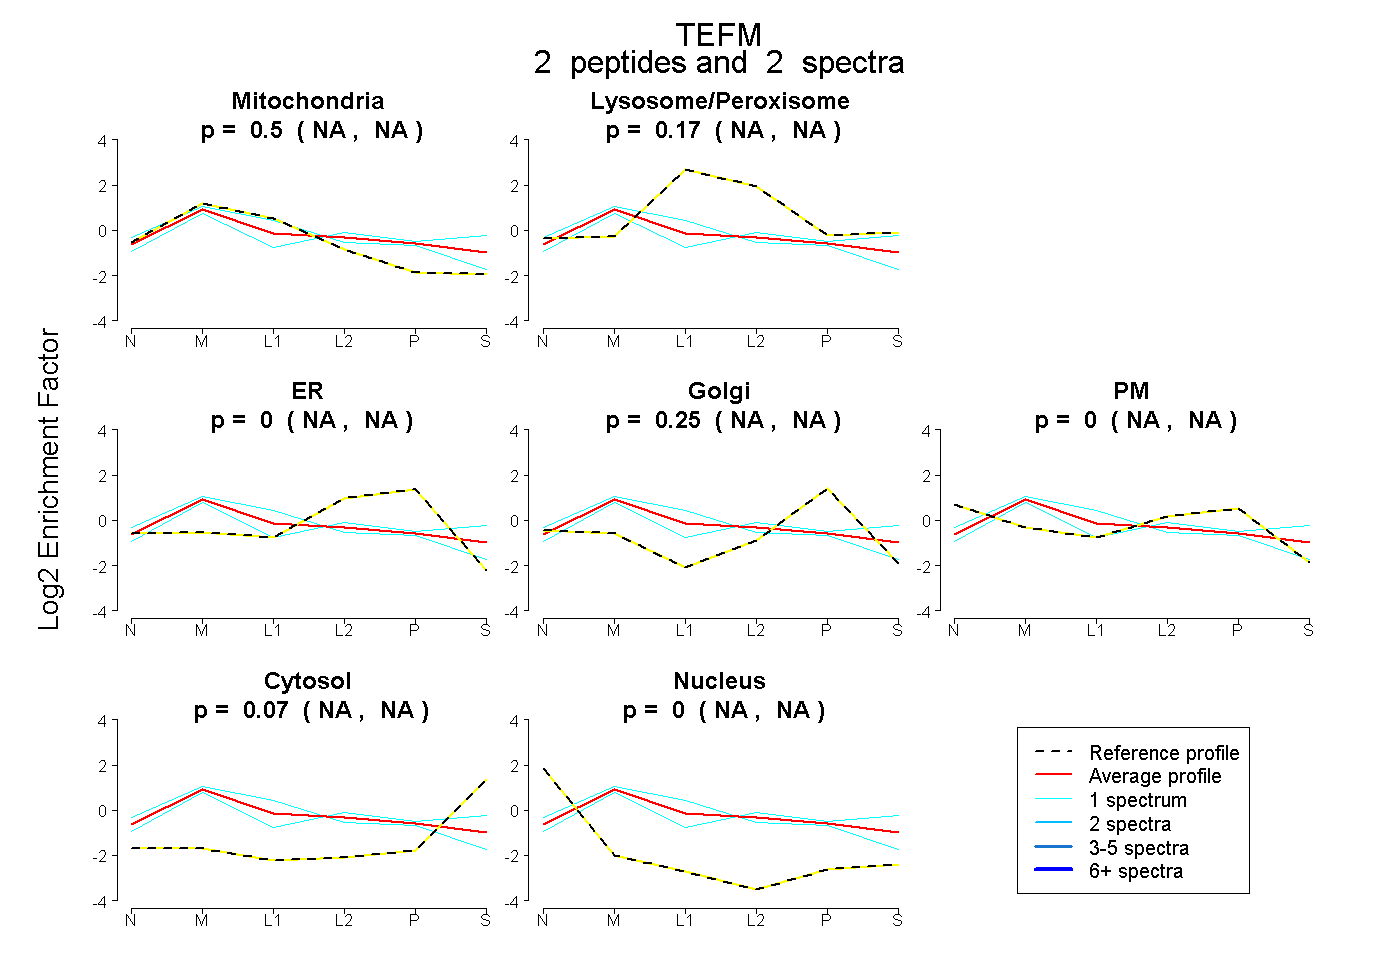
NA | NA
NA | NA
NA | NA
NA | NA
NA | NA
NA | NA
NA | NA
6peptides
spectra
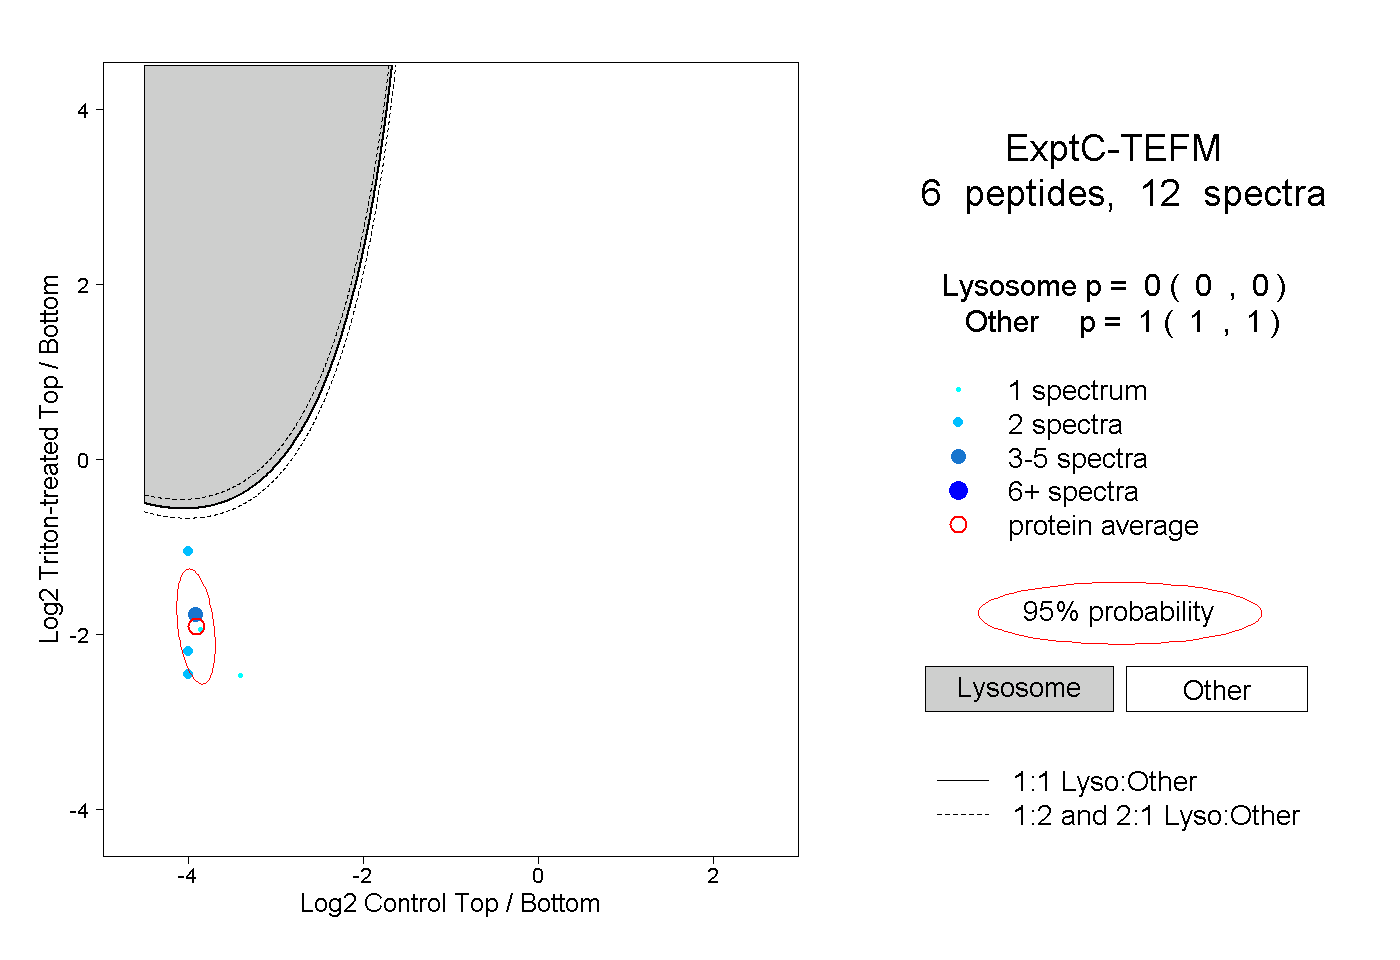
0.000 | 0.000
1.000 | 1.000
2peptides
spectra
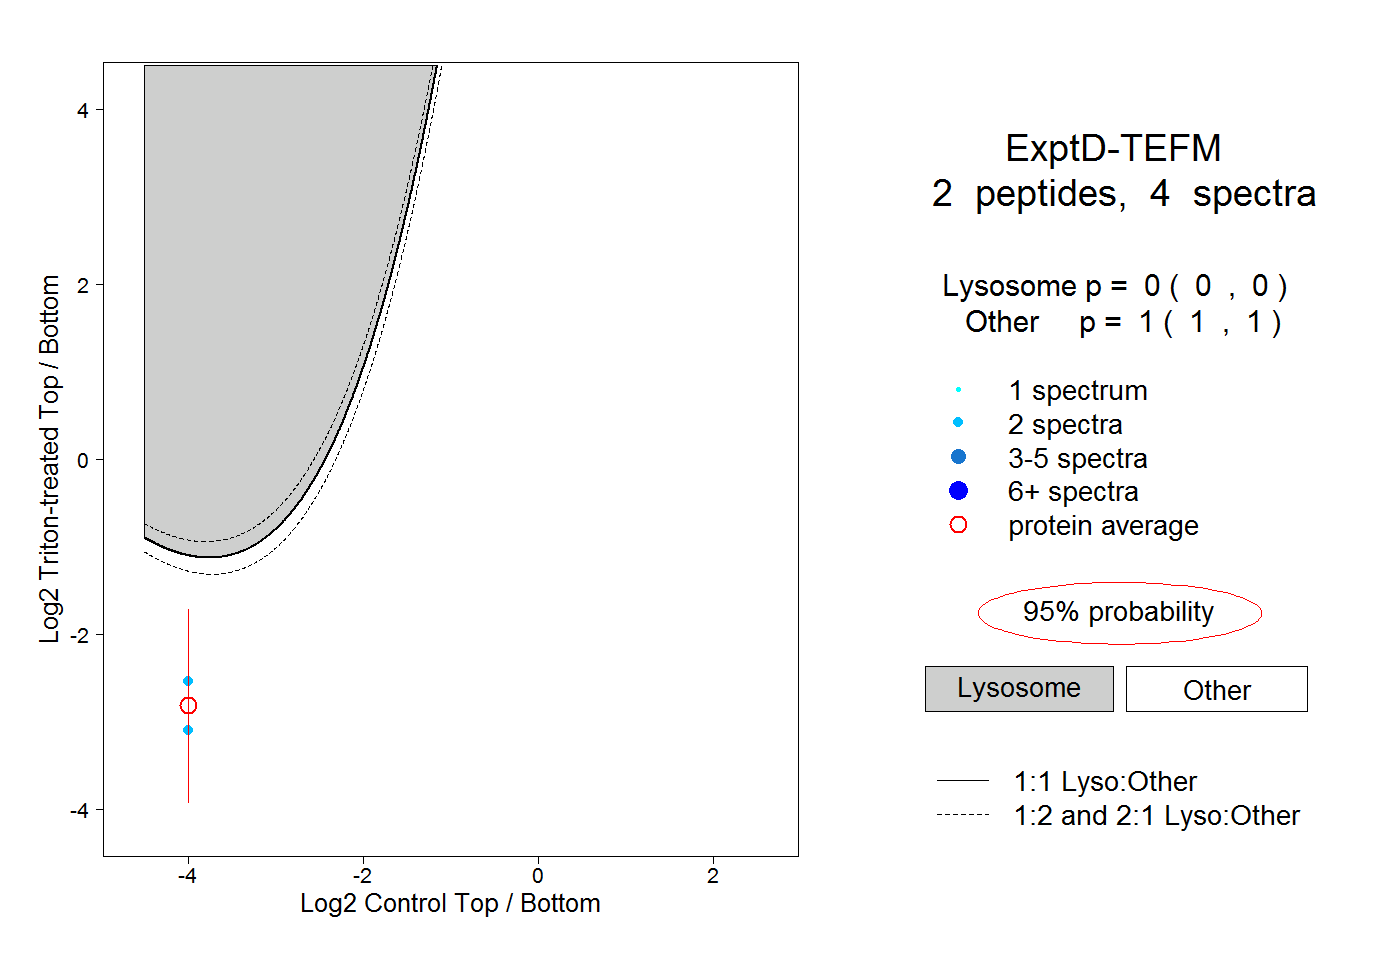
0.000 | 0.000
1.000 | 1.000