 5
5peptides
spectra
0.663 | 0.778
0.000 | 0.000
0.004 | 0.103
0.000 | 0.160
0.000 | 0.136
0.000 | 0.094
0.033 | 0.133
0.000 | 0.000
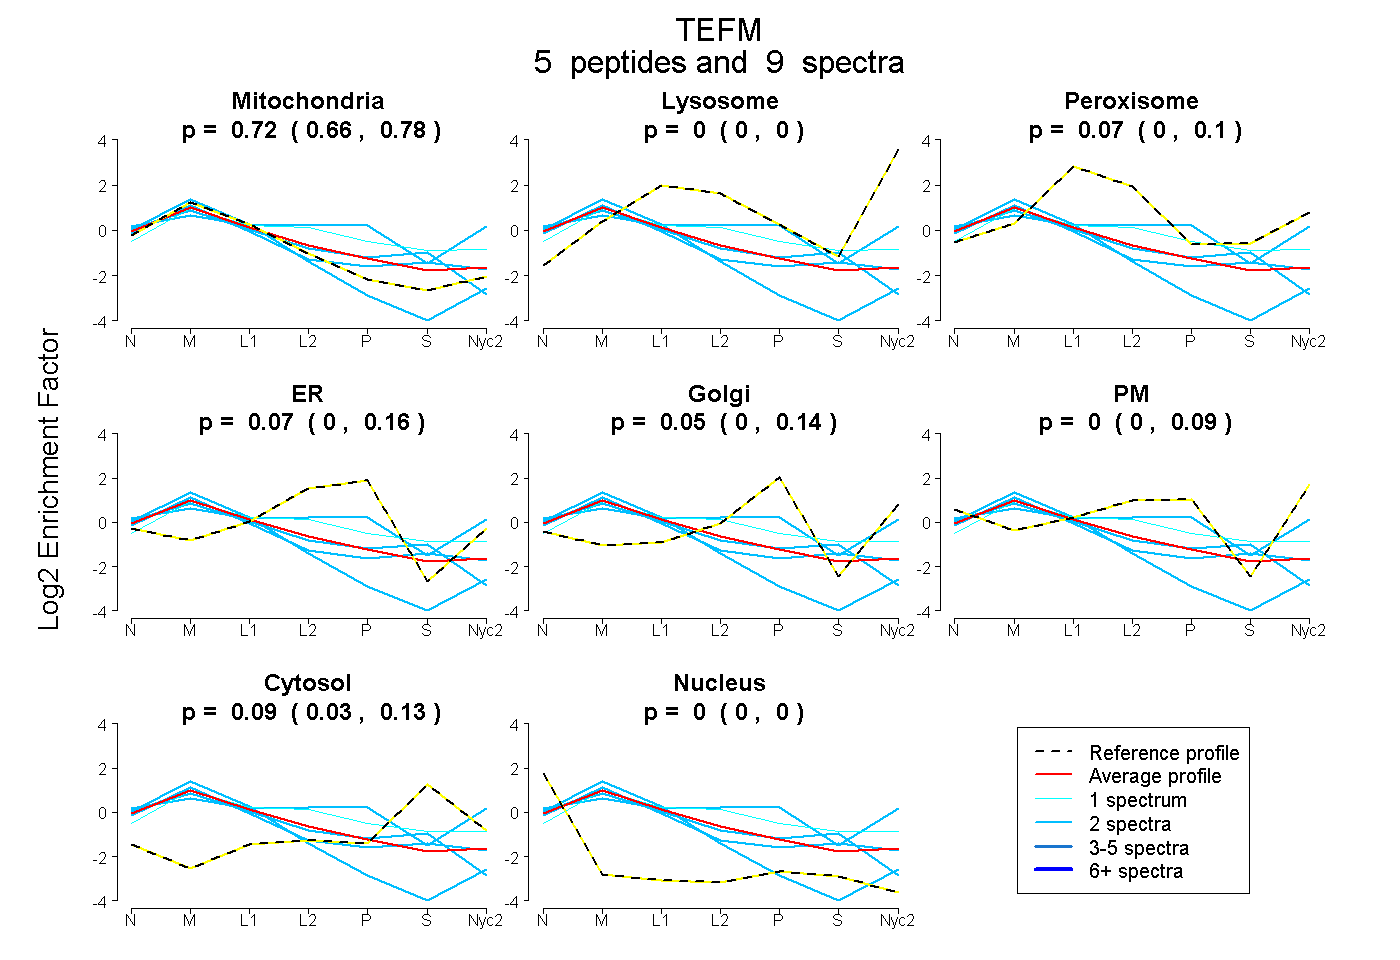
| Plot | Mito | Lyso | Perox | ER | Golgi | PM | Cytosol | Nucleus | |||||
| Expt A |
5 peptides |
9 spectra |
|
0.725 0.663 | 0.778 |
0.000 0.000 | 0.000 |
0.071 0.004 | 0.103 |
0.069 0.000 | 0.160 |
0.050 0.000 | 0.136 |
0.000 0.000 | 0.094 |
0.085 0.033 | 0.133 |
0.000 0.000 | 0.000 |
| 1 spectrum, TYPSSFYLEEISSVVSK | 0.419 | 0.000 | 0.274 | 0.069 | 0.100 | 0.000 | 0.138 | 0.000 | ||
| 2 spectra, IAWAHLDR | 0.937 | 0.000 | 0.000 | 0.000 | 0.000 | 0.000 | 0.000 | 0.063 | ||
| 2 spectra, VLSINR | 0.793 | 0.000 | 0.019 | 0.000 | 0.018 | 0.000 | 0.169 | 0.000 | ||
| 2 spectra, HFDLMIGDTR | 0.290 | 0.000 | 0.176 | 0.000 | 0.173 | 0.320 | 0.041 | 0.000 | ||
| 2 spectra, ADLYILEK | 0.754 | 0.000 | 0.000 | 0.048 | 0.000 | 0.000 | 0.199 | 0.000 |
| Plot | Mito | Lyso or Perox | ER | Golgi | PM | Cytosol | Nucleus | ||||||
| Expt B |
2 peptides |
2 spectra |
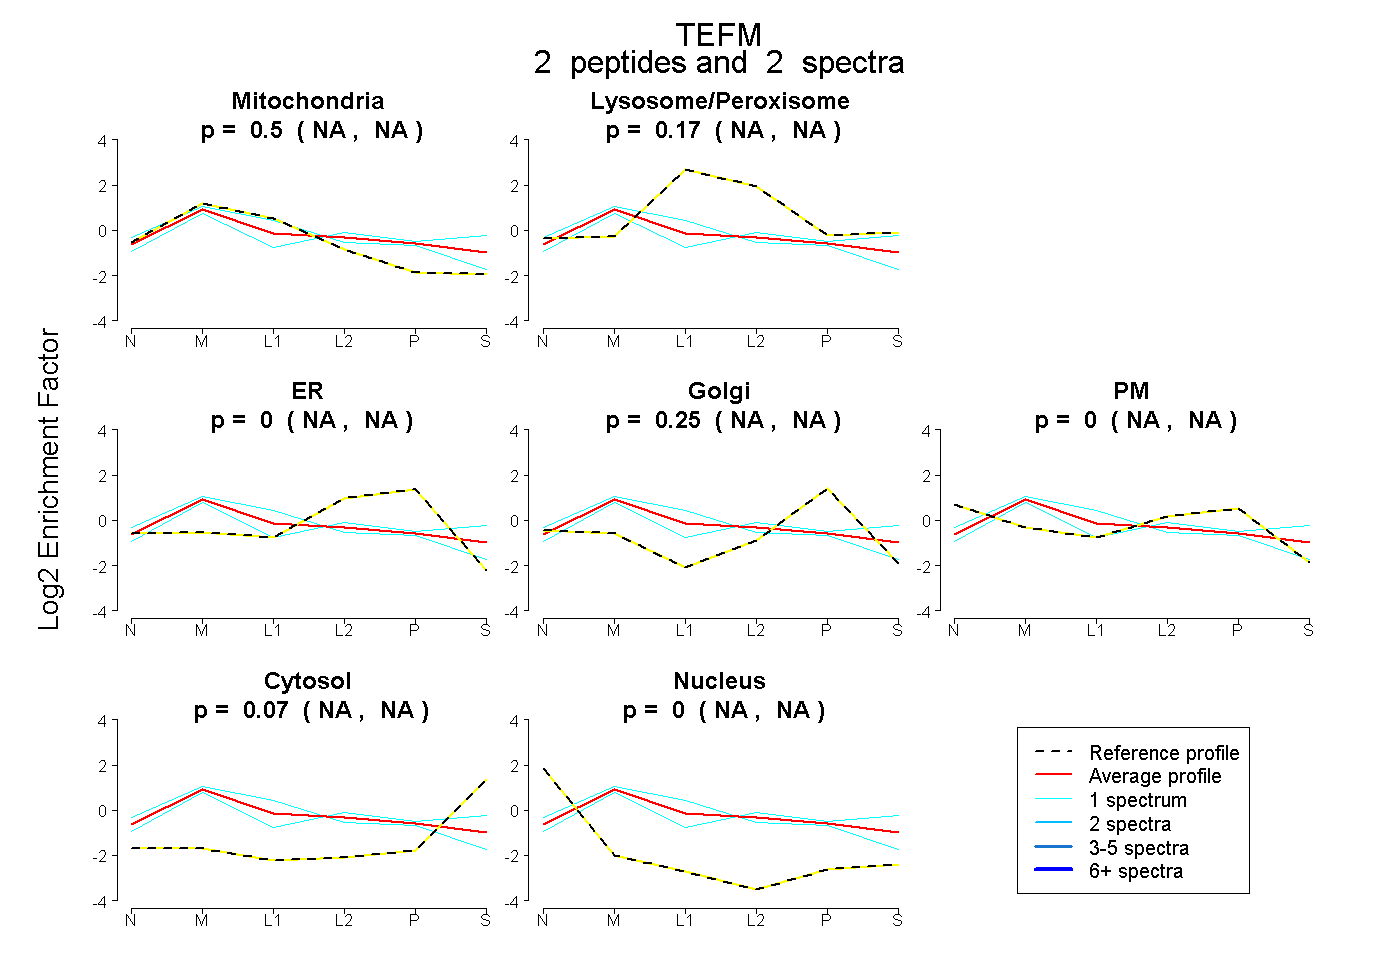 |
0.501 NA | NA |
0.174 NA | NA |
0.000 NA | NA |
0.250 NA | NA |
0.000 NA | NA |
0.074 NA | NA |
0.000 NA | NA |
|||
| Plot | Lyso | Other | |||||||||||
| Expt C |
6 peptides |
12 spectra |
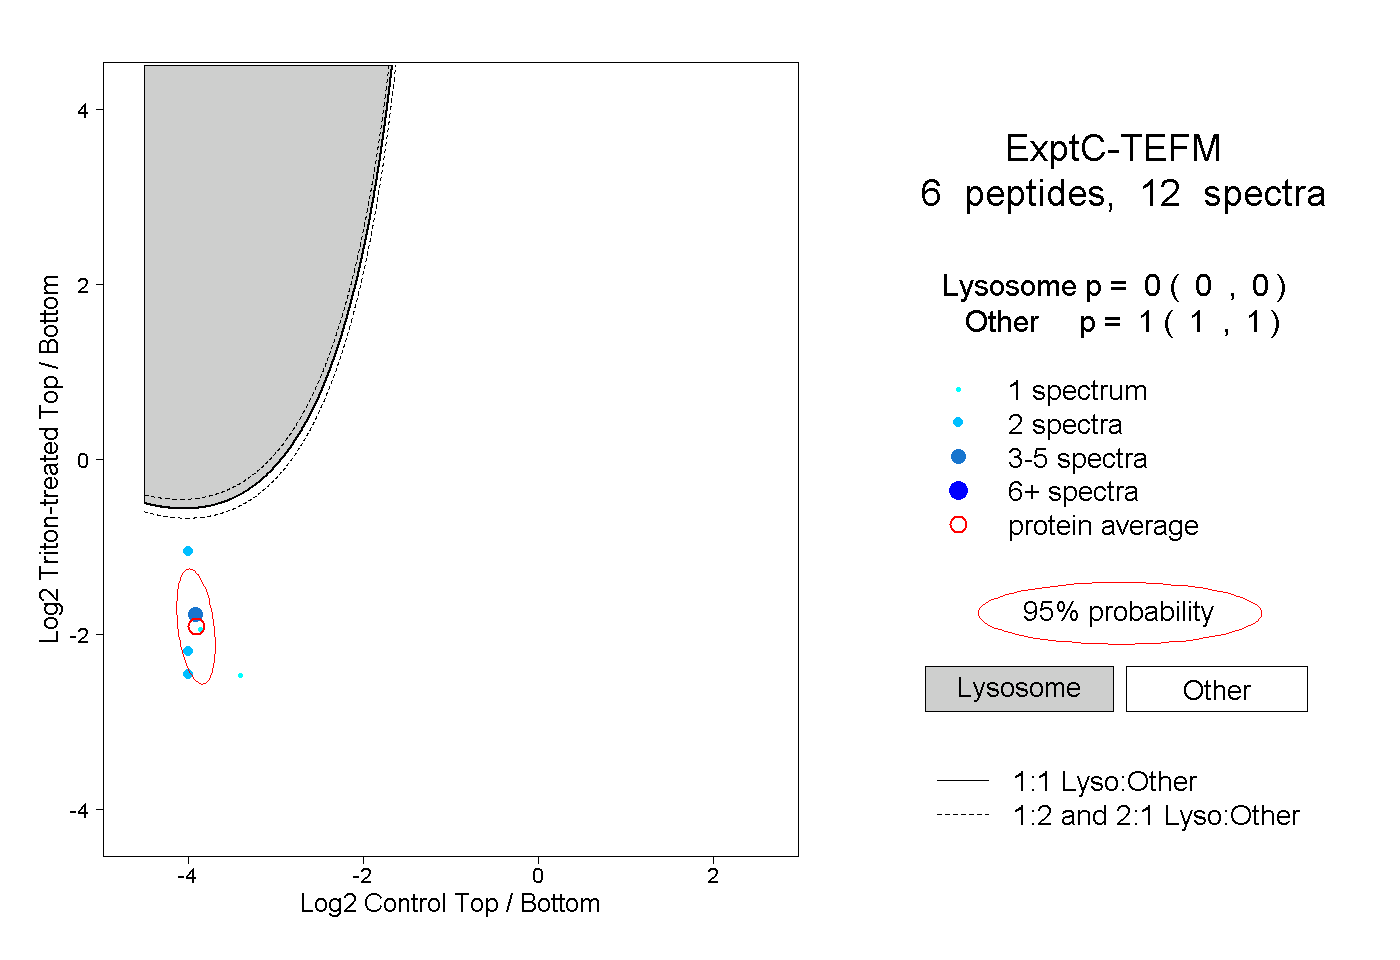 |
0.000 0.000 | 0.000 |
1.000 1.000 | 1.000 |
||||||||
| Plot | Lyso | Other | |||||||||||
| Expt D |
2 peptides |
4 spectra |
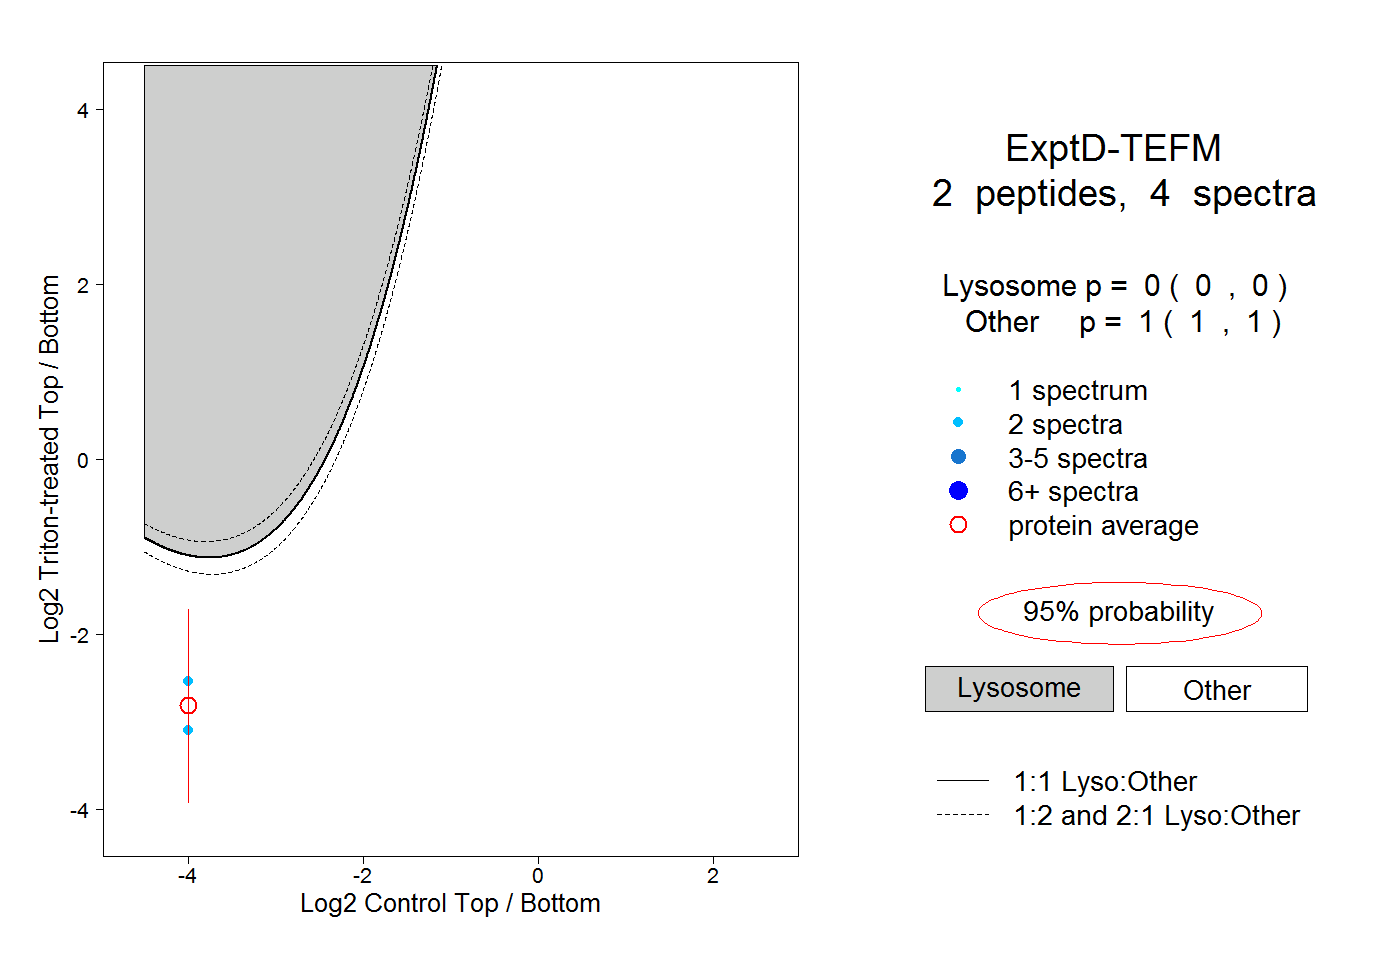 |
0.000 0.000 | 0.000 |
1.000 1.000 | 1.000 |