 5
5peptides
spectra
0.663 | 0.778
0.000 | 0.000
0.004 | 0.103
0.000 | 0.160
0.000 | 0.136
0.000 | 0.094
0.033 | 0.133
0.000 | 0.000
2peptides
spectra
NA | NA
NA | NA
NA | NA
NA | NA
NA | NA
NA | NA
NA | NA
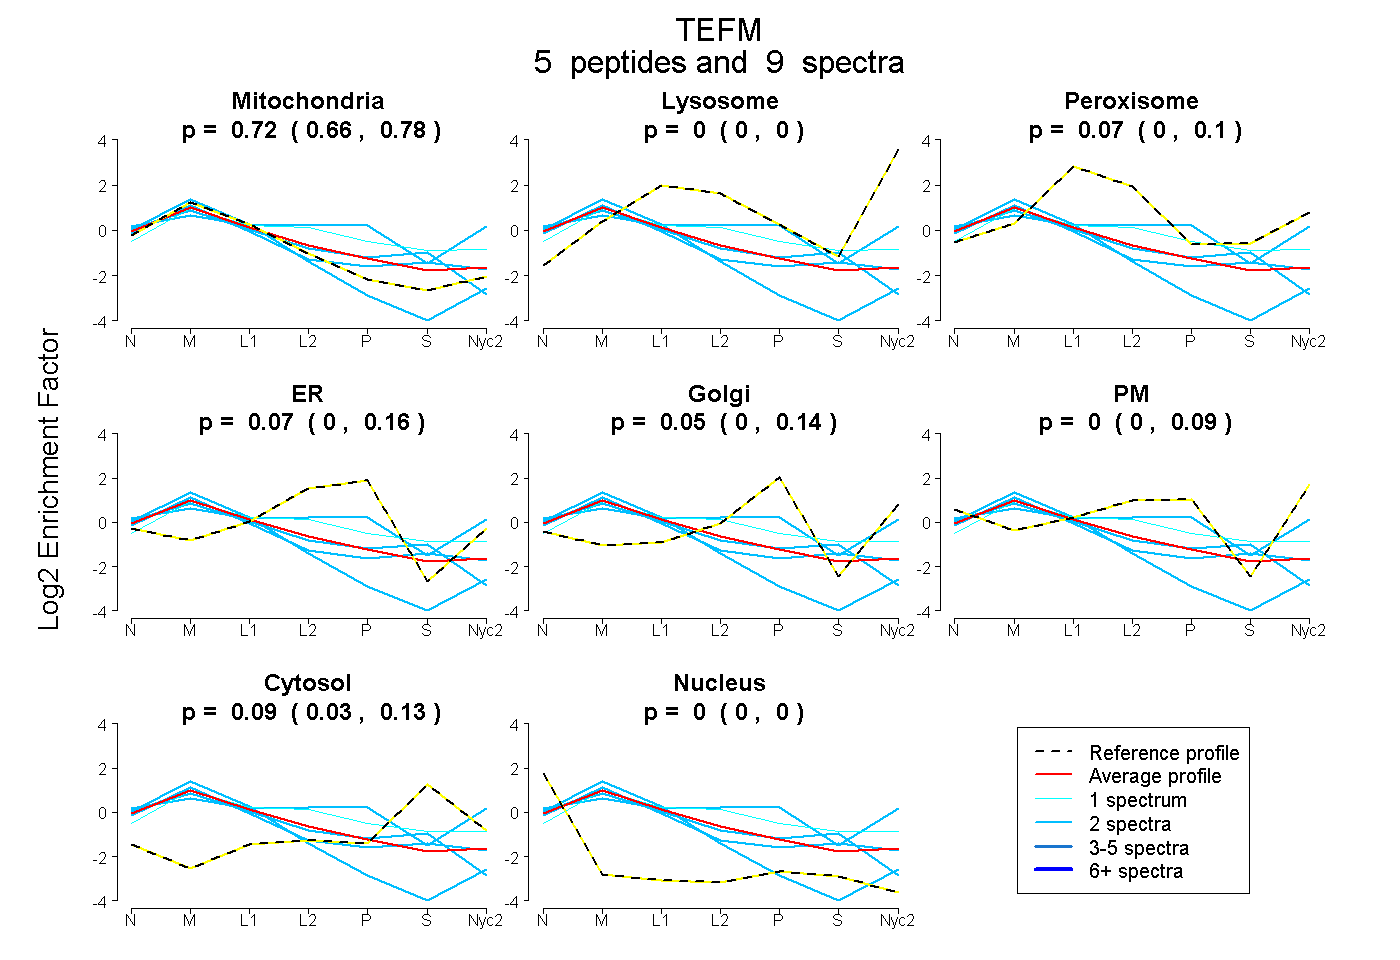
| Plot | Mito | Lyso | Perox | ER | Golgi | PM | Cytosol | Nucleus | |||||
| Expt A |
5 peptides |
9 spectra |
|
0.725 0.663 | 0.778 |
0.000 0.000 | 0.000 |
0.071 0.004 | 0.103 |
0.069 0.000 | 0.160 |
0.050 0.000 | 0.136 |
0.000 0.000 | 0.094 |
0.085 0.033 | 0.133 |
0.000 0.000 | 0.000 |
||
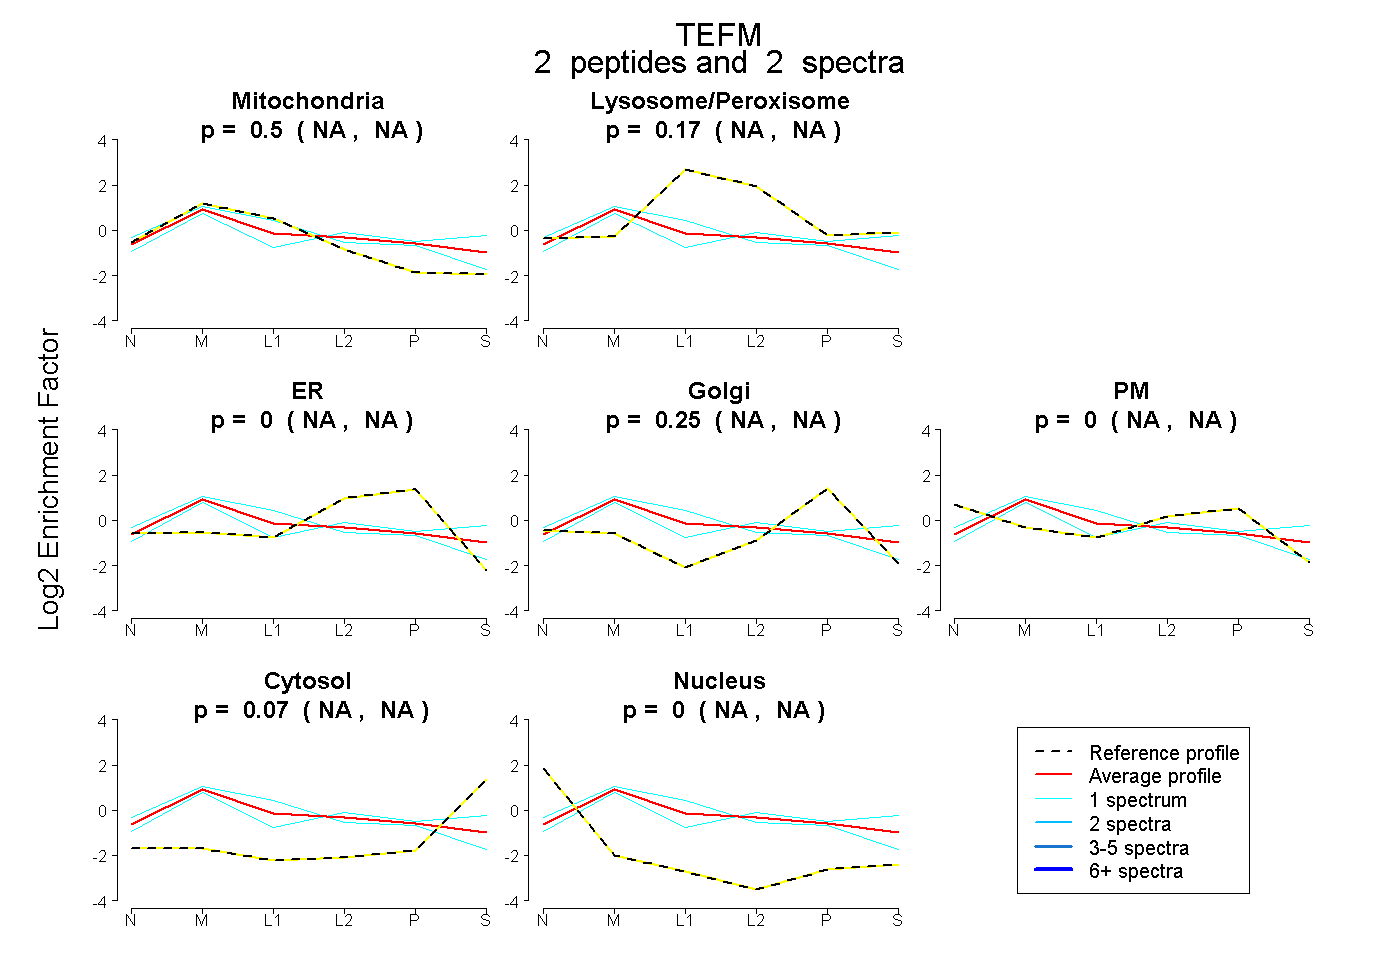
| Plot | Mito | Lyso or Perox | ER | Golgi | PM | Cytosol | Nucleus | ||||||
| Expt B |
2 peptides |
2 spectra |
|
0.501 NA | NA |
0.174 NA | NA |
0.000 NA | NA |
0.250 NA | NA |
0.000 NA | NA |
0.074 NA | NA |
0.000 NA | NA |
| 1 spectrum, TYPSSFYLEEISSVVSK | 0.311 | 0.177 | 0.111 | 0.150 | 0.000 | 0.251 | 0.000 | |||
| 1 spectrum, ADLYILEK | 0.657 | 0.112 | 0.002 | 0.146 | 0.082 | 0.000 | 0.000 |
| Plot | Lyso | Other | |||||||||||
| Expt C |
6 peptides |
12 spectra |
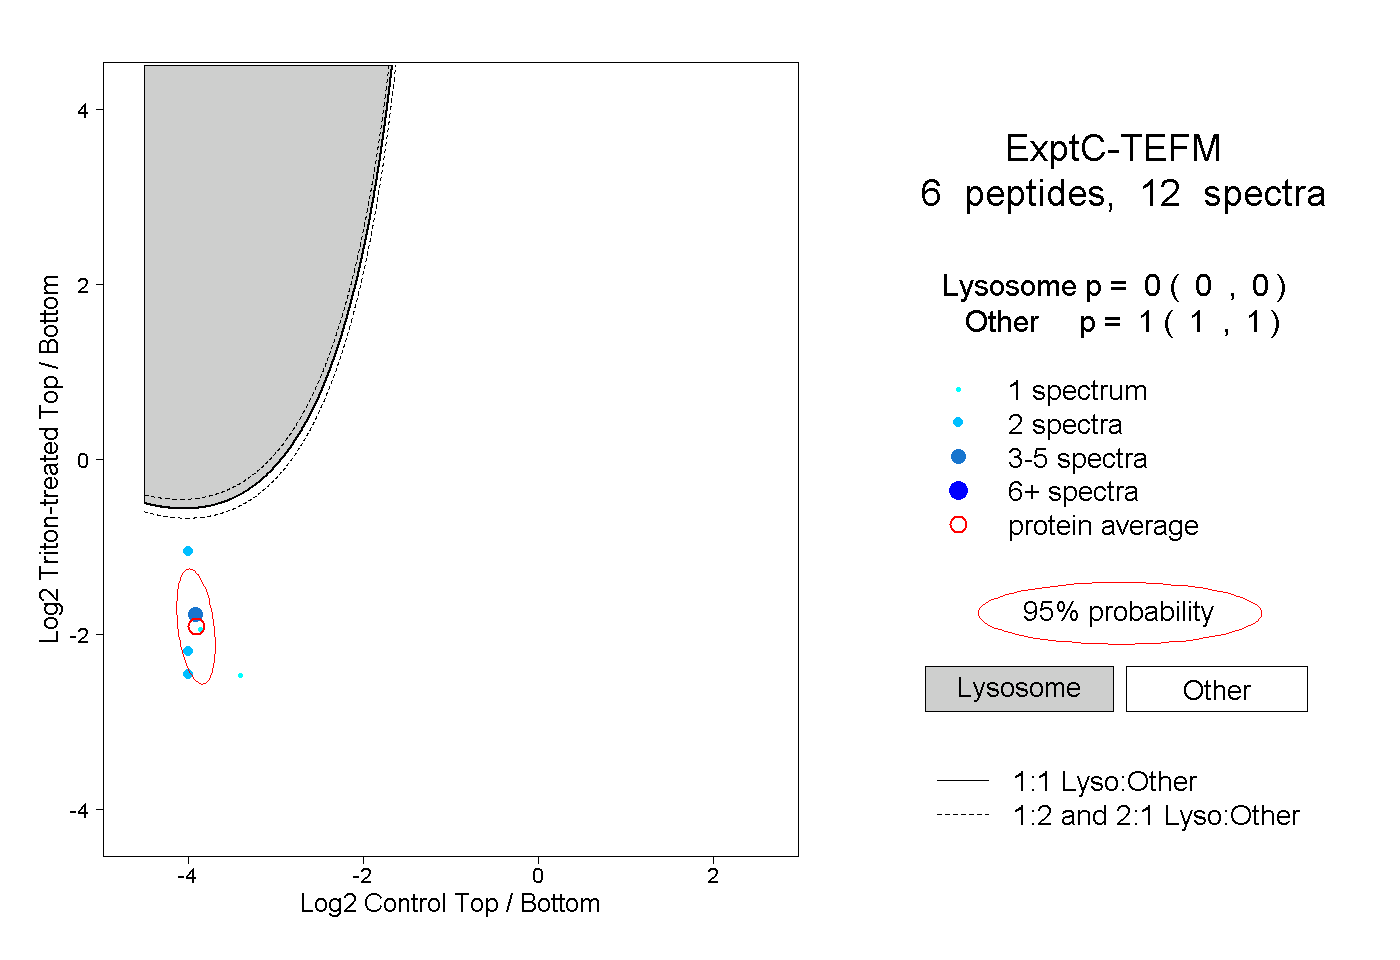 |
0.000 0.000 | 0.000 |
1.000 1.000 | 1.000 |
||||||||
| Plot | Lyso | Other | |||||||||||
| Expt D |
2 peptides |
4 spectra |
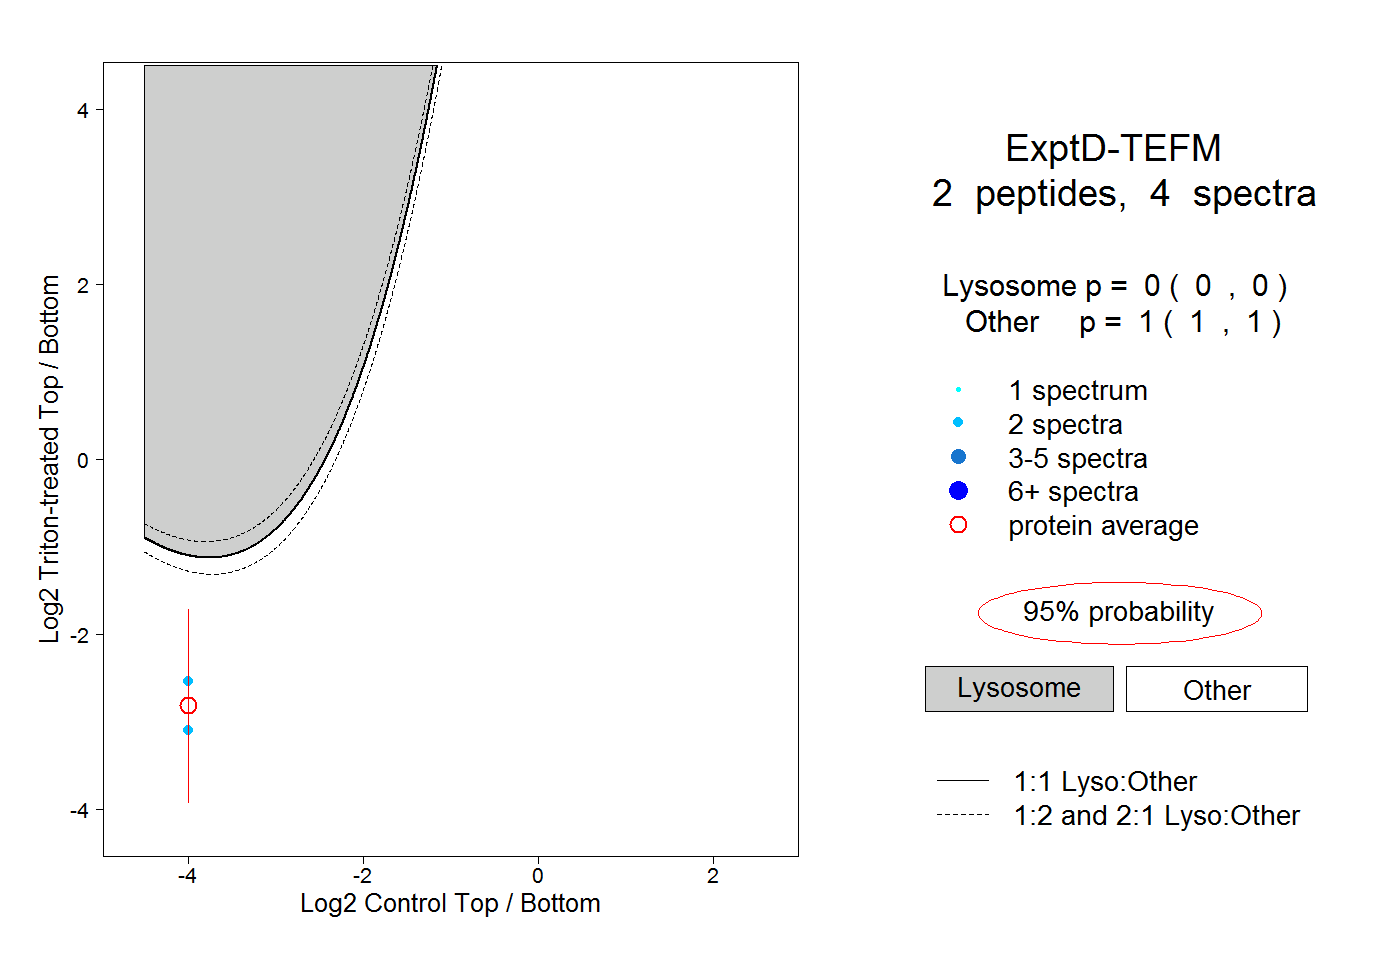 |
0.000 0.000 | 0.000 |
1.000 1.000 | 1.000 |