 13
13peptides
spectra
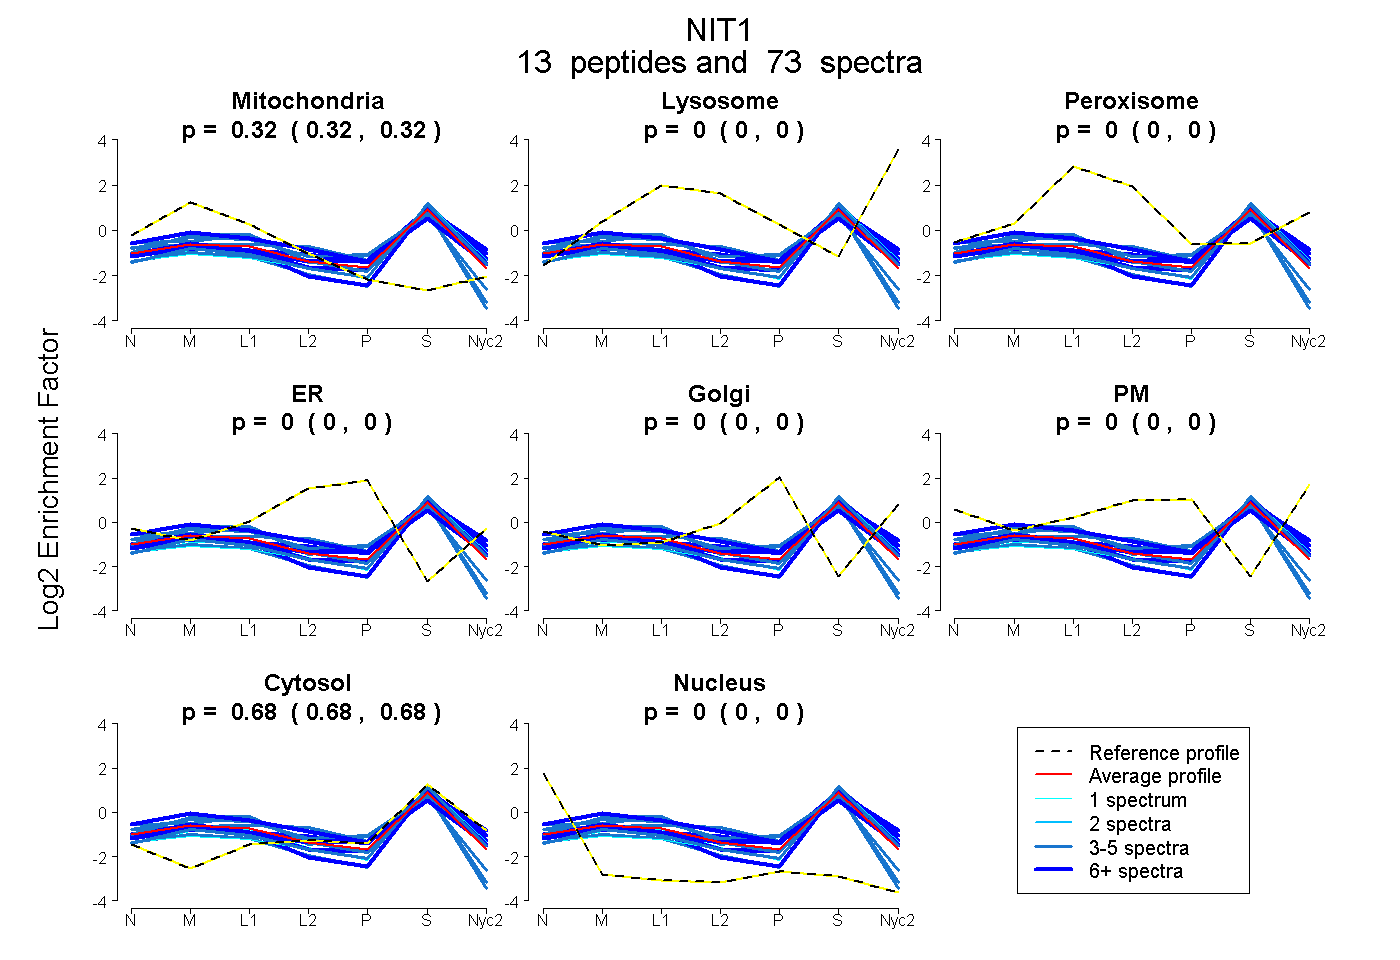
0.317 | 0.324
0.000 | 0.000
0.000 | 0.000
0.000 | 0.000
0.000 | 0.000
0.000 | 0.000
0.676 | 0.682
0.000 | 0.000
6peptides
spectra
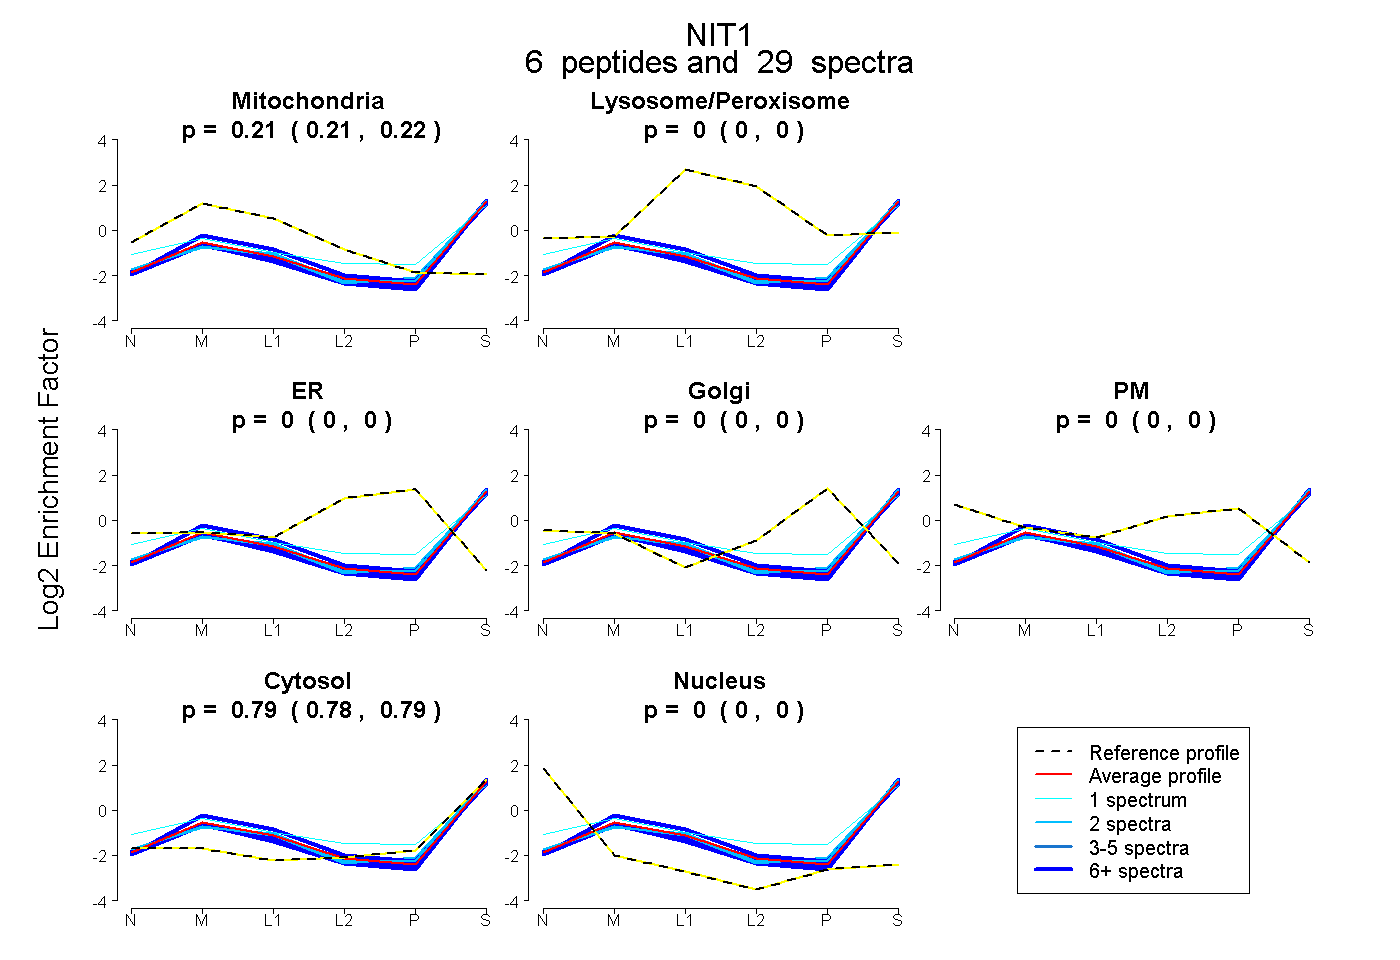
0.207 | 0.217
0.000 | 0.000
0.000 | 0.000
0.000 | 0.000
0.000 | 0.000
0.782 | 0.792
0.000 | 0.000
12peptides
spectra
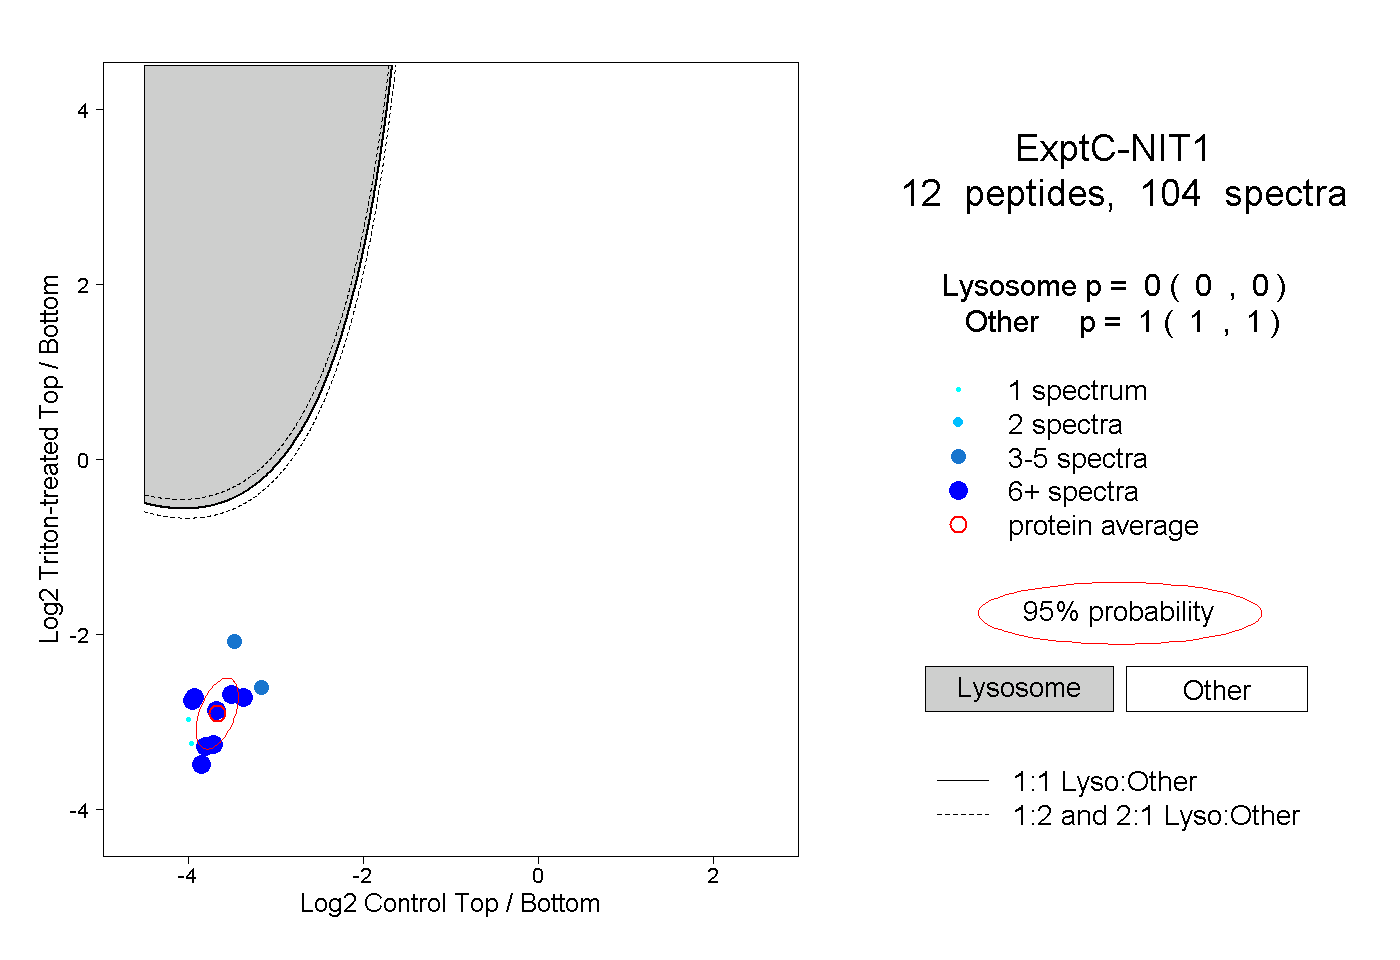
0.000 | 0.000
1.000 | 1.000
4peptides
spectra
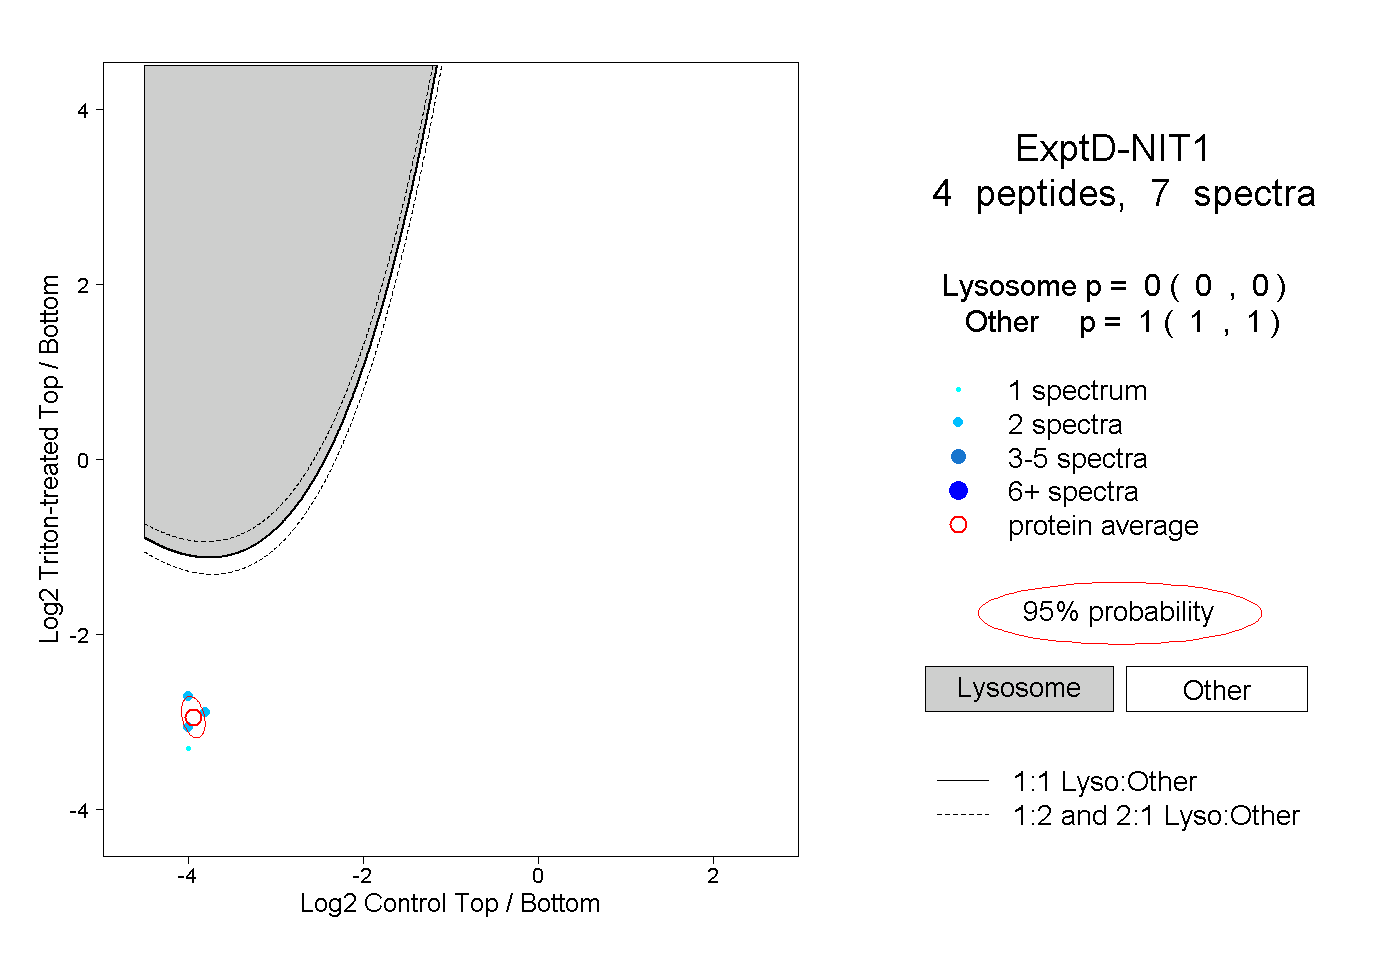
0.000 | 0.000
1.000 | 1.000