NIT1
[ENSRNOP00000005194]
Main page
| | | Plot |
Mito |
Lyso |
|
Perox |
ER |
Golgi |
PM |
Cytosol |
Nucleus |
|
| Expt A |
 13
13
peptides |
73
spectra |
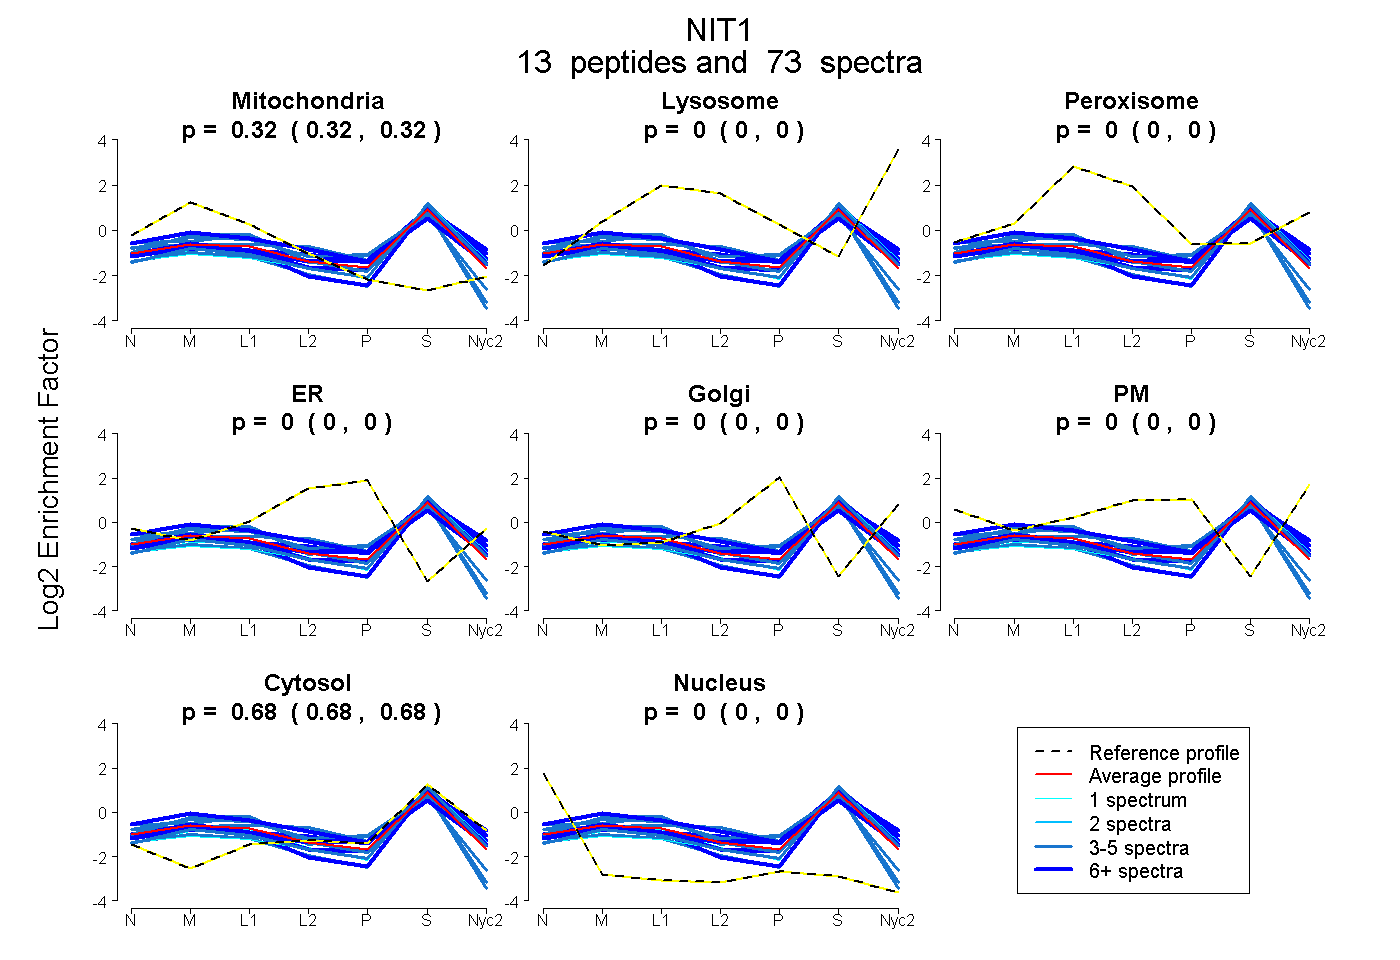 |
0.321
0.317 | 0.324 |
0.000
0.000 | 0.000 |
|
0.000
0.000 | 0.000 |
0.000
0.000 | 0.000 |
0.000
0.000 | 0.000 |
0.000
0.000 | 0.000 |
0.679
0.676 | 0.682 |
0.000
0.000 | 0.000 |
|
| | | Plot |
Mito |
|
Lyso or Perox |
|
ER |
Golgi |
PM |
Cytosol |
Nucleus |
|
| Expt B |
6
peptides |
29
spectra |
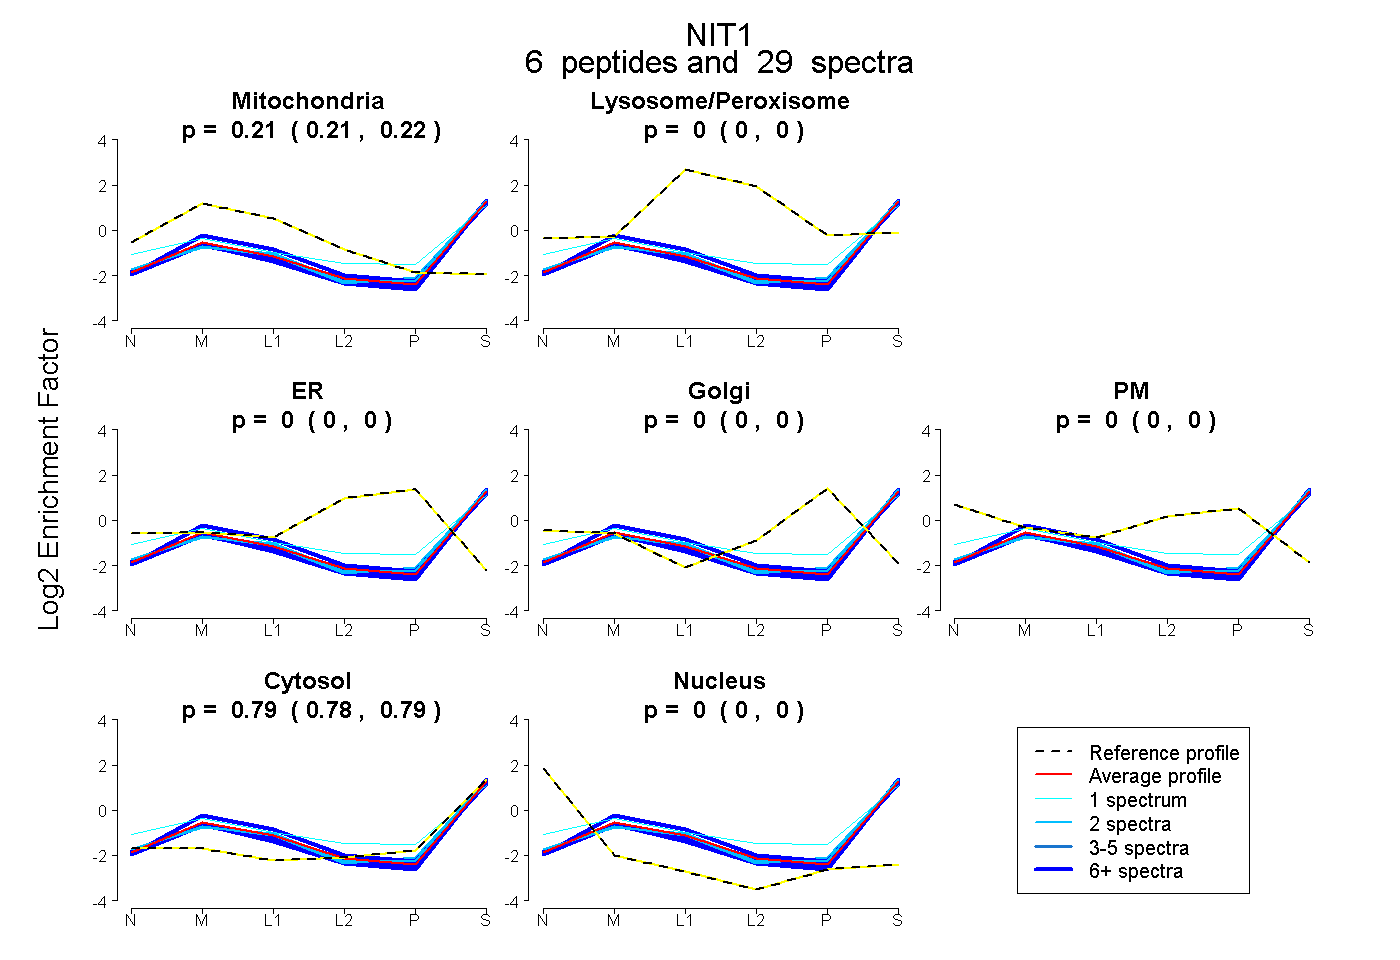 |
0.212
0.207 | 0.217 |
|
0.000
0.000 | 0.000 |
|
0.000
0.000 | 0.000 |
0.000
0.000 | 0.000 |
0.000
0.000 | 0.000 |
0.788
0.782 | 0.792 |
0.000
0.000 | 0.000 |
|
| 6 spectra, GSVVASYR |
0.169 |
|
0.000 |
|
0.000 |
0.000 |
0.000 |
0.831 |
0.000 |
|
| 10 spectra, IDLHFLQQMR |
0.181 |
|
0.000 |
|
0.000 |
0.000 |
0.000 |
0.819 |
0.000 |
|
| 1 spectrum, RPDLYGSLLPLS |
0.200 |
|
0.130 |
|
0.000 |
0.000 |
0.000 |
0.670 |
0.000 |
|
| 2 spectra, IYNCHVLLNSK |
0.193 |
|
0.000 |
|
0.000 |
0.000 |
0.000 |
0.807 |
0.000 |
|
| 2 spectra, TCAELVQEATR |
0.192 |
|
0.003 |
|
0.000 |
0.000 |
0.000 |
0.805 |
0.000 |
|
| 8 spectra, QHLPVFQHR |
0.278 |
|
0.003 |
|
0.000 |
0.000 |
0.000 |
0.719 |
0.000 |
|
| | | Plot |
|
Lyso |
|
|
|
|
|
|
|
Other |
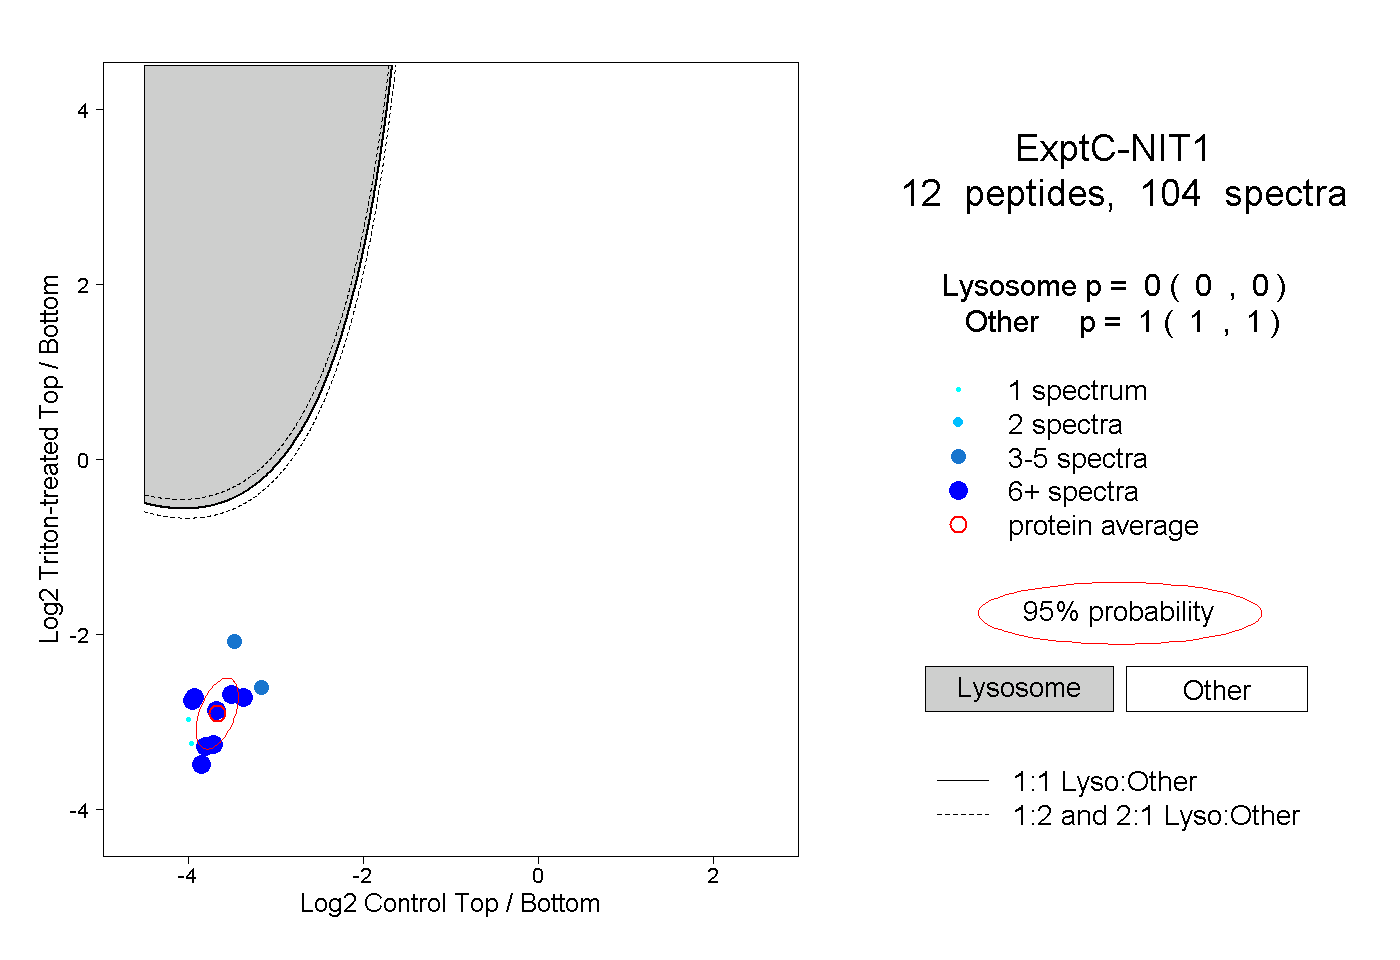
| Expt C |
12
peptides |
104
spectra |
 |
|
0.000
0.000 | 0.000 |
|
|
|
|
|
|
|
1.000
1.000 | 1.000 |
| | | Plot |
|
Lyso |
|
|
|
|
|
|
|
Other |
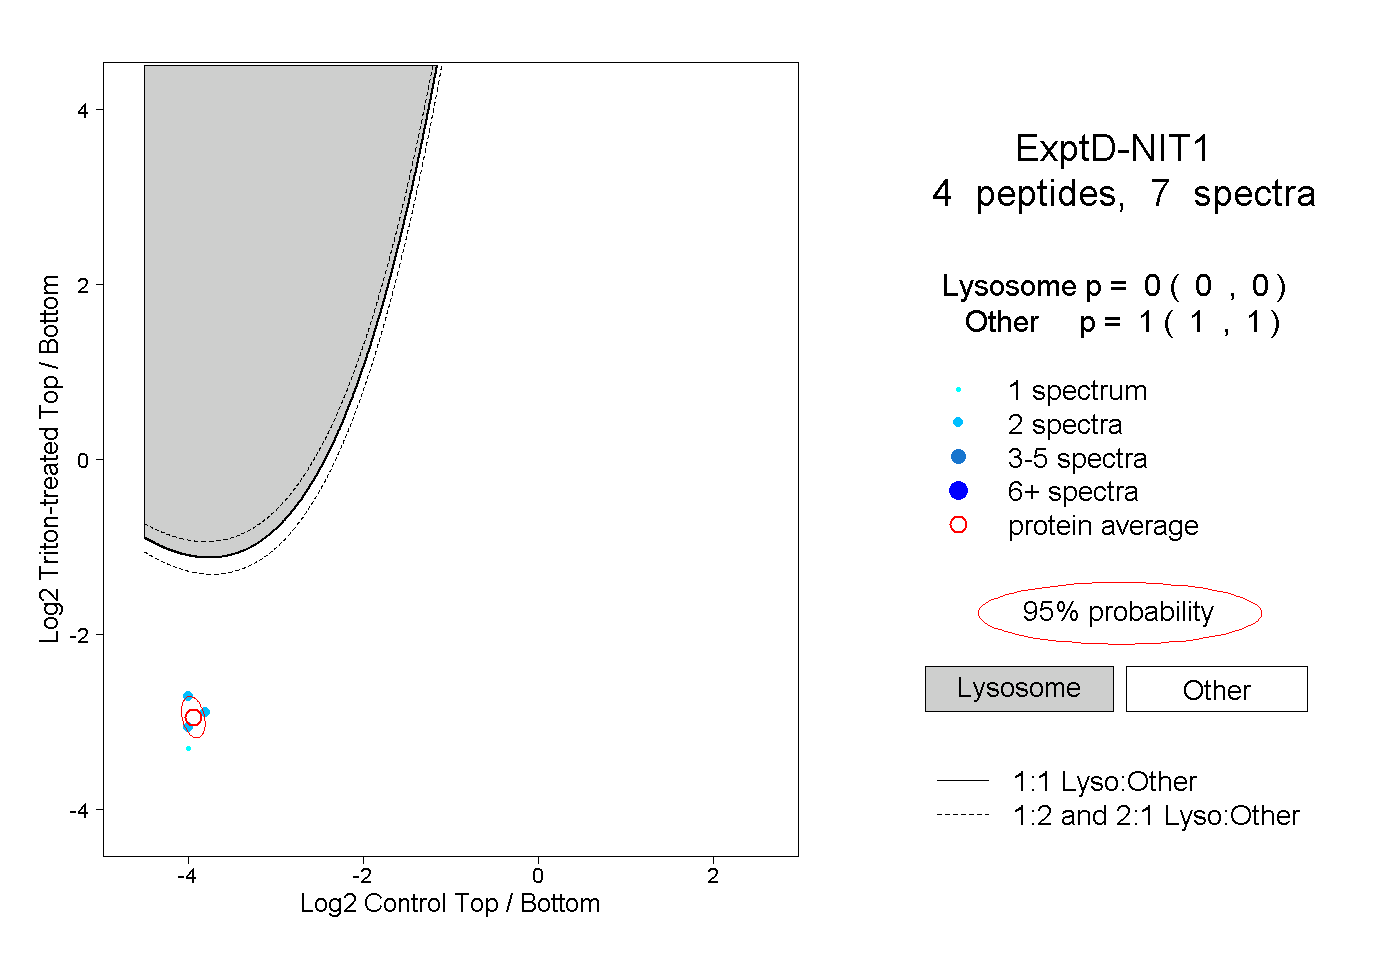
| Expt D |
4
peptides |
7
spectra |
 |
|
0.000
0.000 | 0.000 |
|
|
|
|
|
|
|
1.000
1.000 | 1.000 |