 13
13peptides
spectra
0.317 | 0.324
0.000 | 0.000
0.000 | 0.000
0.000 | 0.000
0.000 | 0.000
0.000 | 0.000
0.676 | 0.682
0.000 | 0.000
| Plot | Mito | Lyso | Perox | ER | Golgi | PM | Cytosol | Nucleus | |||||
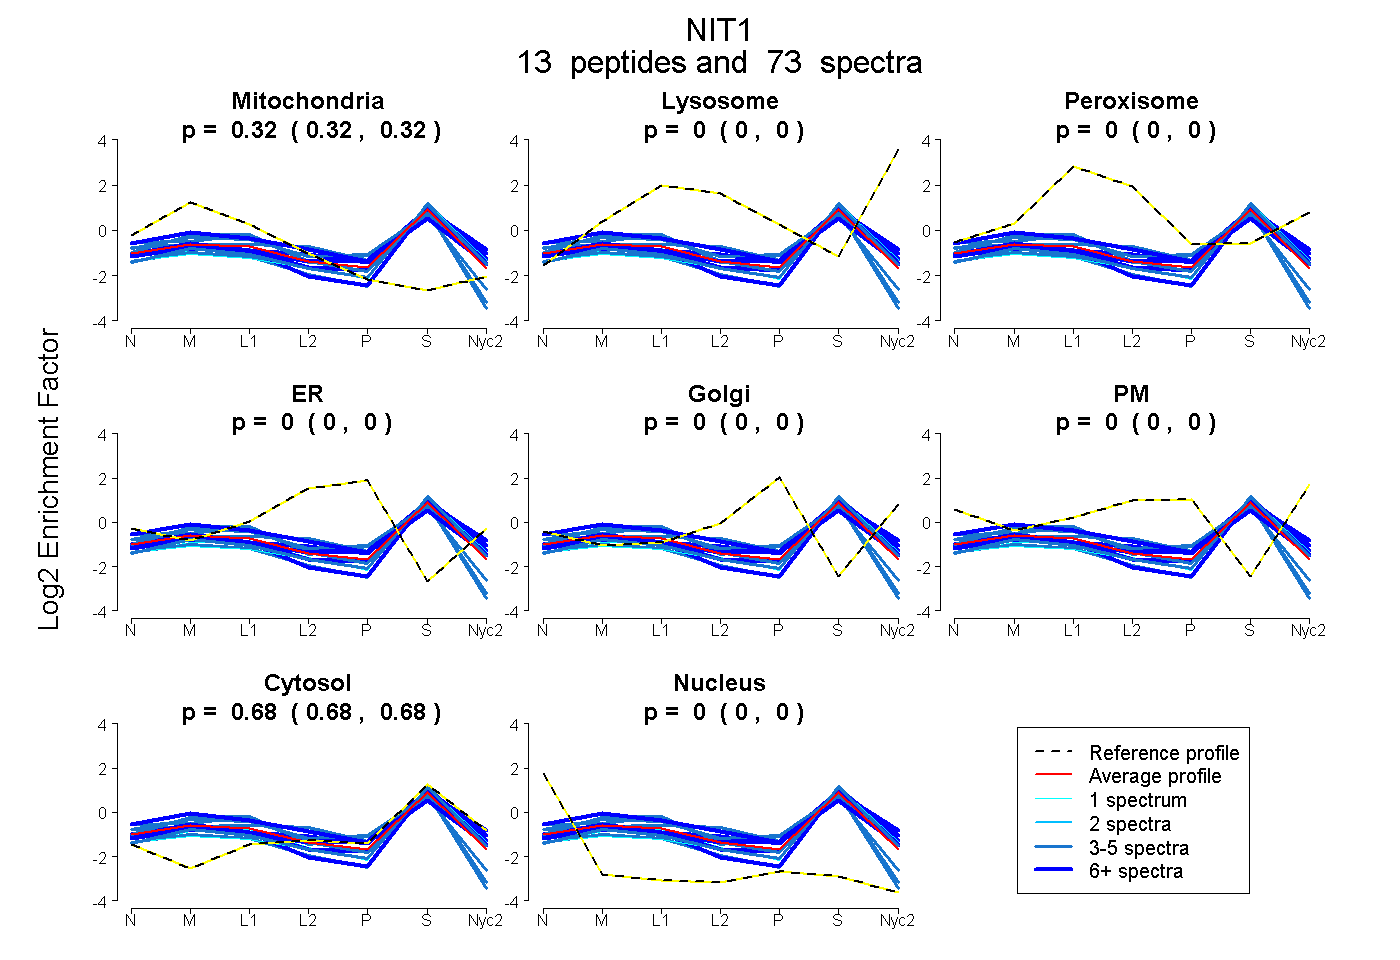
| Expt A |
13 peptides |
73 spectra |
|
0.321 0.317 | 0.324 |
0.000 0.000 | 0.000 |
0.000 0.000 | 0.000 |
0.000 0.000 | 0.000 |
0.000 0.000 | 0.000 |
0.000 0.000 | 0.000 |
0.679 0.676 | 0.682 |
0.000 0.000 | 0.000 |
| 4 spectra, FPELSLK | 0.221 | 0.000 | 0.000 | 0.000 | 0.000 | 0.000 | 0.779 | 0.000 | ||
| 3 spectra, ECGIWLSLGGFHER | 0.392 | 0.000 | 0.000 | 0.000 | 0.000 | 0.000 | 0.605 | 0.003 | ||
| 10 spectra, THLCDVEIPGQGPMR | 0.358 | 0.000 | 0.120 | 0.000 | 0.000 | 0.000 | 0.521 | 0.000 | ||
| 1 spectrum, ESNYTMPGYALEPPVK | 0.255 | 0.000 | 0.000 | 0.000 | 0.000 | 0.000 | 0.745 | 0.000 | ||
| 6 spectra, GQDWEQTQK | 0.276 | 0.000 | 0.000 | 0.000 | 0.000 | 0.000 | 0.724 | 0.000 | ||
| 6 spectra, GSVVASYR | 0.264 | 0.000 | 0.000 | 0.000 | 0.000 | 0.000 | 0.736 | 0.000 | ||
| 3 spectra, AIESQCYVIAAAQCGR | 0.421 | 0.000 | 0.000 | 0.000 | 0.000 | 0.000 | 0.579 | 0.000 | ||
| 4 spectra, RPDLYGSLLPLS | 0.307 | 0.000 | 0.096 | 0.000 | 0.000 | 0.000 | 0.597 | 0.000 | ||
| 20 spectra, IDLHFLQQMR | 0.229 | 0.032 | 0.056 | 0.000 | 0.000 | 0.000 | 0.683 | 0.000 | ||
| 1 spectrum, TCAELVQEATR | 0.203 | 0.000 | 0.000 | 0.000 | 0.000 | 0.000 | 0.797 | 0.000 | ||
| 4 spectra, IYNCHVLLNSK | 0.452 | 0.000 | 0.000 | 0.000 | 0.000 | 0.000 | 0.548 | 0.000 | ||
| 7 spectra, QHLPVFQHR | 0.275 | 0.000 | 0.000 | 0.000 | 0.000 | 0.000 | 0.725 | 0.000 | ||
| 4 spectra, VGLAICYDMR | 0.252 | 0.000 | 0.000 | 0.000 | 0.000 | 0.000 | 0.748 | 0.000 |
| Plot | Mito | Lyso or Perox | ER | Golgi | PM | Cytosol | Nucleus | ||||||
| Expt B |
6 peptides |
29 spectra |
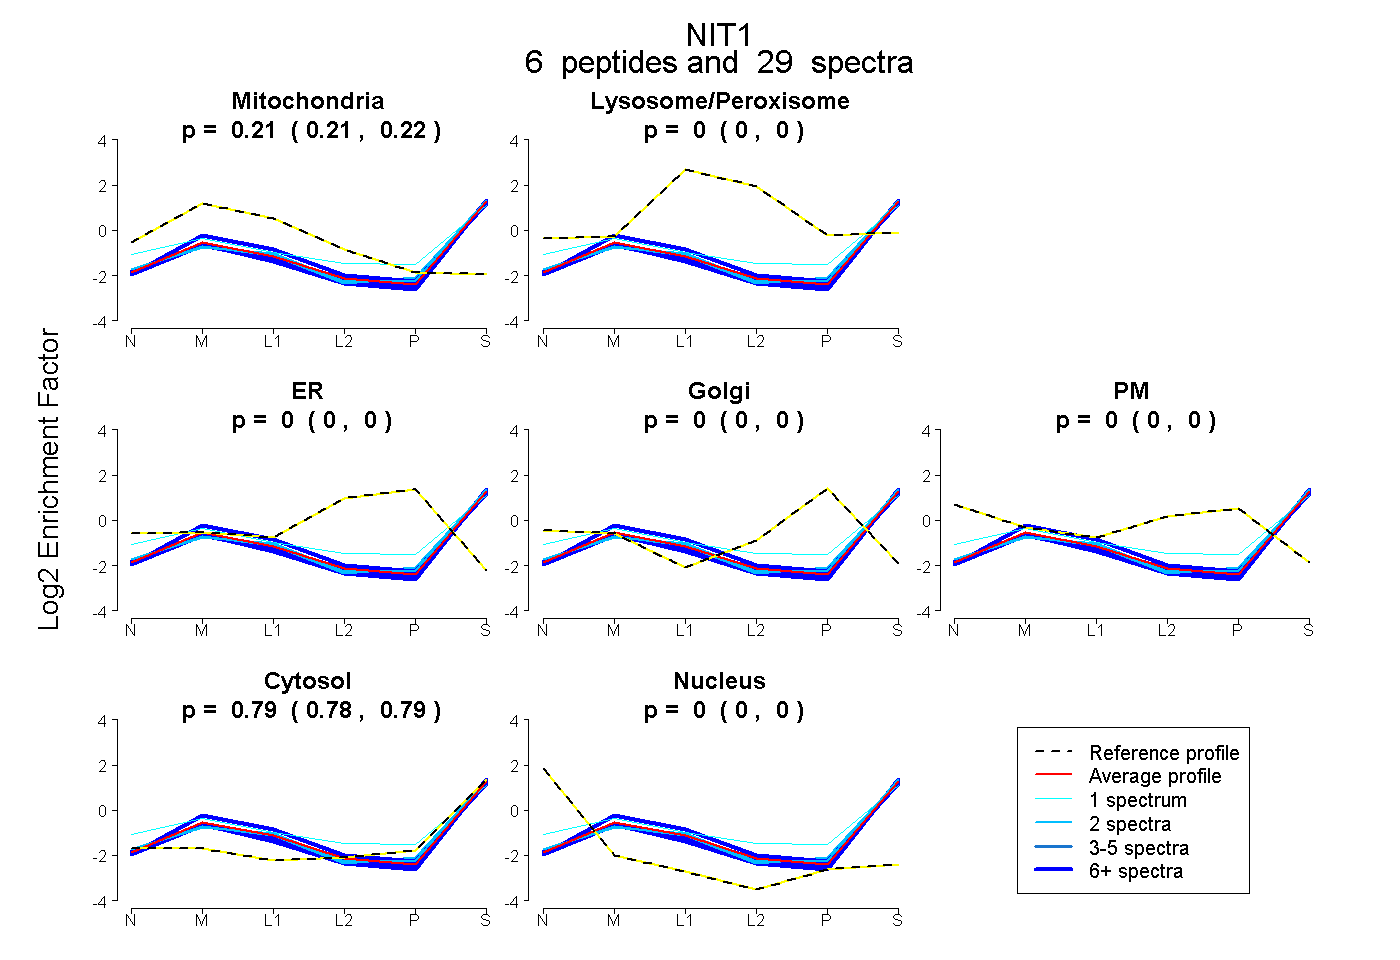 |
0.212 0.207 | 0.217 |
0.000 0.000 | 0.000 |
0.000 0.000 | 0.000 |
0.000 0.000 | 0.000 |
0.000 0.000 | 0.000 |
0.788 0.782 | 0.792 |
0.000 0.000 | 0.000 |
|||
| Plot | Lyso | Other | |||||||||||
| Expt C |
12 peptides |
104 spectra |
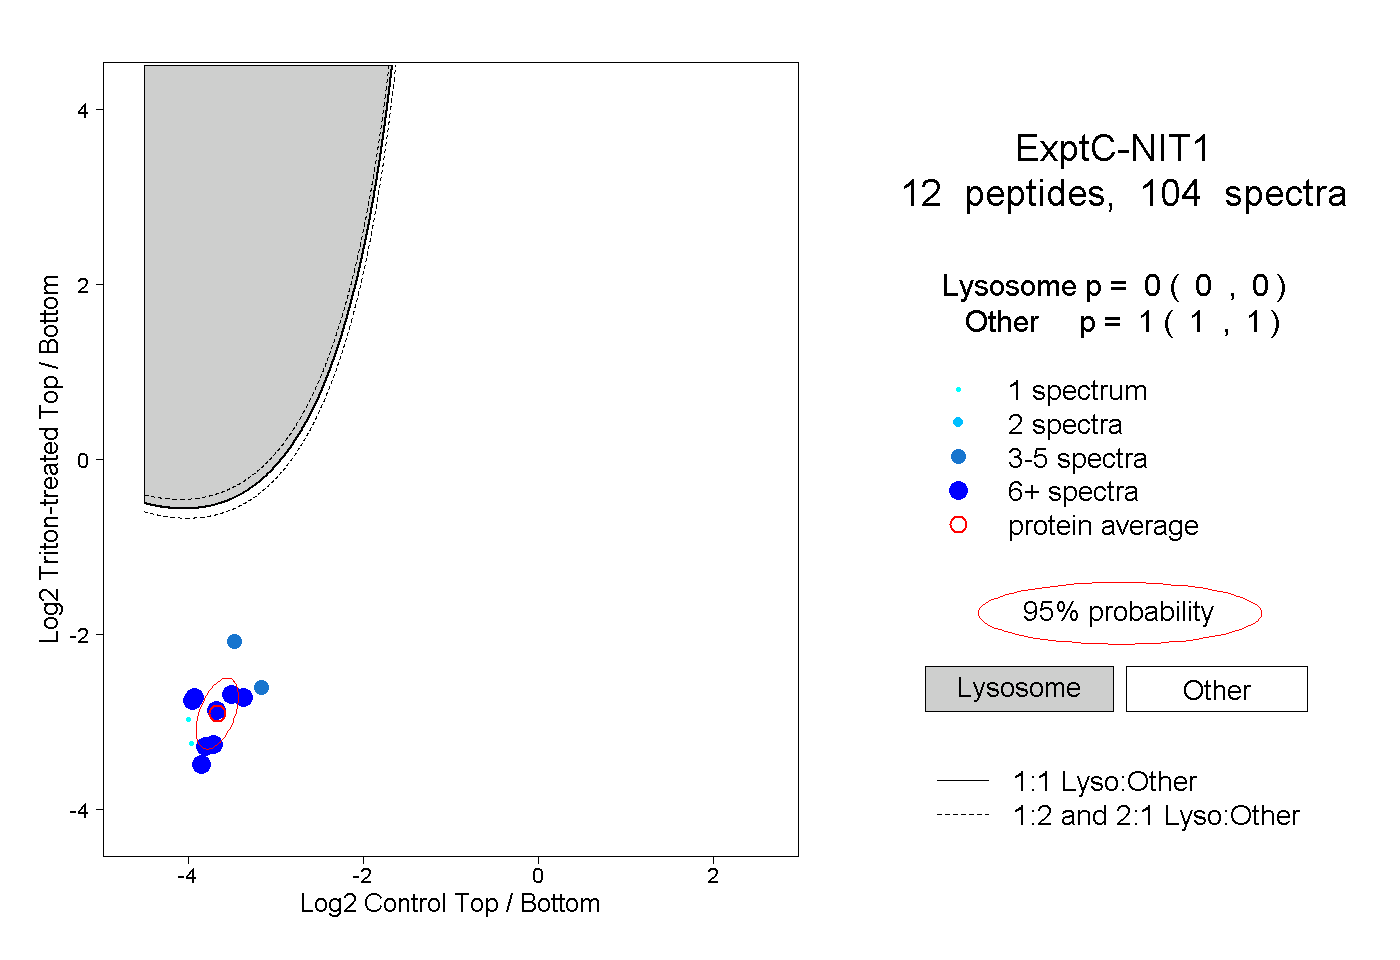 |
0.000 0.000 | 0.000 |
1.000 1.000 | 1.000 |
||||||||
| Plot | Lyso | Other | |||||||||||
| Expt D |
4 peptides |
7 spectra |
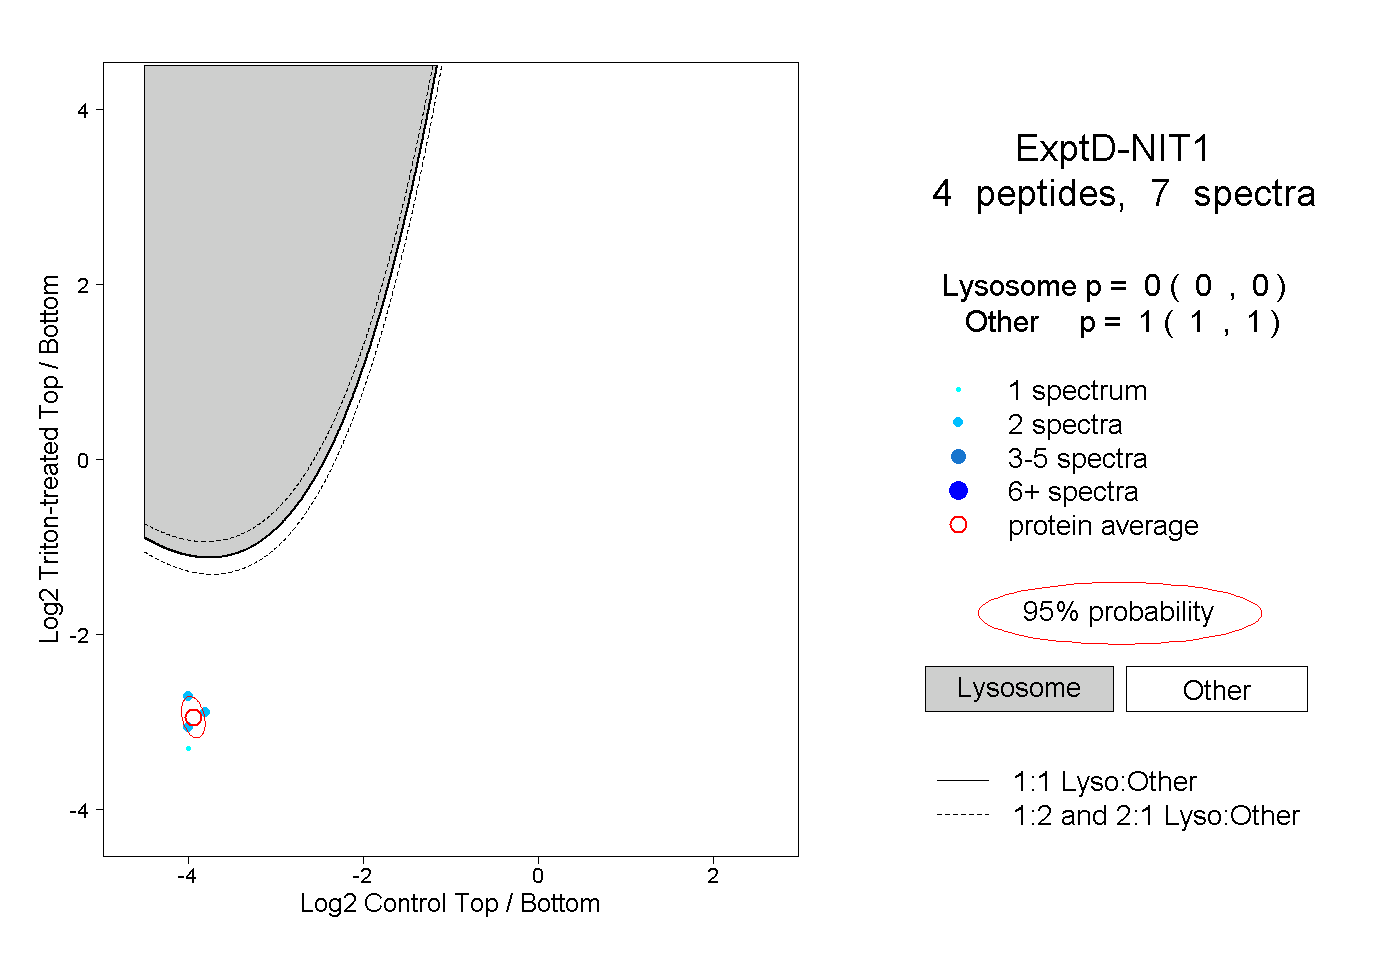 |
0.000 0.000 | 0.000 |
1.000 1.000 | 1.000 |