 27
27peptides
spectra
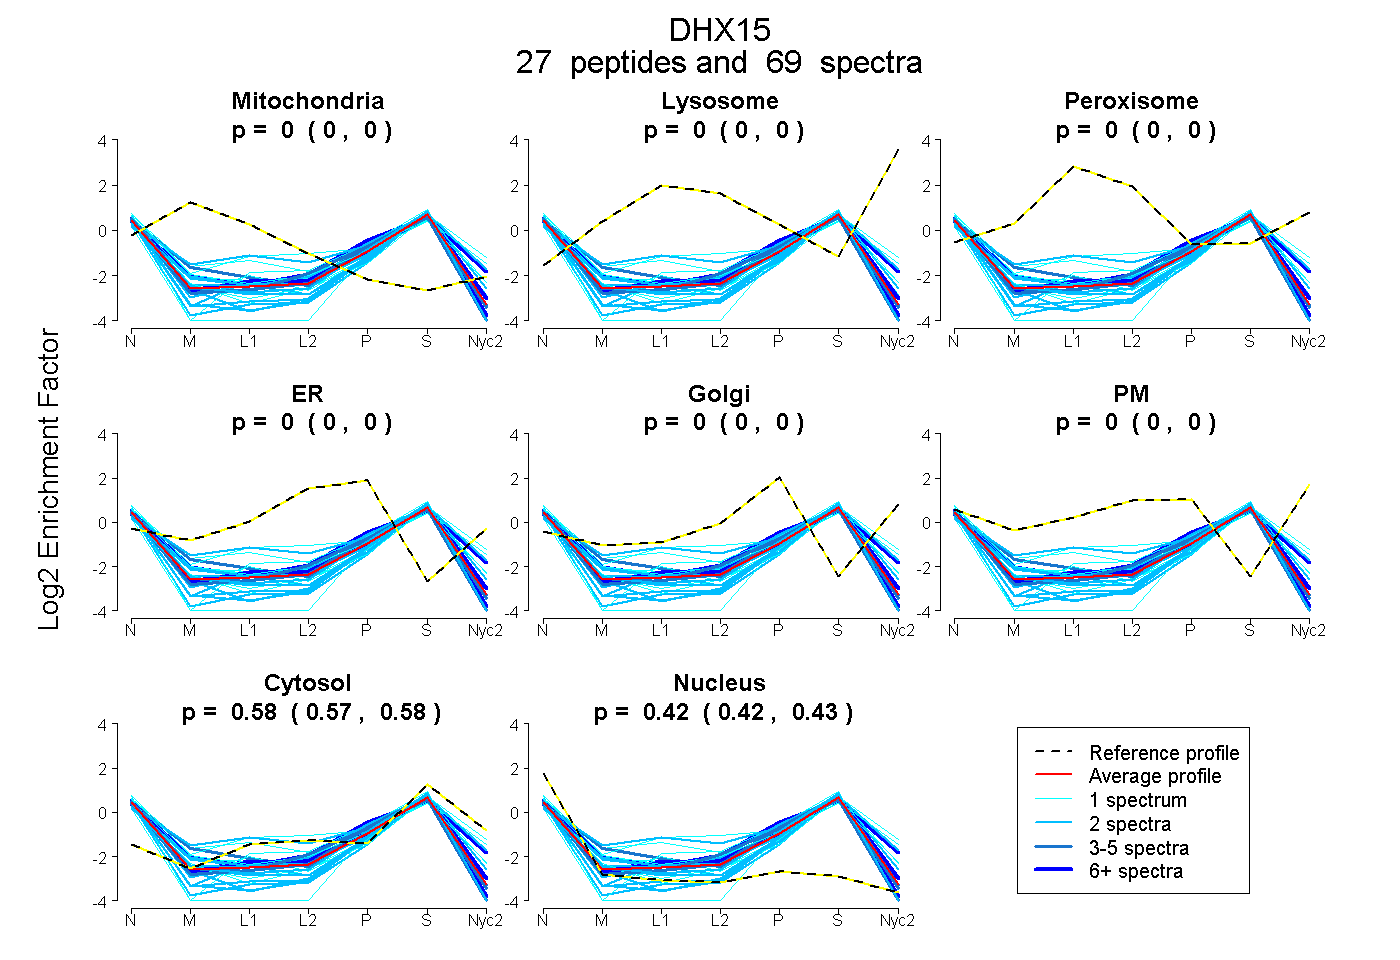
0.000 | 0.000
0.000 | 0.000
0.000 | 0.000
0.000 | 0.000
0.000 | 0.000
0.000 | 0.000
0.573 | 0.578
0.421 | 0.427
6peptides
spectra
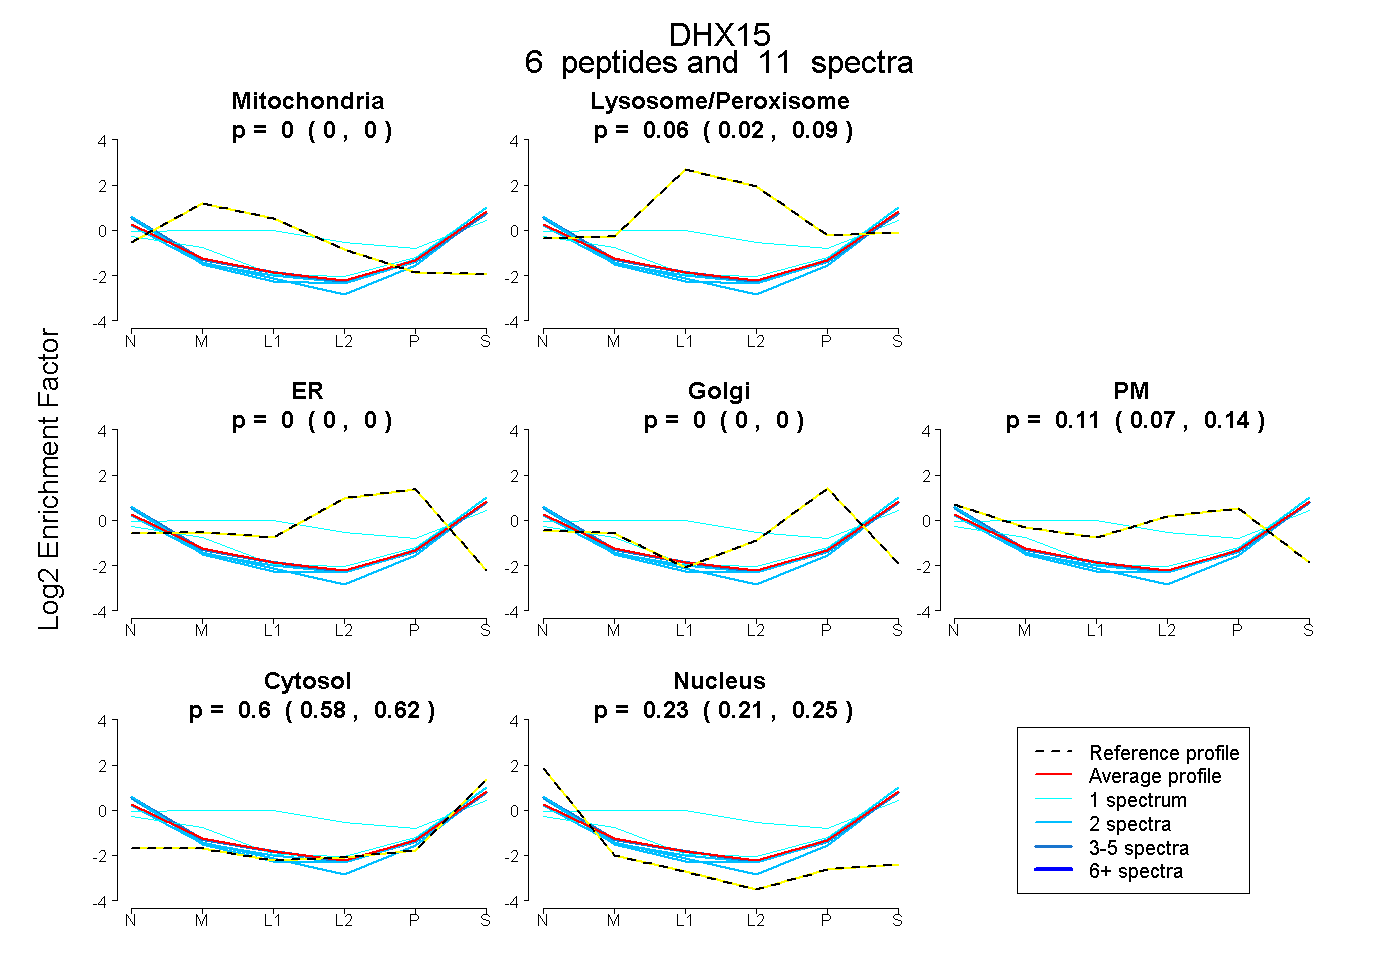
0.000 | 0.000
0.022 | 0.088
0.000 | 0.000
0.000 | 0.000
0.069 | 0.140
0.579 | 0.618
0.209 | 0.254
11peptides
spectra
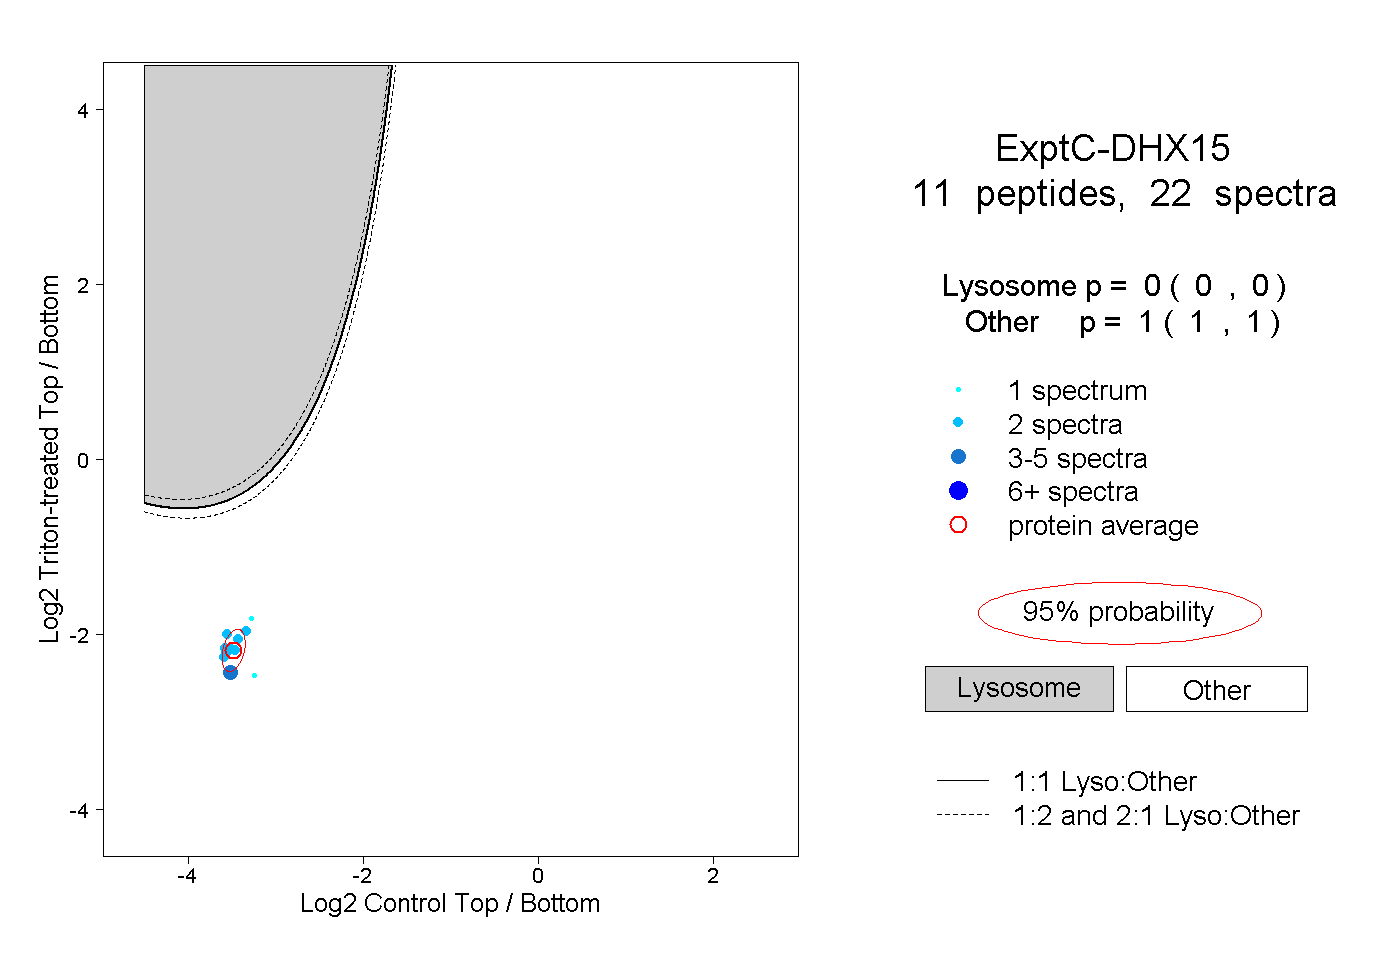
0.000 | 0.000
1.000 | 1.000
1peptide
spectrum
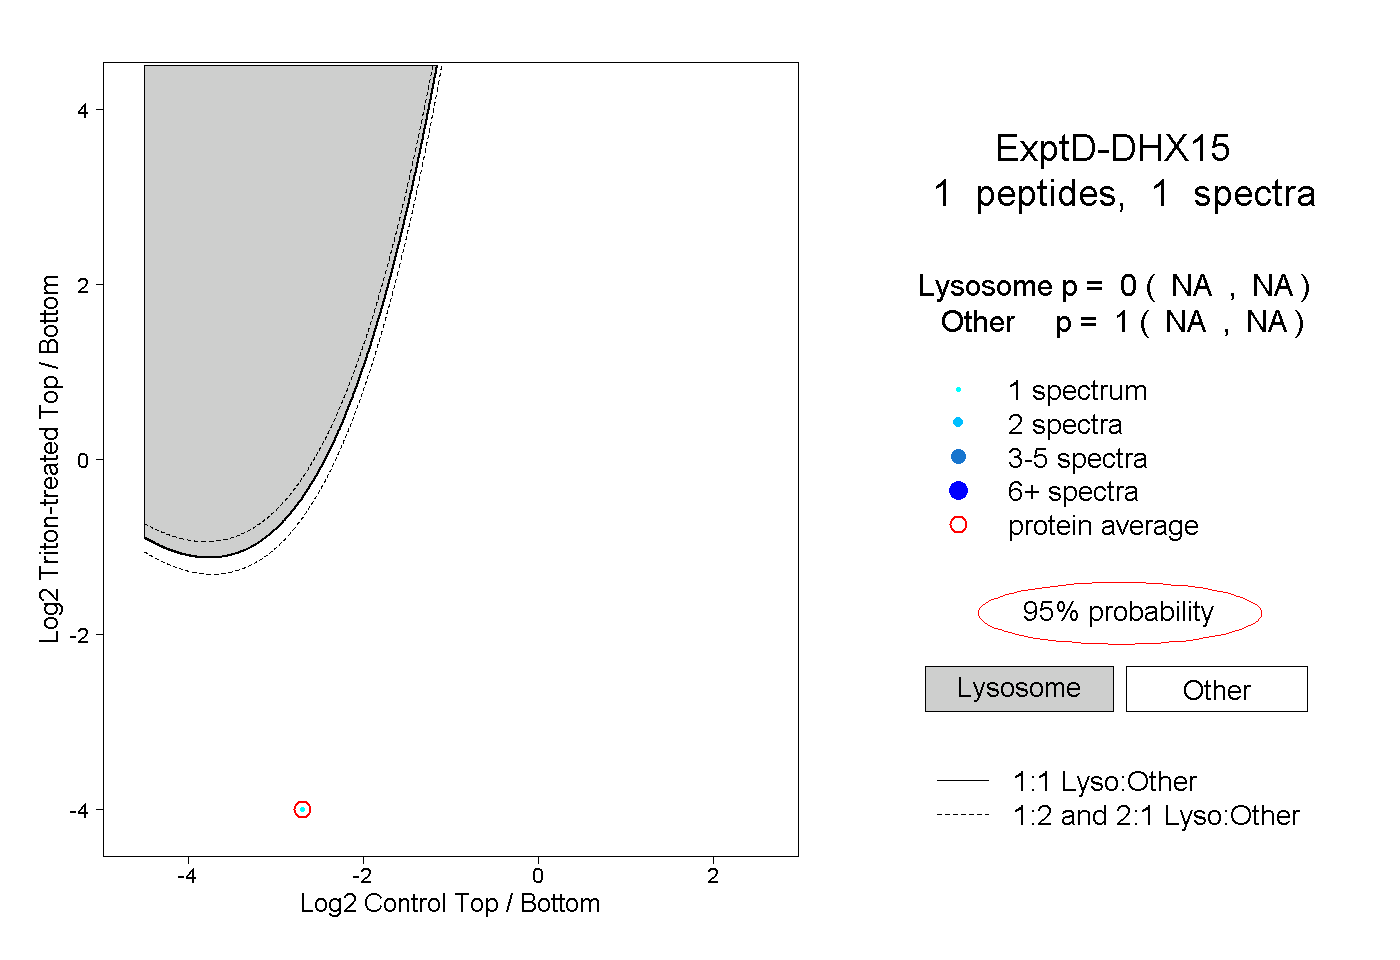
NA | NA
NA | NA