DHX15
[ENSRNOP00000005126]
Main page
| | | Plot |
Mito |
Lyso |
|
Perox |
ER |
Golgi |
PM |
Cytosol |
Nucleus |
|
| Expt A |
 27
27
peptides |
69
spectra |
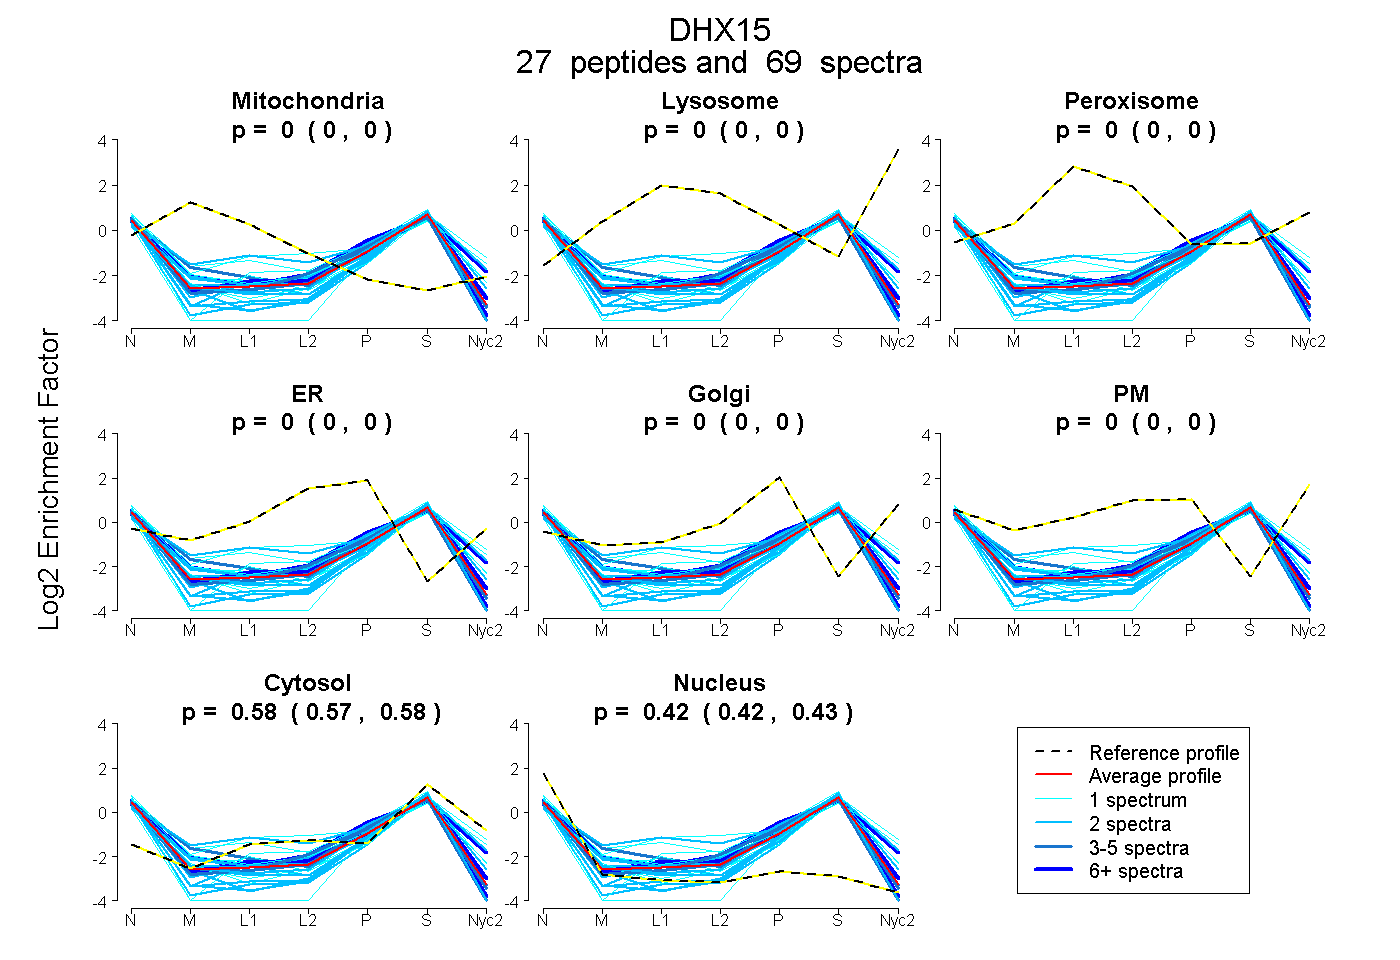 |
0.000
0.000 | 0.000 |
0.000
0.000 | 0.000 |
|
0.000
0.000 | 0.000 |
0.000
0.000 | 0.000 |
0.000
0.000 | 0.000 |
0.000
0.000 | 0.000 |
0.576
0.573 | 0.578 |
0.424
0.421 | 0.427 |
|
| | | Plot |
Mito |
|
Lyso or Perox |
|
ER |
Golgi |
PM |
Cytosol |
Nucleus |
|
| Expt B |
6
peptides |
11
spectra |
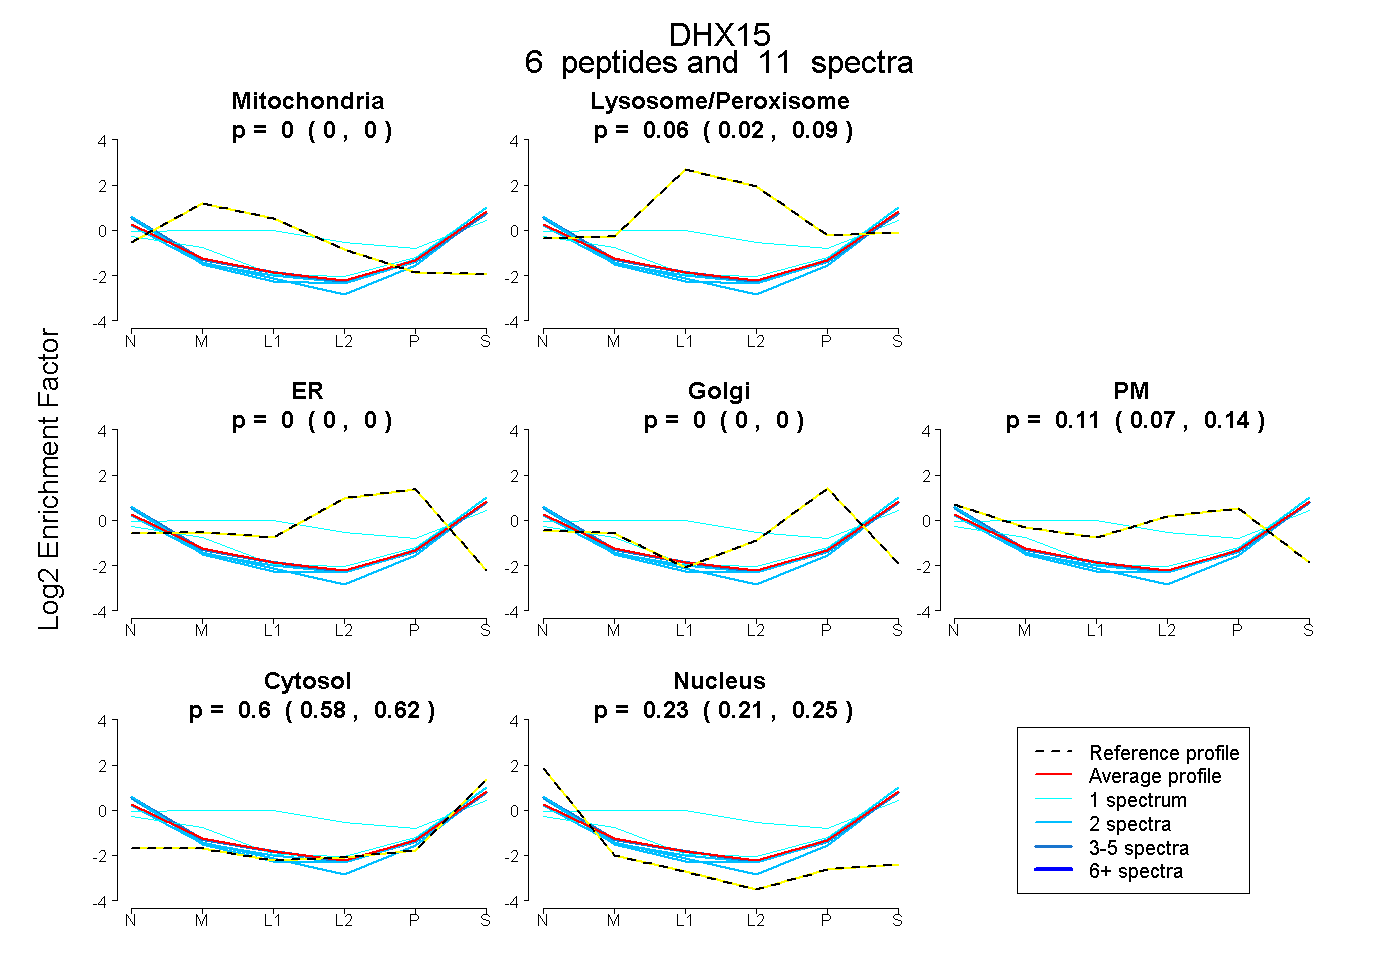 |
0.000
0.000 | 0.000 |
|
0.057
0.022 | 0.088 |
|
0.000
0.000 | 0.000 |
0.000
0.000 | 0.000 |
0.108
0.069 | 0.140 |
0.600
0.579 | 0.618 |
0.235
0.209 | 0.254 |
|
| | | Plot |
|
Lyso |
|
|
|
|
|
|
|
Other |
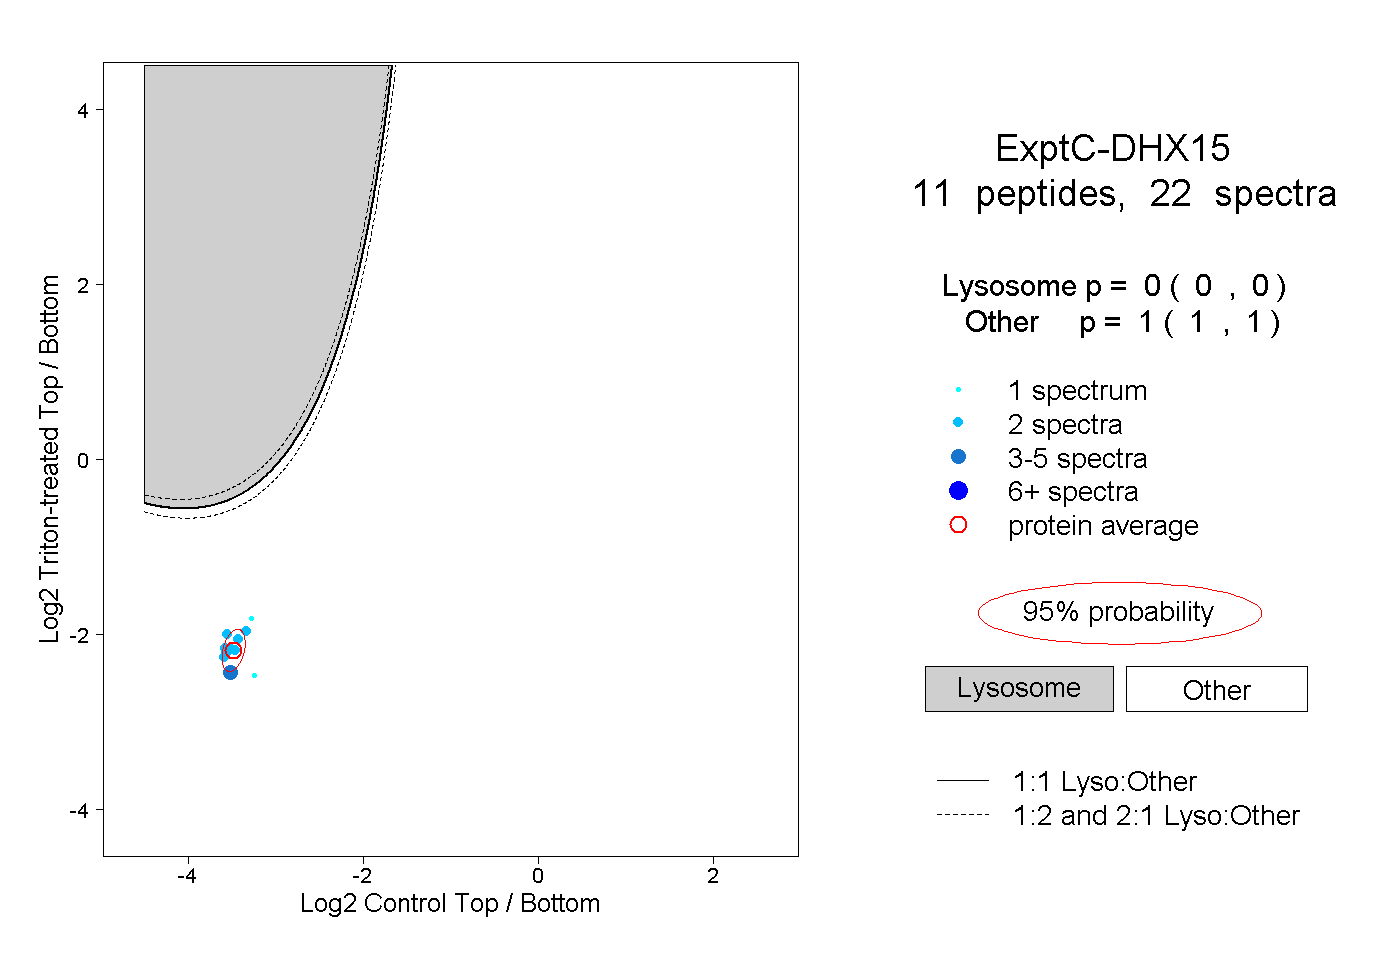
| Expt C |
11
peptides |
22
spectra |
 |
|
0.000
0.000 | 0.000 |
|
|
|
|
|
|
|
1.000
1.000 | 1.000 |
| 2 spectra, YYDILK |
|
0.000 |
|
|
|
|
|
|
|
1.000 |
| 2 spectra, VAAMSVAQR |
|
0.000 |
|
|
|
|
|
|
|
1.000 |
| 2 spectra, EVDDLGPEVGDIK |
|
0.000 |
|
|
|
|
|
|
|
1.000 |
| 2 spectra, EAMNDPLLER |
|
0.000 |
|
|
|
|
|
|
|
1.000 |
| 1 spectrum, YGVIILDEAHER |
|
0.000 |
|
|
|
|
|
|
|
1.000 |
| 2 spectra, STDFTSR |
|
0.000 |
|
|
|
|
|
|
|
1.000 |
| 2 spectra, AADEAK |
|
0.000 |
|
|
|
|
|
|
|
1.000 |
| 2 spectra, DYYINIR |
|
0.000 |
|
|
|
|
|
|
|
1.000 |
| 4 spectra, FEDCSSAK |
|
0.000 |
|
|
|
|
|
|
|
1.000 |
| 1 spectrum, GVACTQPR |
|
0.000 |
|
|
|
|
|
|
|
1.000 |
| 2 spectra, FTDILVR |
|
0.000 |
|
|
|
|
|
|
|
1.000 |
| | | Plot |
|
Lyso |
|
|
|
|
|
|
|
Other |
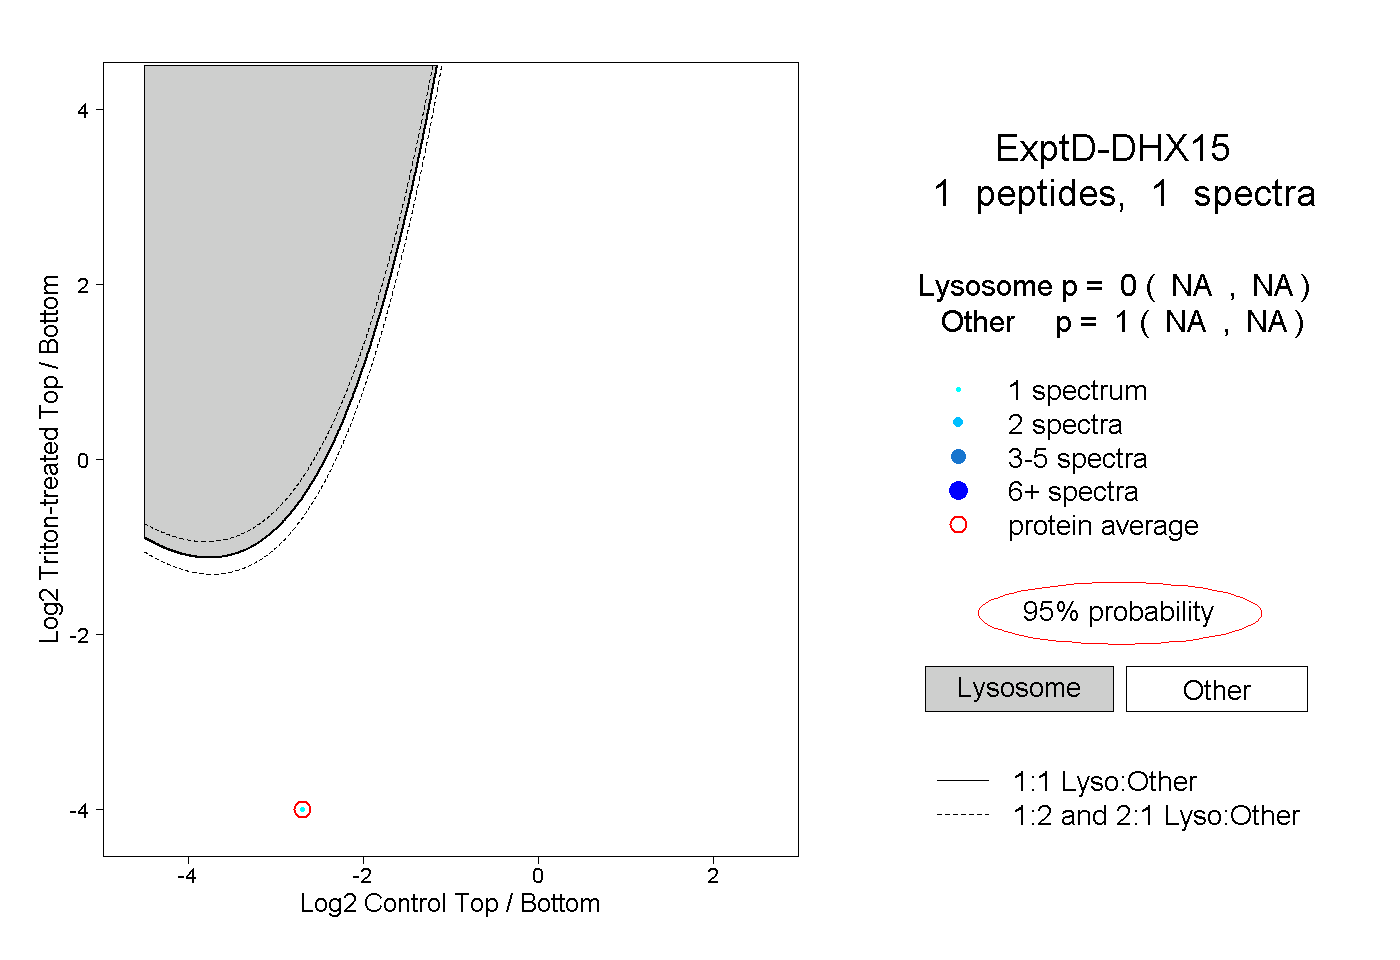
| Expt D |
1
peptide |
1
spectrum |
 |
|
0.000
NA | NA |
|
|
|
|
|
|
|
1.000
NA | NA |