 27
27peptides
spectra
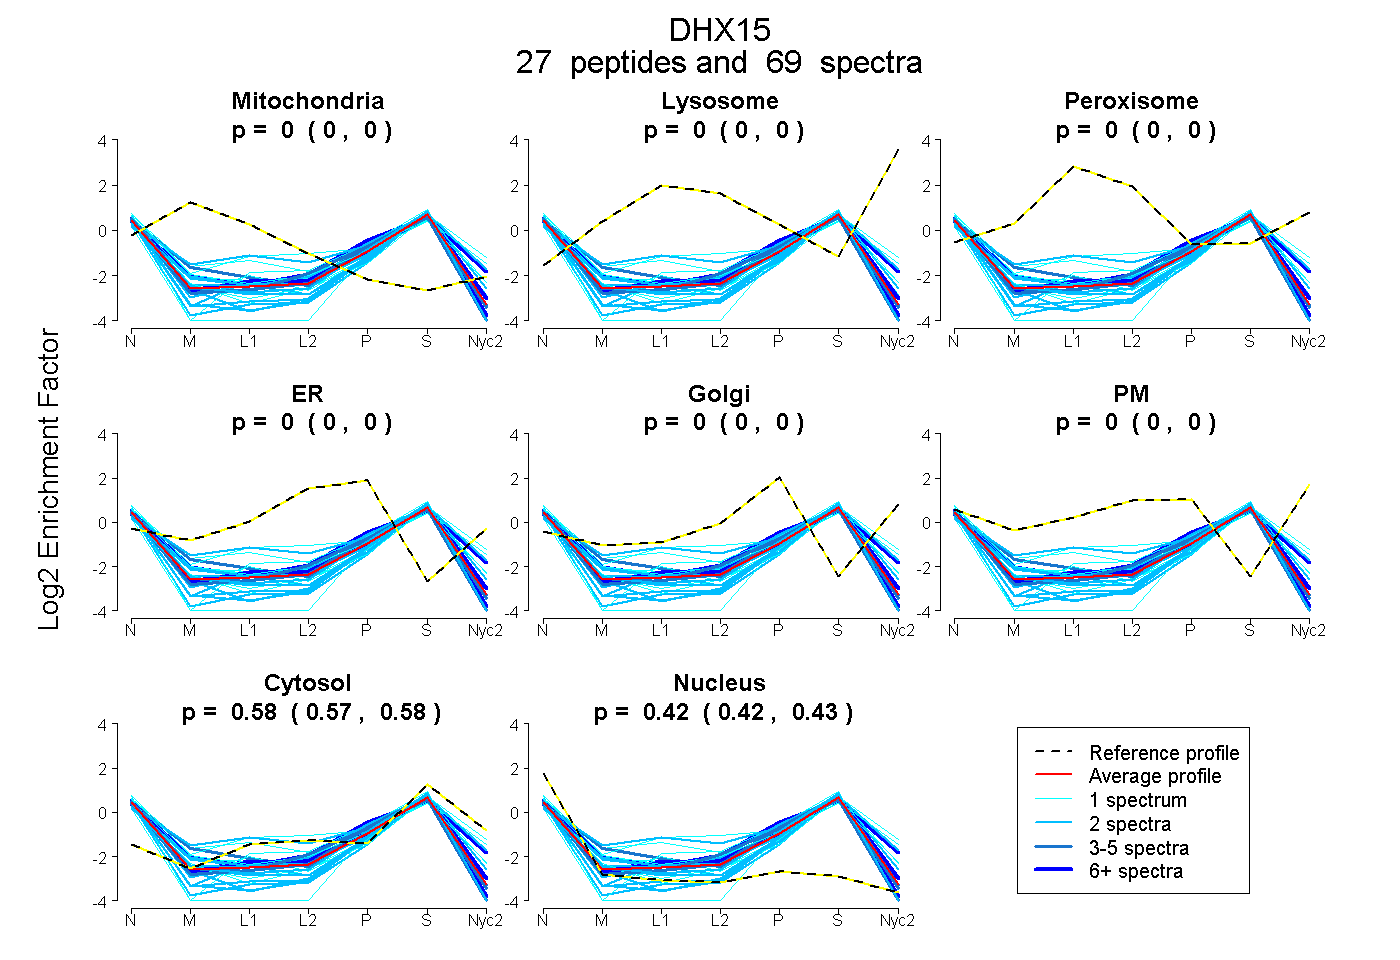
0.000 | 0.000
0.000 | 0.000
0.000 | 0.000
0.000 | 0.000
0.000 | 0.000
0.000 | 0.000
0.573 | 0.578
0.421 | 0.427
| Plot | Mito | Lyso | Perox | ER | Golgi | PM | Cytosol | Nucleus | |||||
| Expt A |
27 peptides |
69 spectra |
|
0.000 0.000 | 0.000 |
0.000 0.000 | 0.000 |
0.000 0.000 | 0.000 |
0.000 0.000 | 0.000 |
0.000 0.000 | 0.000 |
0.000 0.000 | 0.000 |
0.576 0.573 | 0.578 |
0.424 0.421 | 0.427 |
| 5 spectra, VAAMSVAQR | 0.000 | 0.000 | 0.000 | 0.000 | 0.000 | 0.000 | 0.575 | 0.425 | ||
| 1 spectrum, FNLPR | 0.000 | 0.000 | 0.000 | 0.000 | 0.000 | 0.000 | 0.524 | 0.476 | ||
| 4 spectra, YGVIILDEAHER | 0.000 | 0.000 | 0.000 | 0.000 | 0.000 | 0.000 | 0.565 | 0.435 | ||
| 2 spectra, THPVEIFYTPEPER | 0.144 | 0.000 | 0.000 | 0.064 | 0.000 | 0.000 | 0.540 | 0.251 | ||
| 1 spectrum, LDLGEDYPSGK | 0.000 | 0.000 | 0.000 | 0.000 | 0.000 | 0.000 | 0.620 | 0.380 | ||
| 2 spectra, DYYINIR | 0.000 | 0.000 | 0.000 | 0.000 | 0.000 | 0.000 | 0.462 | 0.538 | ||
| 1 spectrum, LQLPVWEYK | 0.000 | 0.000 | 0.000 | 0.000 | 0.000 | 0.000 | 0.550 | 0.450 | ||
| 6 spectra, ALVTGYFMQVAHLER | 0.000 | 0.000 | 0.000 | 0.000 | 0.113 | 0.000 | 0.600 | 0.287 | ||
| 1 spectrum, TCTDIKPEWLVK | 0.000 | 0.000 | 0.000 | 0.000 | 0.000 | 0.000 | 0.582 | 0.418 | ||
| 2 spectra, YYDILK | 0.000 | 0.000 | 0.000 | 0.000 | 0.000 | 0.000 | 0.470 | 0.530 | ||
| 2 spectra, TTQIPQWCVEYMR | 0.000 | 0.000 | 0.000 | 0.000 | 0.000 | 0.000 | 0.501 | 0.499 | ||
| 2 spectra, DYLEAAIR | 0.000 | 0.000 | 0.000 | 0.000 | 0.000 | 0.000 | 0.527 | 0.473 | ||
| 1 spectrum, VESLLVTAISK | 0.000 | 0.000 | 0.000 | 0.002 | 0.051 | 0.000 | 0.568 | 0.379 | ||
| 1 spectrum, EVDDLGPEVGDIK | 0.000 | 0.000 | 0.000 | 0.000 | 0.000 | 0.000 | 0.362 | 0.638 | ||
| 2 spectra, IFEPPPPK | 0.000 | 0.000 | 0.000 | 0.000 | 0.000 | 0.000 | 0.623 | 0.377 | ||
| 11 spectra, EAMNDPLLER | 0.000 | 0.000 | 0.000 | 0.000 | 0.000 | 0.000 | 0.553 | 0.447 | ||
| 1 spectrum, STDFTSR | 0.000 | 0.000 | 0.123 | 0.044 | 0.000 | 0.052 | 0.544 | 0.237 | ||
| 1 spectrum, AADEAK | 0.086 | 0.000 | 0.041 | 0.026 | 0.000 | 0.000 | 0.521 | 0.327 | ||
| 2 spectra, LGIDDLVHFDFMDPPAPETLMR | 0.000 | 0.000 | 0.000 | 0.000 | 0.000 | 0.000 | 0.490 | 0.510 | ||
| 2 spectra, SLPGPK | 0.000 | 0.000 | 0.000 | 0.000 | 0.000 | 0.000 | 0.599 | 0.401 | ||
| 2 spectra, FEDCSSAK | 0.000 | 0.000 | 0.000 | 0.000 | 0.000 | 0.000 | 0.696 | 0.304 | ||
| 3 spectra, GVACTQPR | 0.036 | 0.000 | 0.000 | 0.000 | 0.000 | 0.000 | 0.512 | 0.452 | ||
| 2 spectra, YMTDGMLLR | 0.000 | 0.000 | 0.000 | 0.000 | 0.000 | 0.000 | 0.540 | 0.460 | ||
| 1 spectrum, TLATDILMGVLK | 0.000 | 0.000 | 0.000 | 0.000 | 0.000 | 0.000 | 0.667 | 0.333 | ||
| 2 spectra, TEMQDNTYPEILR | 0.000 | 0.000 | 0.000 | 0.000 | 0.000 | 0.000 | 0.598 | 0.402 | ||
| 7 spectra, SLMSADNVR | 0.000 | 0.000 | 0.000 | 0.000 | 0.000 | 0.000 | 0.597 | 0.403 | ||
| 2 spectra, FTDILVR | 0.000 | 0.000 | 0.000 | 0.000 | 0.000 | 0.000 | 0.431 | 0.569 |
| Plot | Mito | Lyso or Perox | ER | Golgi | PM | Cytosol | Nucleus | ||||||
| Expt B |
6 peptides |
11 spectra |
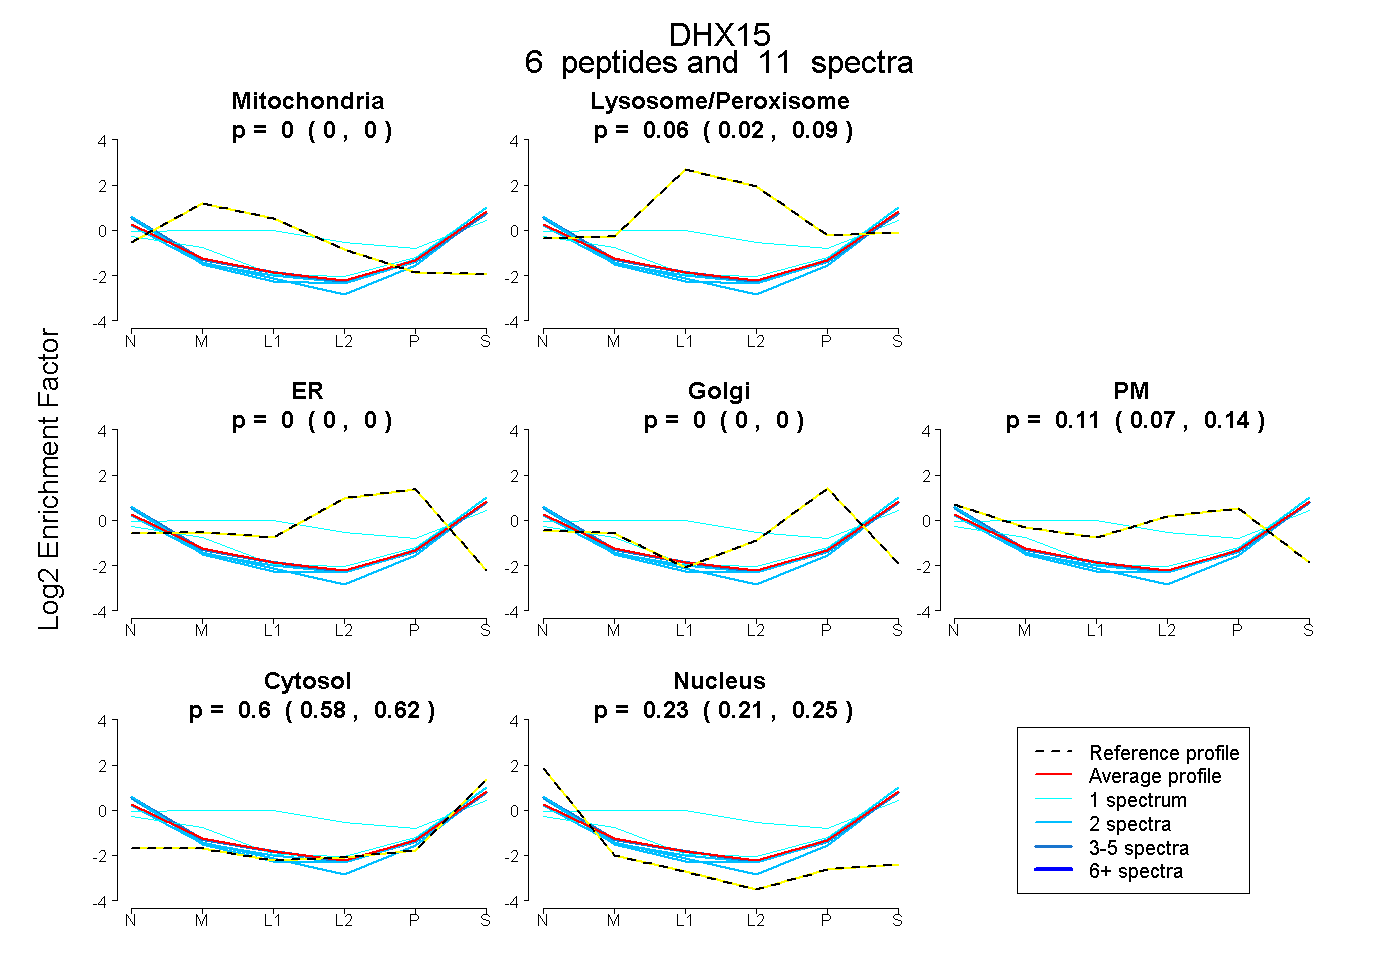 |
0.000 0.000 | 0.000 |
0.057 0.022 | 0.088 |
0.000 0.000 | 0.000 |
0.000 0.000 | 0.000 |
0.108 0.069 | 0.140 |
0.600 0.579 | 0.618 |
0.235 0.209 | 0.254 |
|||
| Plot | Lyso | Other | |||||||||||
| Expt C |
11 peptides |
22 spectra |
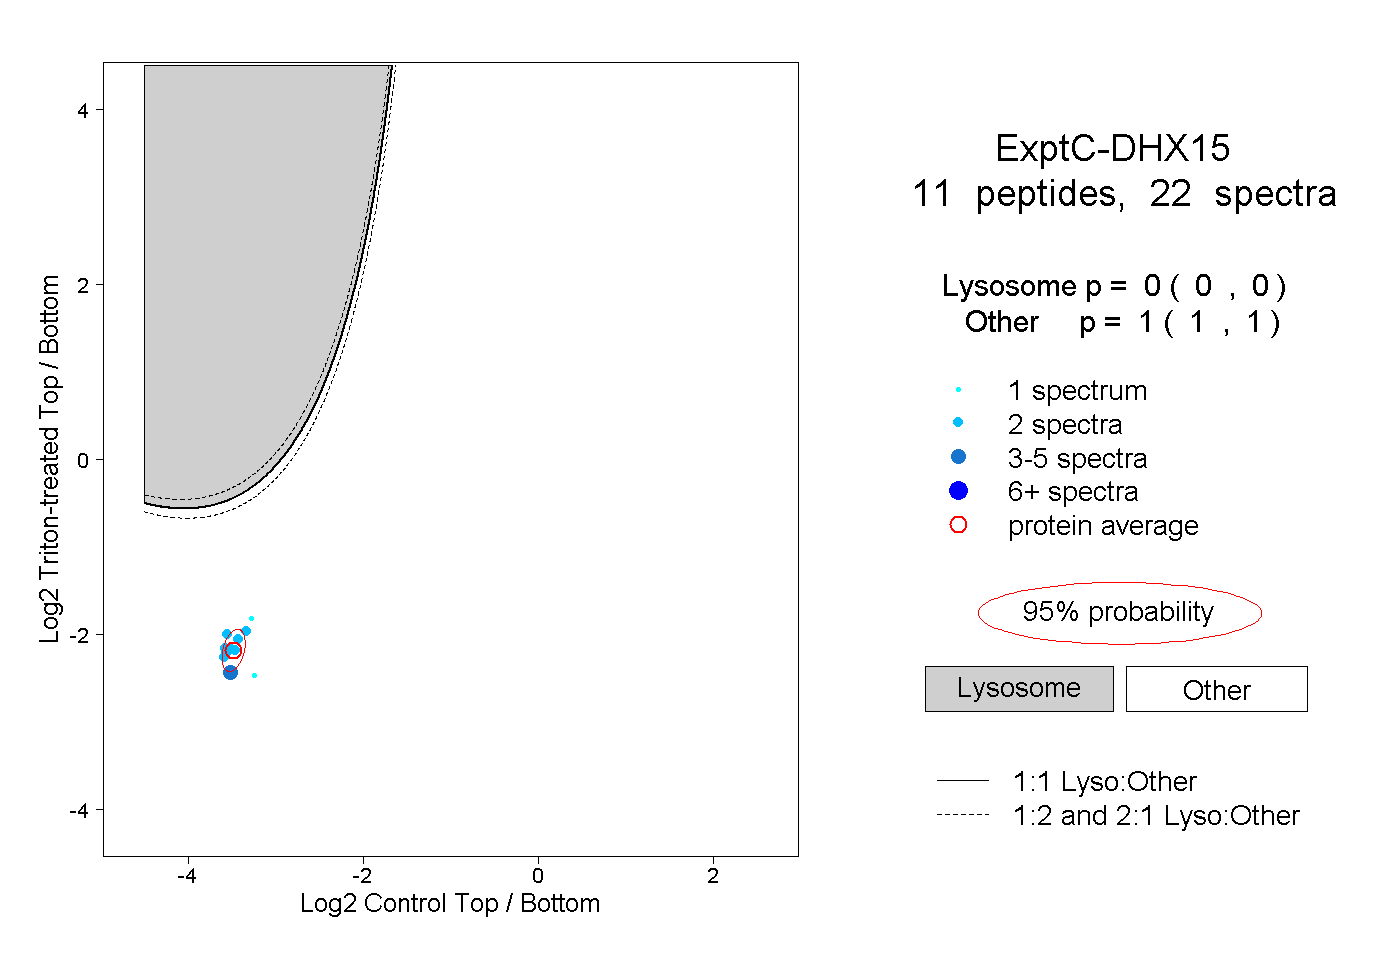 |
0.000 0.000 | 0.000 |
1.000 1.000 | 1.000 |
||||||||
| Plot | Lyso | Other | |||||||||||
| Expt D |
1 peptide |
1 spectrum |
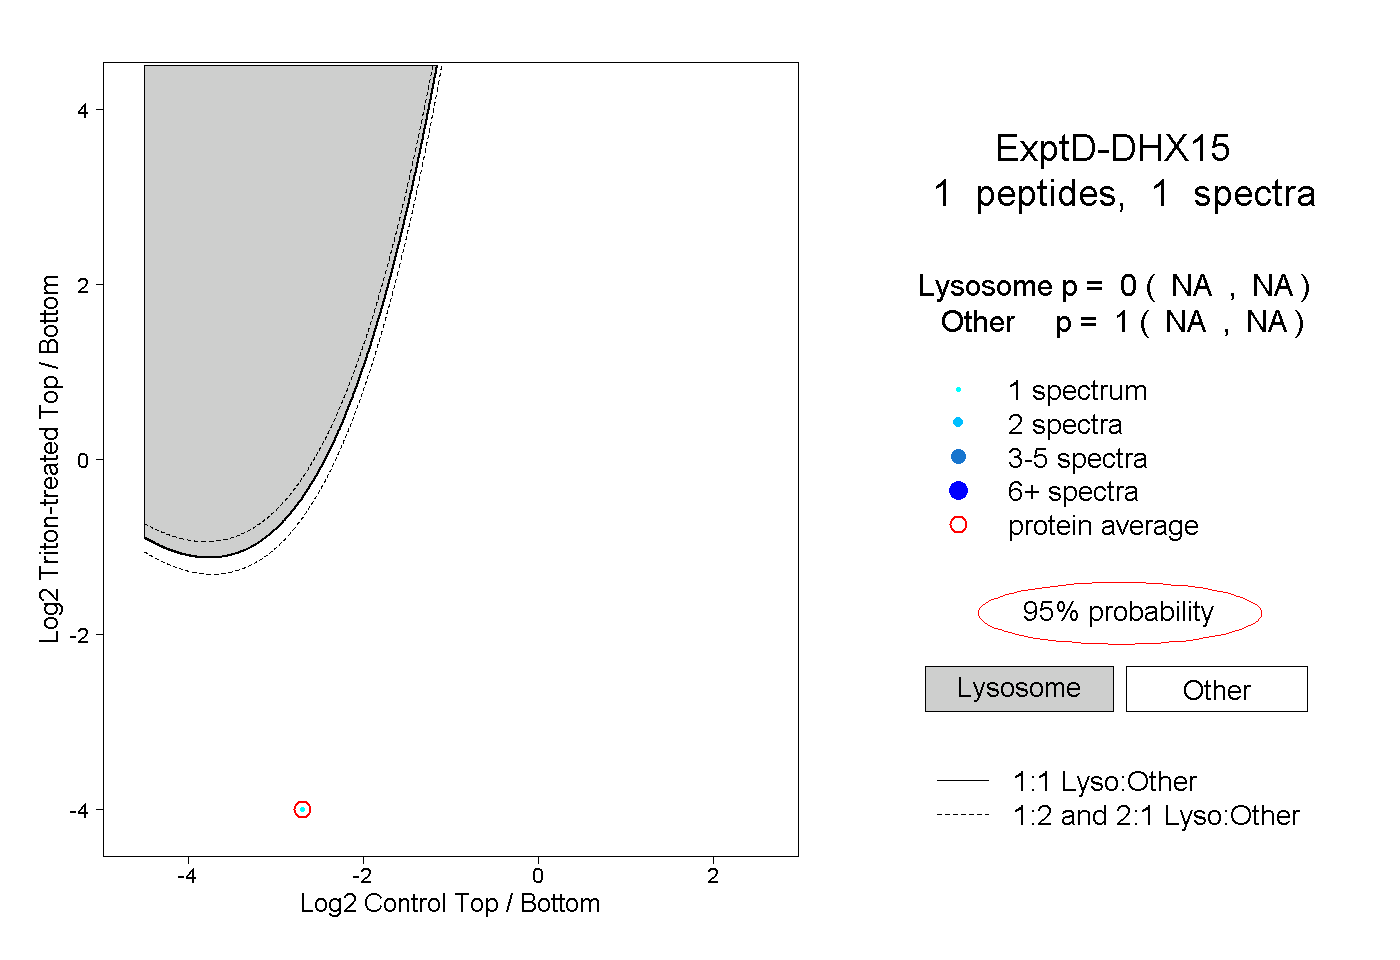 |
0.000 NA | NA |
1.000 NA | NA |