 11
11peptides
spectra
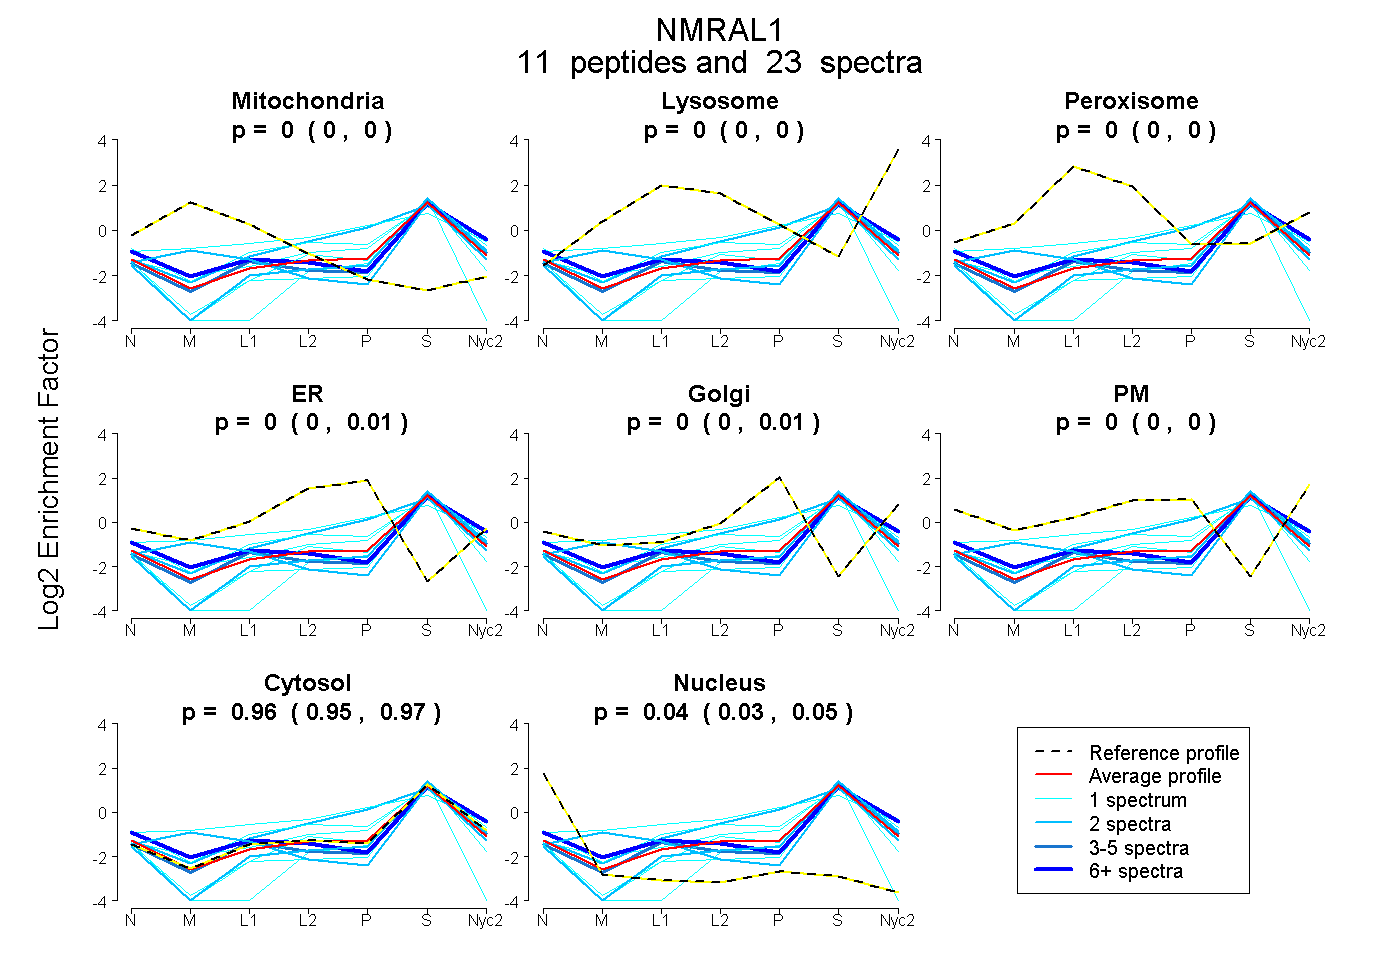
0.000 | 0.000
0.000 | 0.000
0.000 | 0.000
0.000 | 0.005
0.000 | 0.005
0.000 | 0.000
0.949 | 0.967
0.029 | 0.049
4peptides
spectra
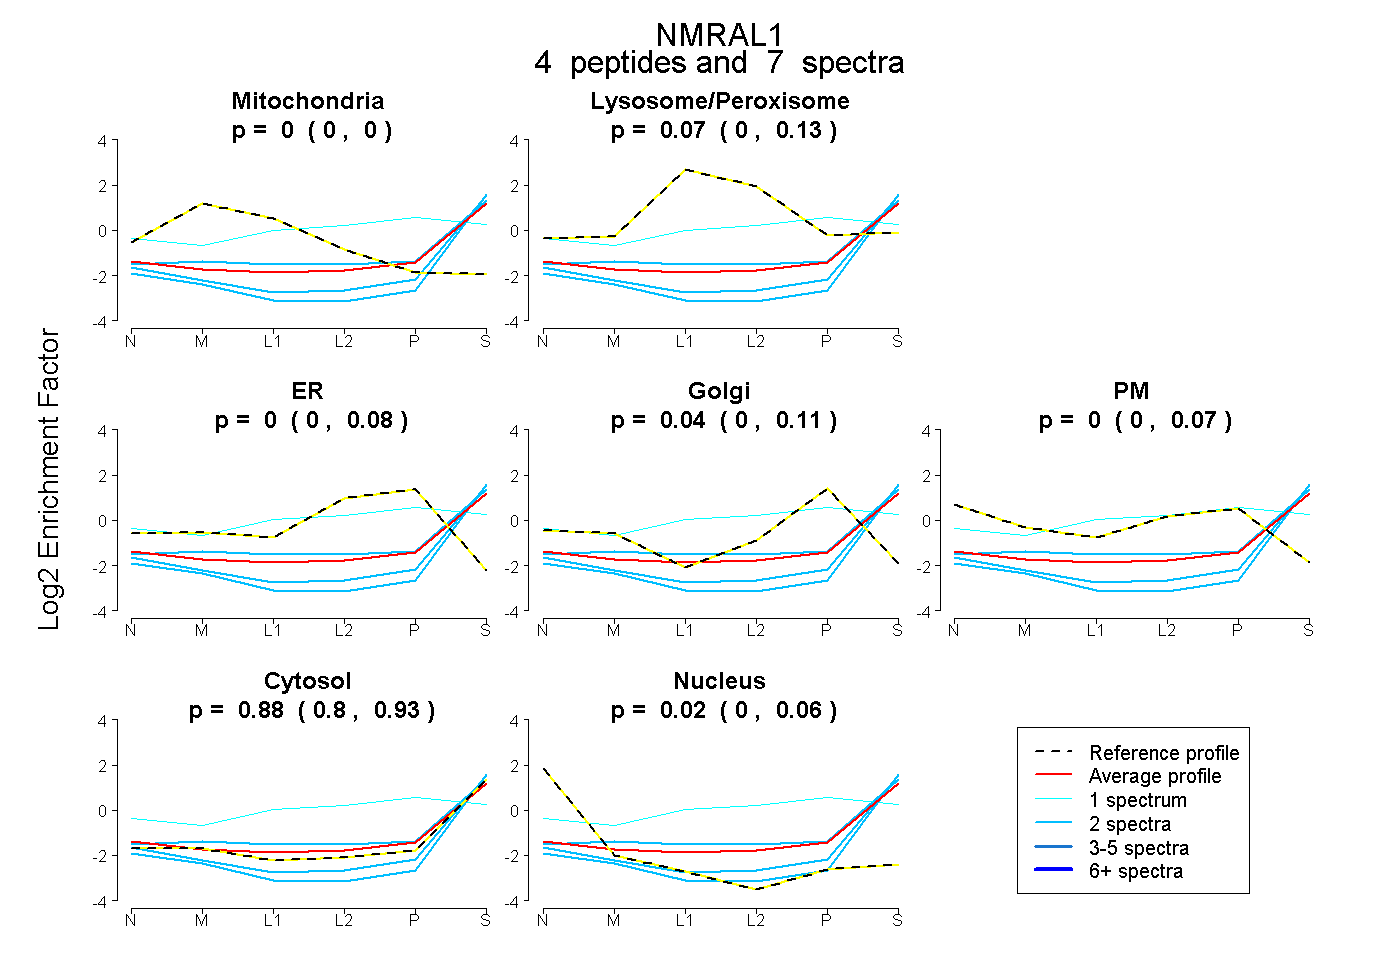
0.000 | 0.000
0.000 | 0.130
0.000 | 0.083
0.000 | 0.113
0.000 | 0.069
0.799 | 0.925
0.000 | 0.061
7peptides
spectra
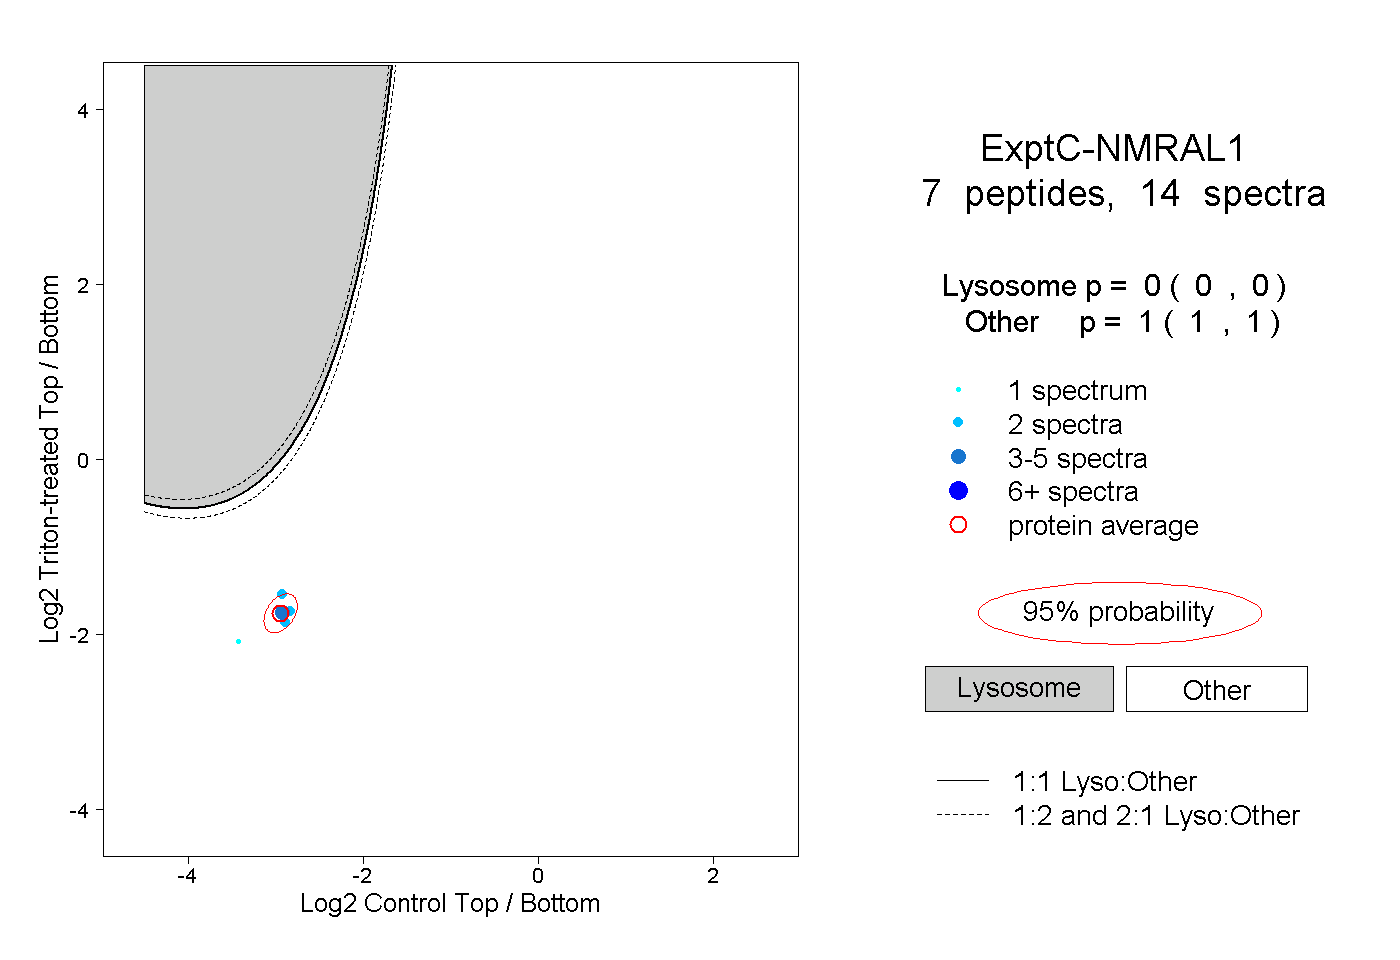
0.000 | 0.000
1.000 | 1.000