NMRAL1
[ENSRNOP00000005109]
Main page
| | | Plot |
Mito |
Lyso |
|
Perox |
ER |
Golgi |
PM |
Cytosol |
Nucleus |
|
| Expt A |
 11
11
peptides |
23
spectra |
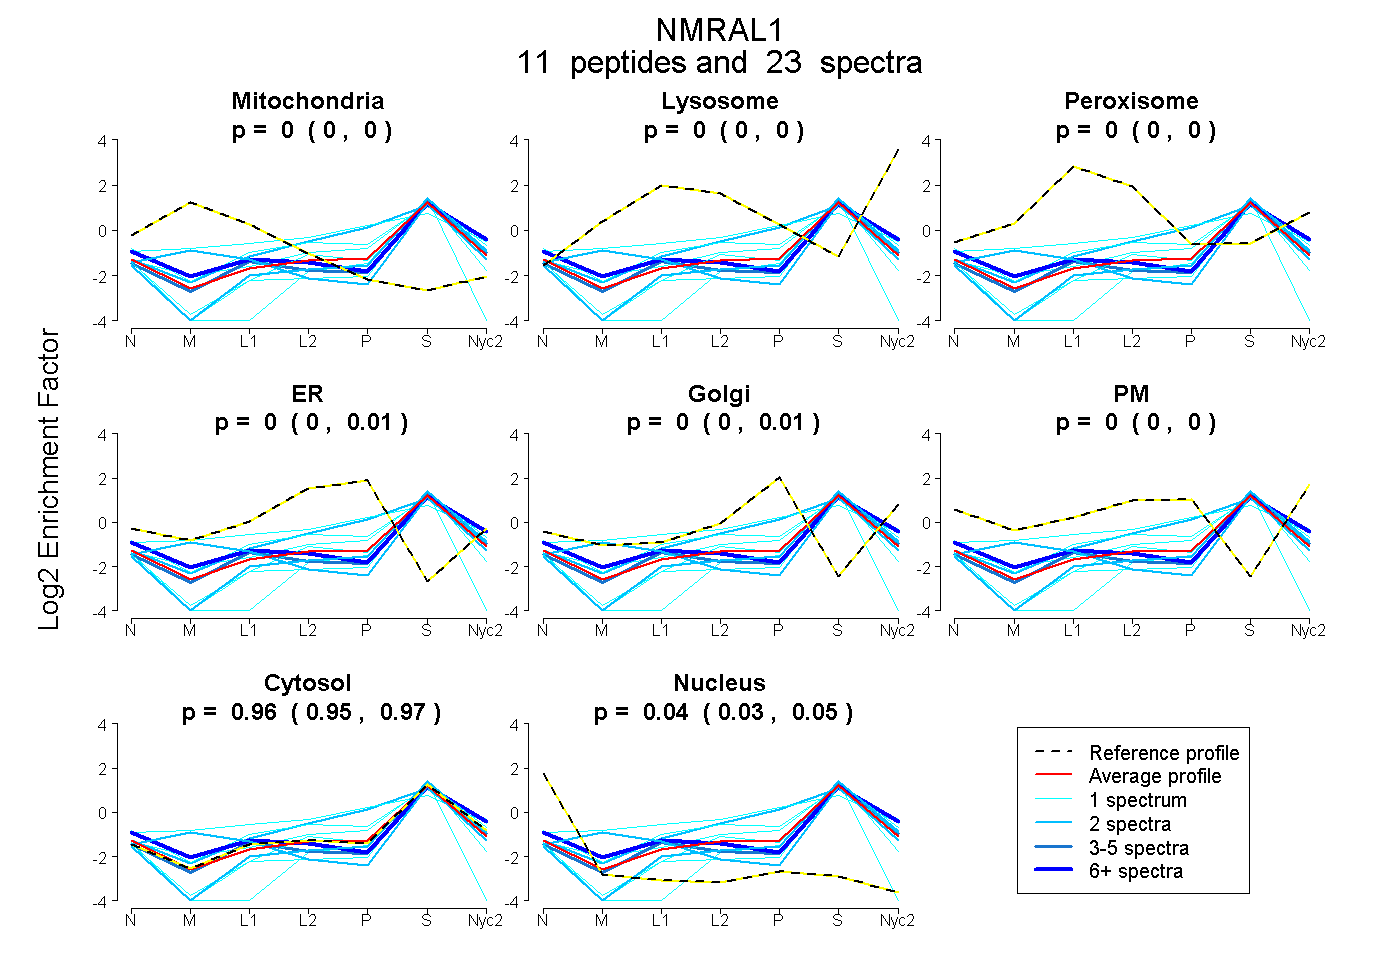 |
0.000
0.000 | 0.000 |
0.000
0.000 | 0.000 |
|
0.000
0.000 | 0.000 |
0.000
0.000 | 0.005 |
0.000
0.000 | 0.005 |
0.000
0.000 | 0.000 |
0.961
0.949 | 0.967 |
0.039
0.029 | 0.049 |
|
| | | Plot |
Mito |
|
Lyso or Perox |
|
ER |
Golgi |
PM |
Cytosol |
Nucleus |
|
| Expt B |
4
peptides |
7
spectra |
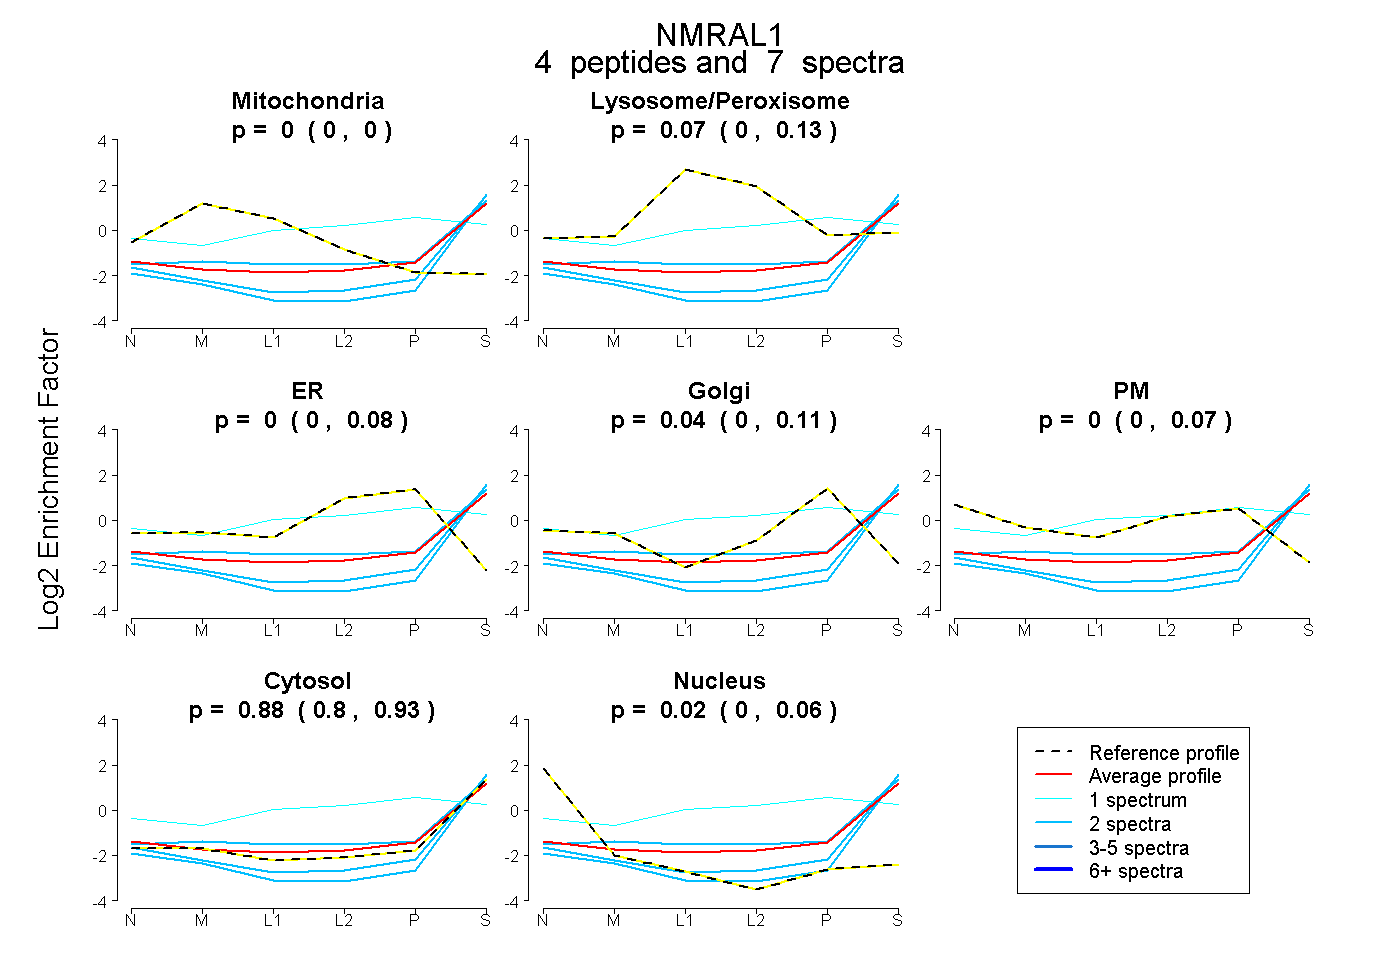 |
0.000
0.000 | 0.000 |
|
0.070
0.000 | 0.130 |
|
0.000
0.000 | 0.083 |
0.039
0.000 | 0.113 |
0.000
0.000 | 0.069 |
0.875
0.799 | 0.925 |
0.015
0.000 | 0.061 |
|
| 2 spectra, NIDLTLR |
0.000 |
|
0.000 |
|
0.000 |
0.000 |
0.000 |
0.959 |
0.041 |
|
| 1 spectrum, HIGVPMTSVR |
0.000 |
|
0.462 |
|
0.000 |
0.330 |
0.000 |
0.208 |
0.000 |
|
| 2 spectra, FYALKPDR |
0.000 |
|
0.145 |
|
0.000 |
0.000 |
0.000 |
0.855 |
0.000 |
|
| 2 spectra, TLLEDGTFR |
0.000 |
|
0.000 |
|
0.000 |
0.000 |
0.000 |
0.961 |
0.039 |
|
| | | Plot |
|
Lyso |
|
|
|
|
|
|
|
Other |
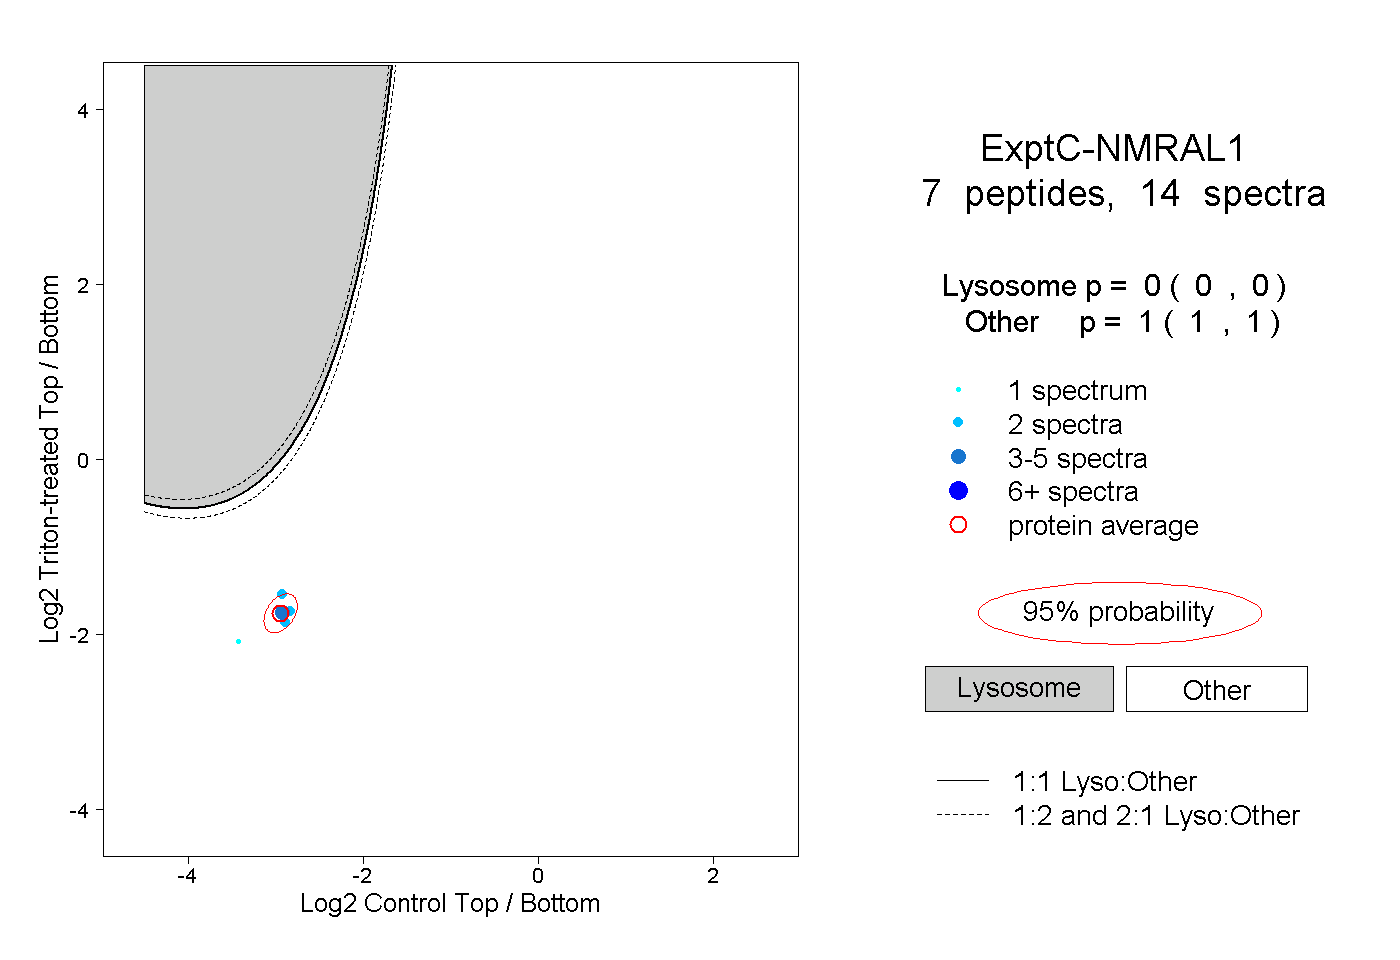
| Expt C |
7
peptides |
14
spectra |
 |
|
0.000
0.000 | 0.000 |
|
|
|
|
|
|
|
1.000
1.000 | 1.000 |