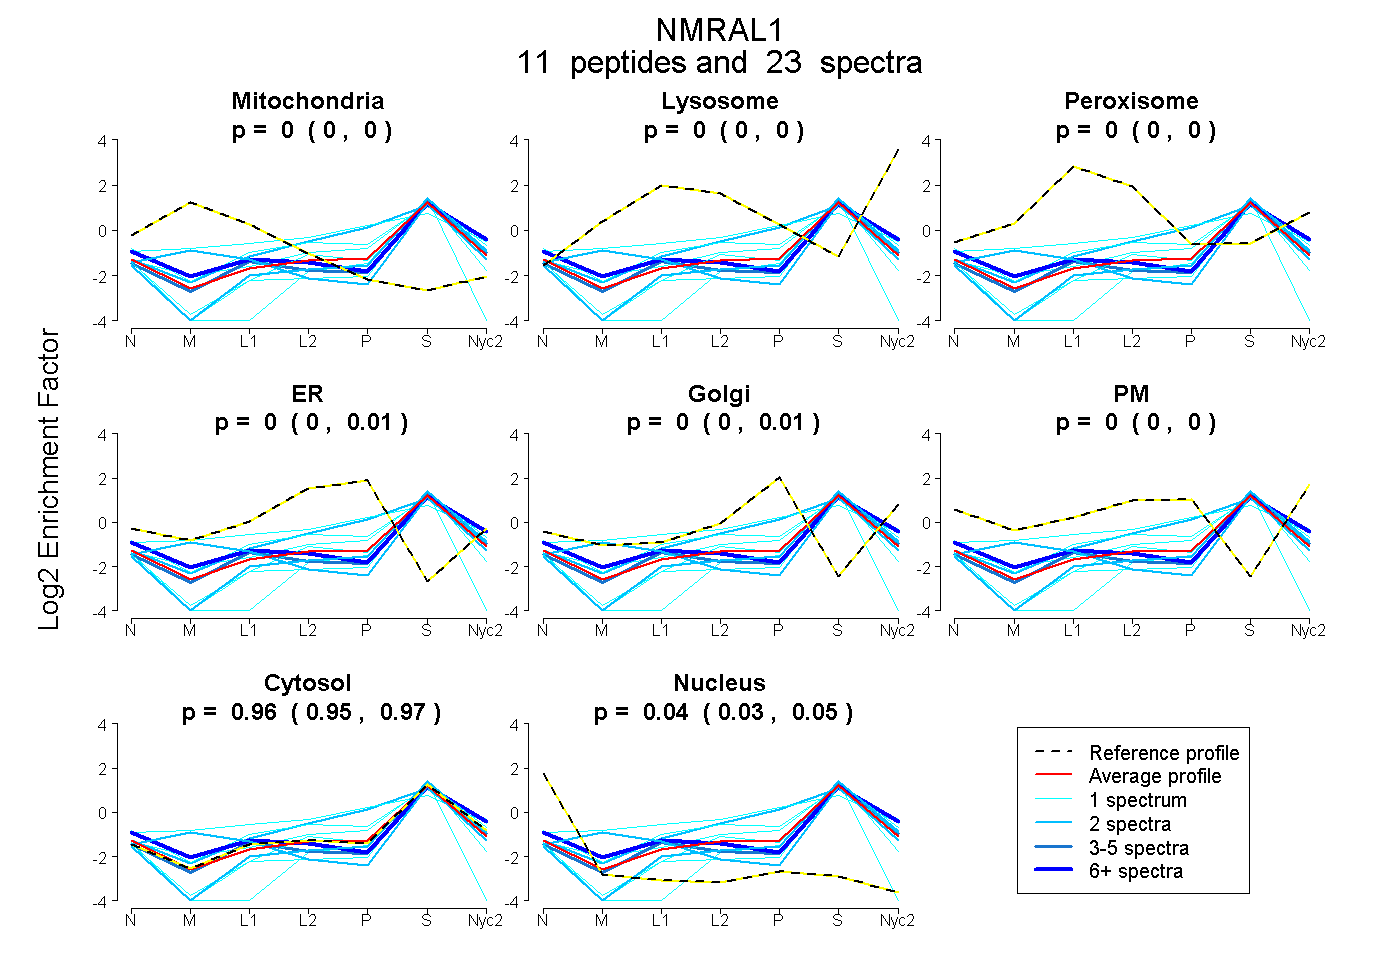
 11
11peptides
spectra
0.000 | 0.000
0.000 | 0.000
0.000 | 0.000
0.000 | 0.005
0.000 | 0.005
0.000 | 0.000
0.949 | 0.967
0.029 | 0.049
| Plot | Mito | Lyso | Perox | ER | Golgi | PM | Cytosol | Nucleus | |||||
| Expt A |
11 peptides |
23 spectra |
|
0.000 0.000 | 0.000 |
0.000 0.000 | 0.000 |
0.000 0.000 | 0.000 |
0.000 0.000 | 0.005 |
0.000 0.000 | 0.005 |
0.000 0.000 | 0.000 |
0.961 0.949 | 0.967 |
0.039 0.029 | 0.049 |
| 1 spectrum, LAAGHFDGK | 0.000 | 0.000 | 0.060 | 0.066 | 0.000 | 0.063 | 0.811 | 0.000 | ||
| 6 spectra, LLADLAK | 0.040 | 0.044 | 0.000 | 0.000 | 0.000 | 0.000 | 0.893 | 0.024 | ||
| 1 spectrum, FYALKPDR | 0.000 | 0.047 | 0.000 | 0.000 | 0.082 | 0.000 | 0.871 | 0.000 | ||
| 2 spectra, TLLEDGTFR | 0.000 | 0.000 | 0.000 | 0.000 | 0.000 | 0.000 | 0.966 | 0.034 | ||
| 5 spectra, GEVEEYFR | 0.000 | 0.000 | 0.000 | 0.000 | 0.000 | 0.000 | 0.967 | 0.033 | ||
| 1 spectrum, HTAEEYAALLSK | 0.000 | 0.000 | 0.201 | 0.052 | 0.186 | 0.000 | 0.560 | 0.000 | ||
| 1 spectrum, KPEEYIGQNVGLSTCR | 0.000 | 0.000 | 0.000 | 0.000 | 0.000 | 0.000 | 0.866 | 0.134 | ||
| 1 spectrum, NIDLTLR | 0.000 | 0.000 | 0.000 | 0.000 | 0.000 | 0.000 | 0.994 | 0.006 | ||
| 2 spectra, TTPEEYEK | 0.218 | 0.000 | 0.000 | 0.000 | 0.000 | 0.000 | 0.782 | 0.000 | ||
| 2 spectra, HIGVPMTSVR | 0.000 | 0.000 | 0.000 | 0.214 | 0.000 | 0.000 | 0.786 | 0.000 | ||
| 1 spectrum, AQTLDQWLEQHK | 0.000 | 0.000 | 0.000 | 0.000 | 0.000 | 0.000 | 0.671 | 0.329 |
| Plot | Mito | Lyso or Perox | ER | Golgi | PM | Cytosol | Nucleus | ||||||
| Expt B |
4 peptides |
7 spectra |
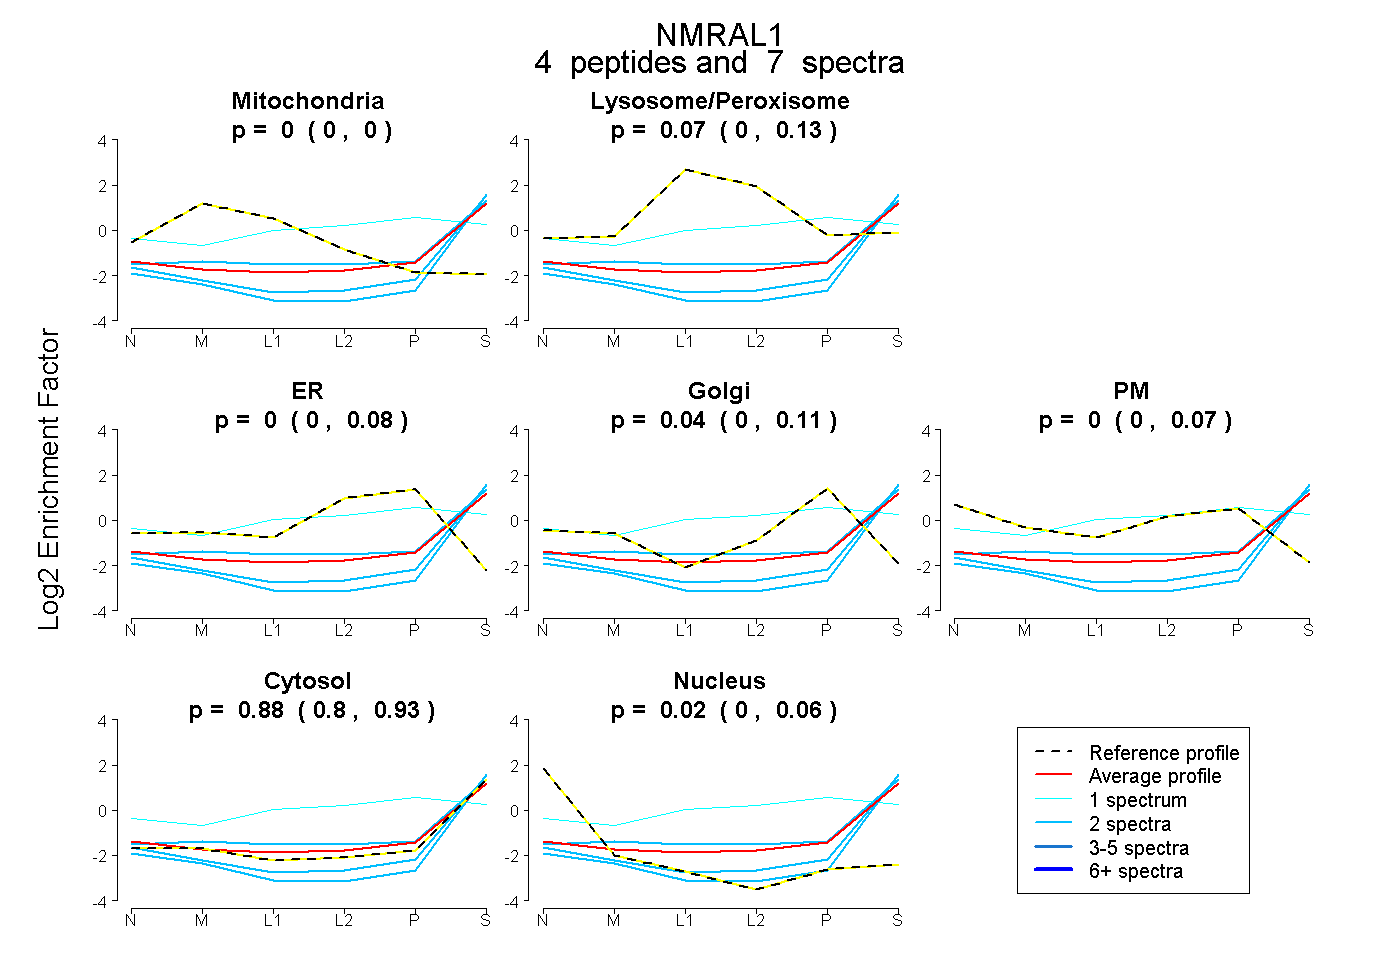 |
0.000 0.000 | 0.000 |
0.070 0.000 | 0.130 |
0.000 0.000 | 0.083 |
0.039 0.000 | 0.113 |
0.000 0.000 | 0.069 |
0.875 0.799 | 0.925 |
0.015 0.000 | 0.061 |
|||
| Plot | Lyso | Other | |||||||||||
| Expt C |
7 peptides |
14 spectra |
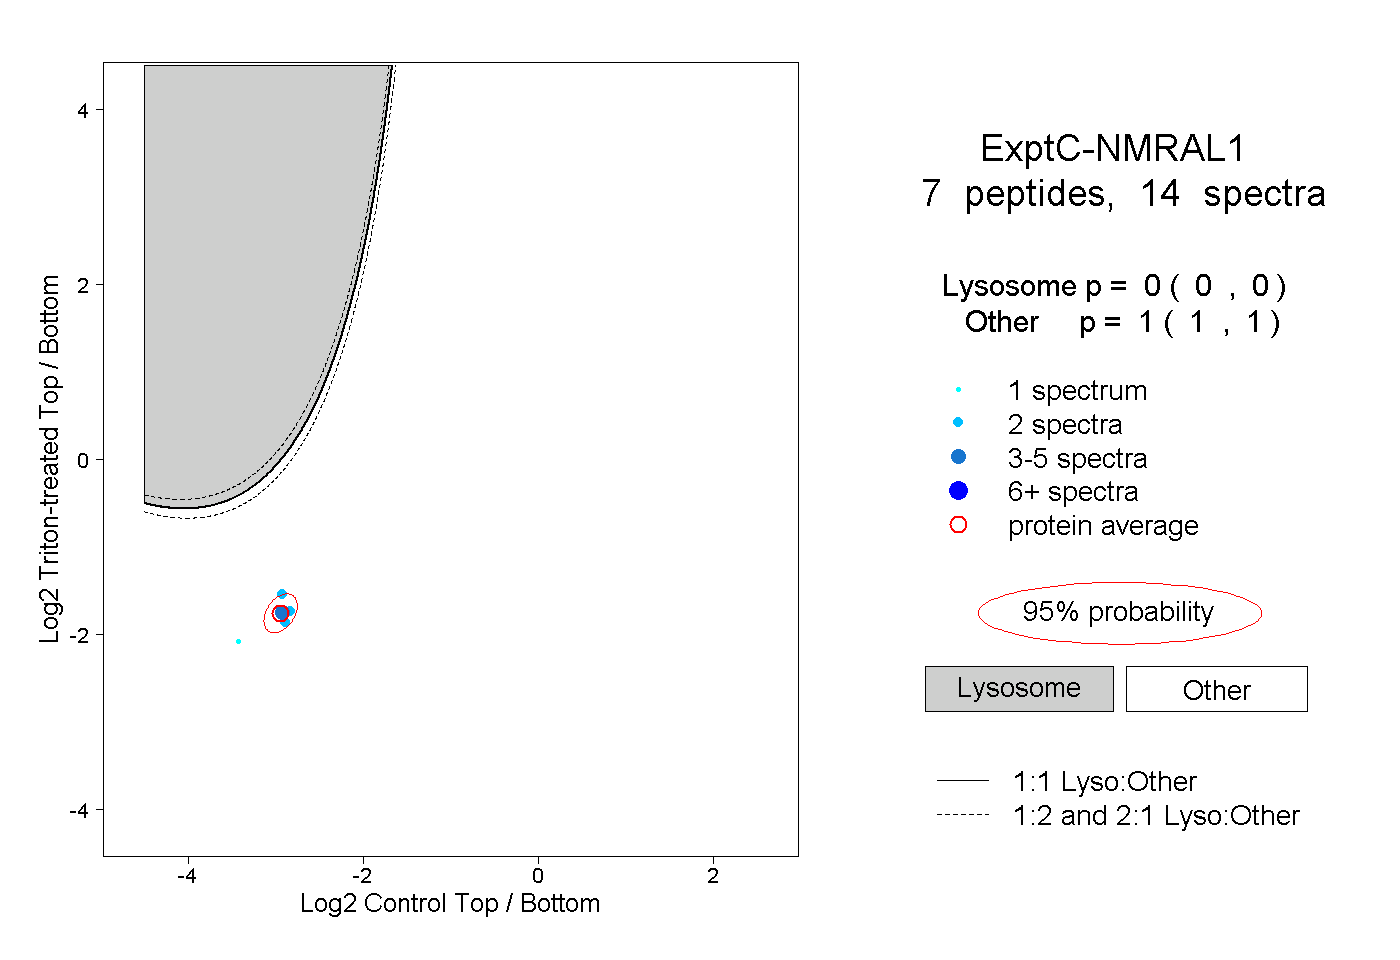 |
0.000 0.000 | 0.000 |
1.000 1.000 | 1.000 |