 11
11peptides
spectra
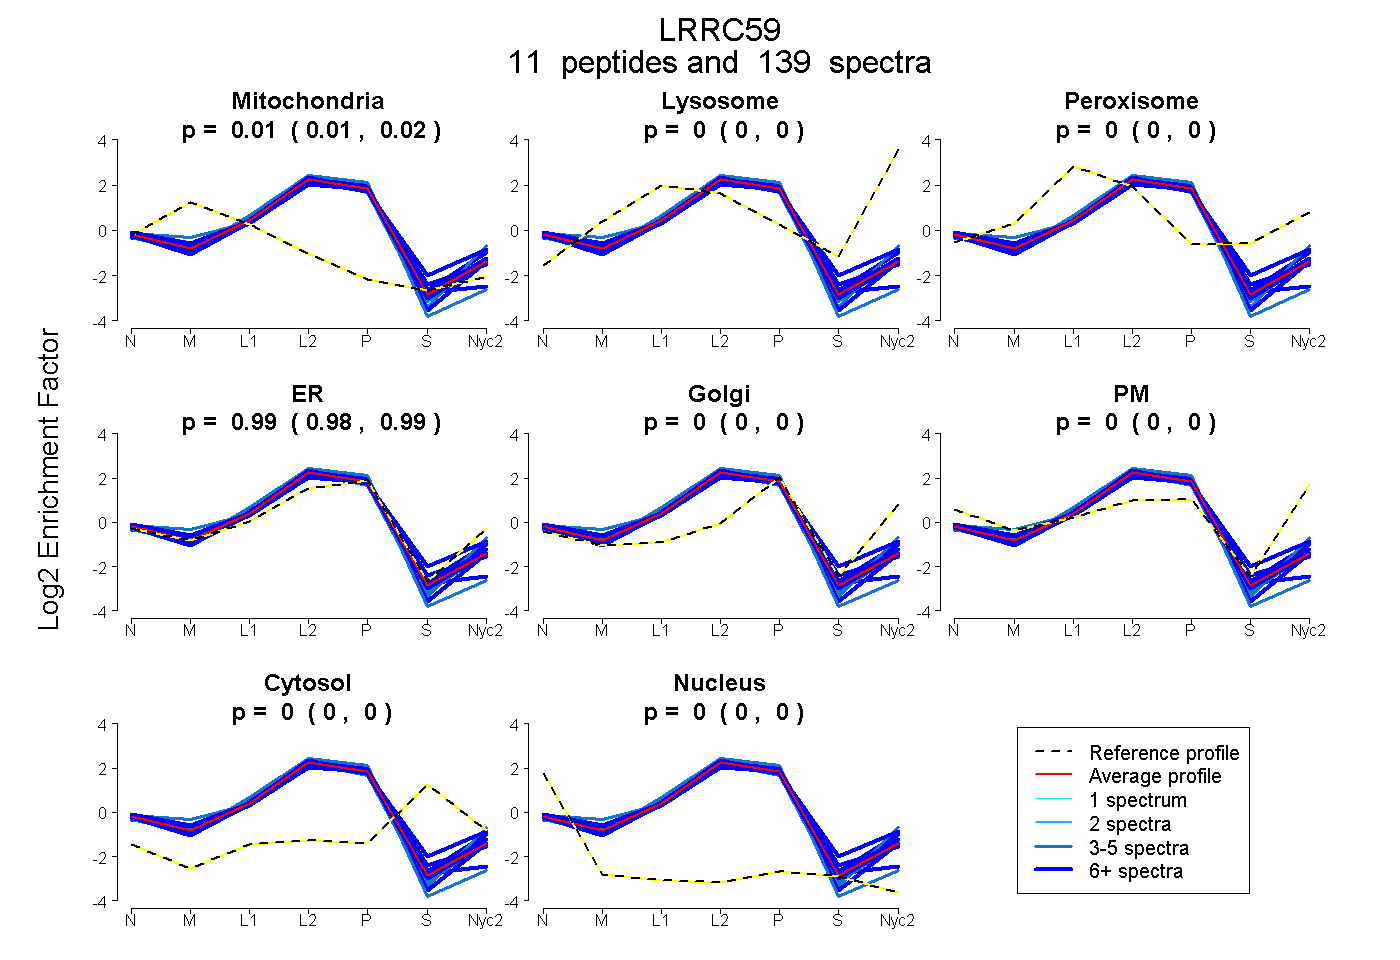
0.013 | 0.015
0.000 | 0.000
0.000 | 0.000
0.984 | 0.987
0.000 | 0.000
0.000 | 0.000
0.000 | 0.000
0.000 | 0.000
9peptides
spectra
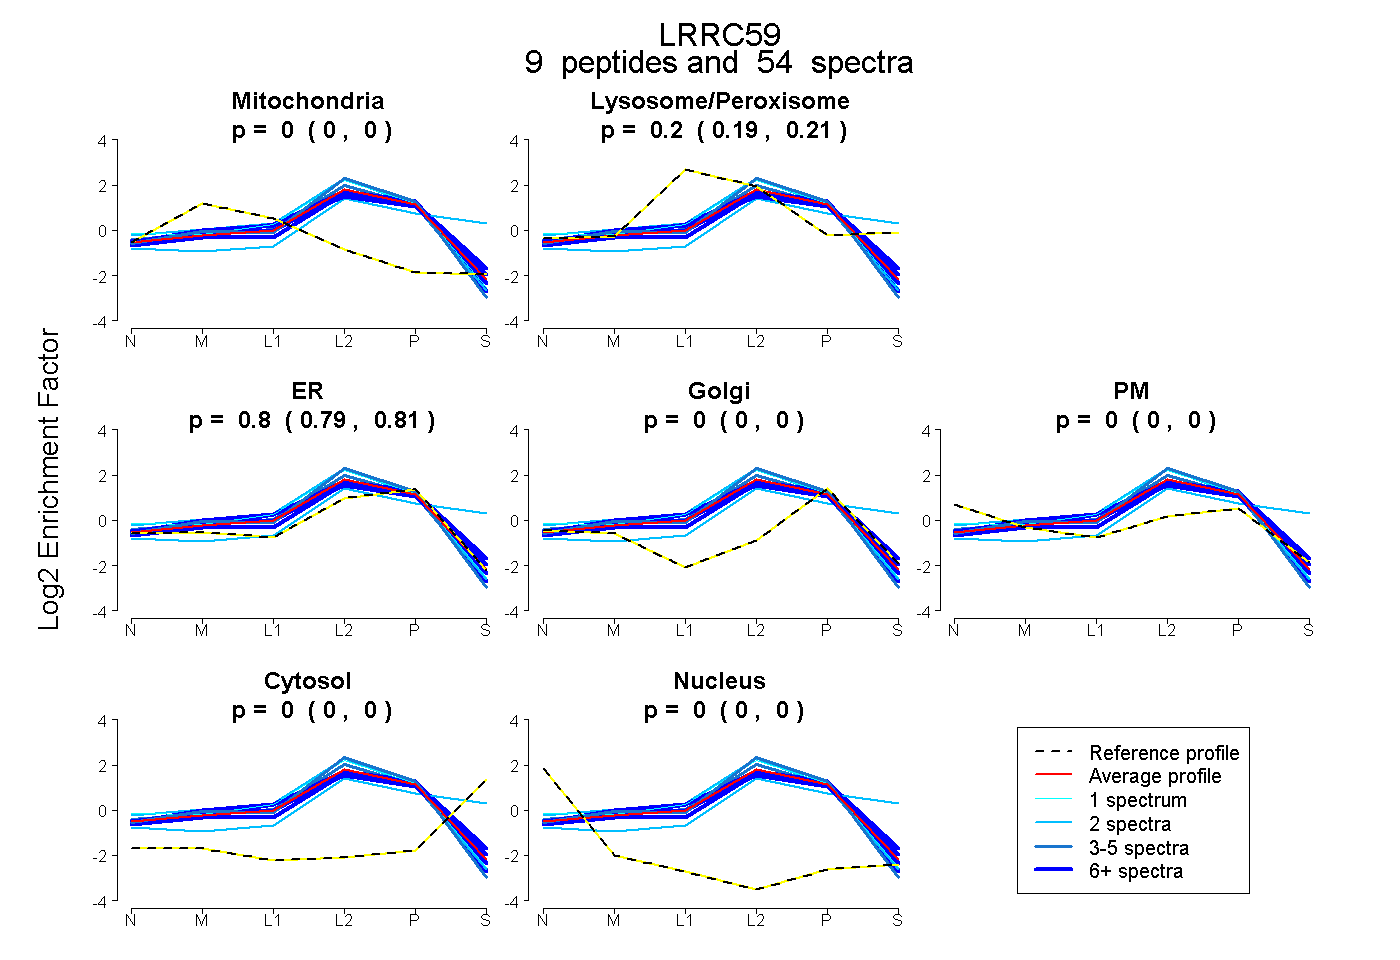
0.000 | 0.000
0.193 | 0.208
0.791 | 0.805
0.000 | 0.000
0.000 | 0.000
0.000 | 0.000
0.000 | 0.000
13peptides
spectra
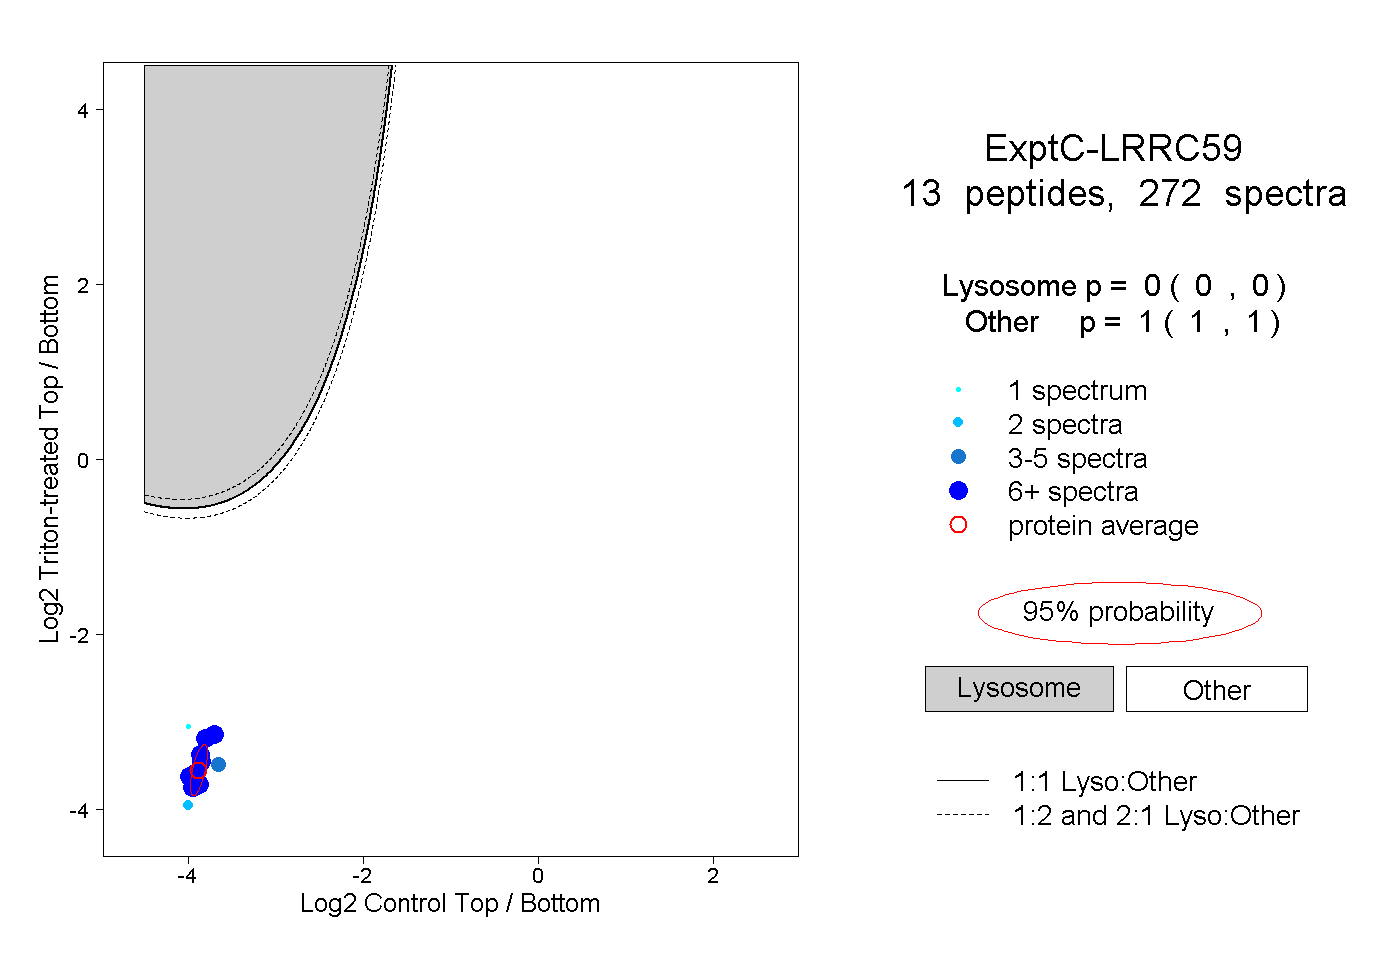
0.000 | 0.000
1.000 | 1.000
7peptides
spectra
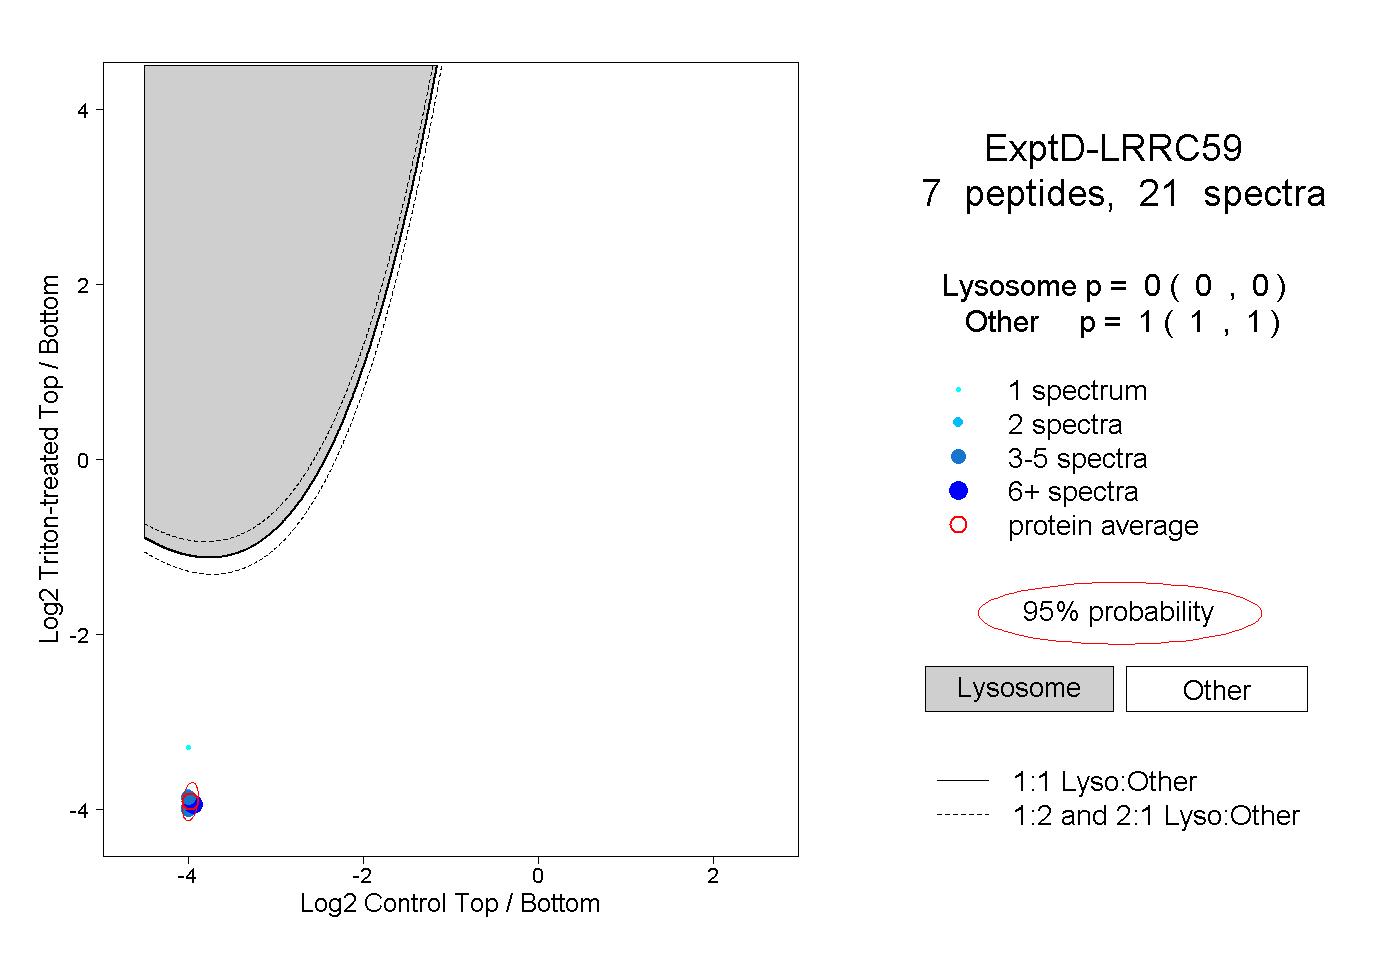
0.000 | 0.000
1.000 | 1.000