 11
11peptides
spectra
0.013 | 0.015
0.000 | 0.000
0.000 | 0.000
0.984 | 0.987
0.000 | 0.000
0.000 | 0.000
0.000 | 0.000
0.000 | 0.000
| Plot | Mito | Lyso | Perox | ER | Golgi | PM | Cytosol | Nucleus | |||||
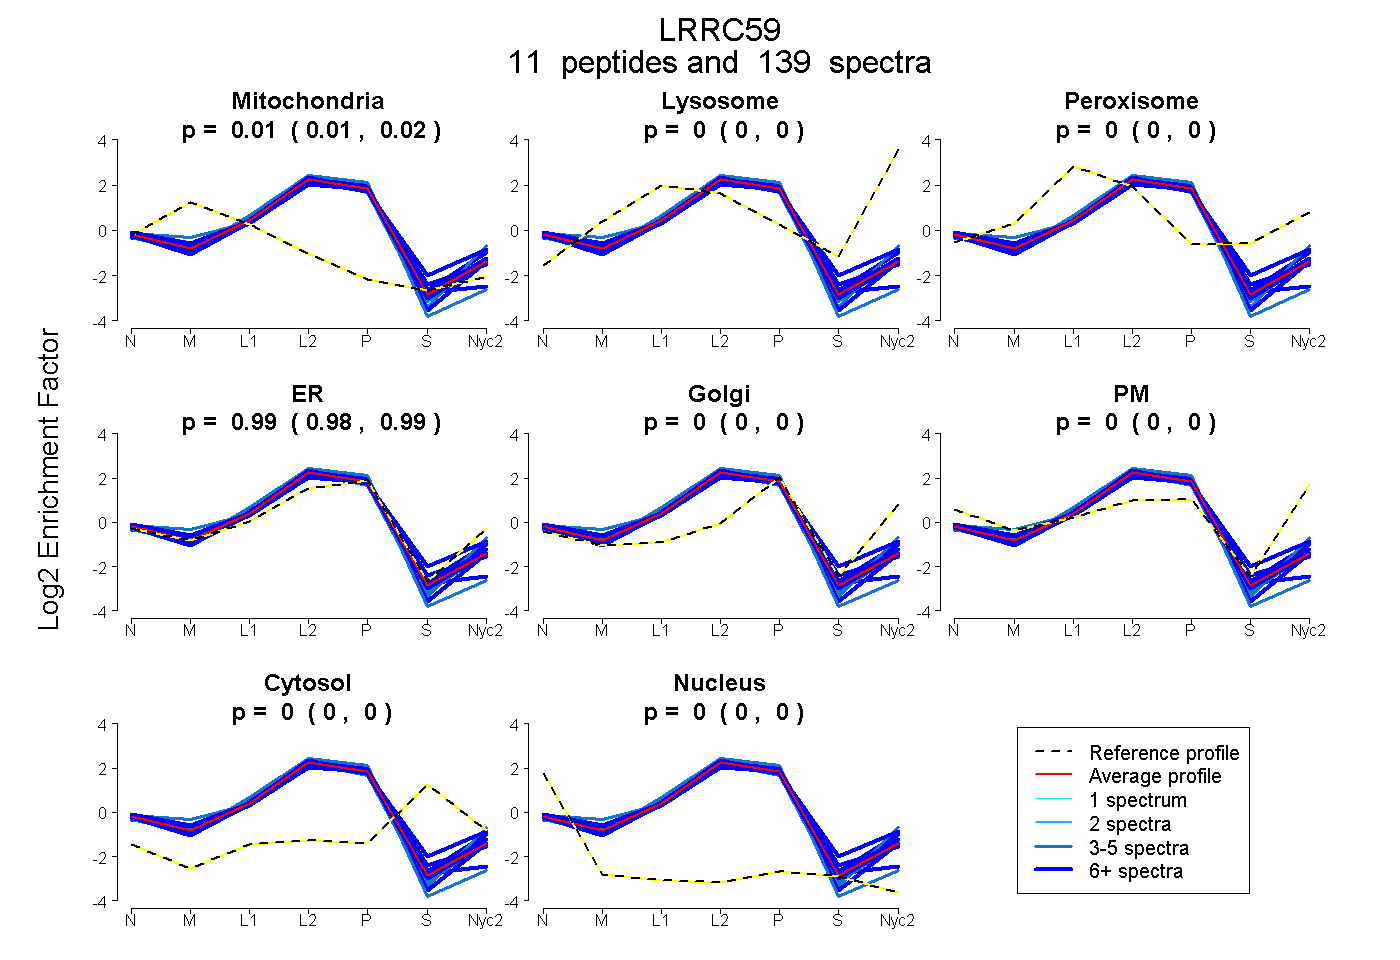
| Expt A |
11 peptides |
139 spectra |
|
0.014 0.013 | 0.015 |
0.000 0.000 | 0.000 |
0.000 0.000 | 0.000 |
0.986 0.984 | 0.987 |
0.000 0.000 | 0.000 |
0.000 0.000 | 0.000 |
0.000 0.000 | 0.000 |
0.000 0.000 | 0.000 |
| 21 spectra, VAGDCLDEK | 0.036 | 0.000 | 0.000 | 0.956 | 0.000 | 0.000 | 0.000 | 0.008 | ||
| 15 spectra, EYDAQK | 0.000 | 0.000 | 0.000 | 1.000 | 0.000 | 0.000 | 0.000 | 0.000 | ||
| 21 spectra, AVQADQER | 0.000 | 0.000 | 0.034 | 0.966 | 0.000 | 0.000 | 0.000 | 0.000 | ||
| 11 spectra, VLQHMK | 0.000 | 0.000 | 0.099 | 0.893 | 0.000 | 0.000 | 0.008 | 0.000 | ||
| 5 spectra, LSTLPSDFCGLTHLVK | 0.018 | 0.000 | 0.000 | 0.970 | 0.000 | 0.000 | 0.000 | 0.011 | ||
| 3 spectra, DNPLDPVLAK | 0.036 | 0.000 | 0.000 | 0.964 | 0.000 | 0.000 | 0.000 | 0.000 | ||
| 5 spectra, ELAALPK | 0.000 | 0.000 | 0.000 | 1.000 | 0.000 | 0.000 | 0.000 | 0.000 | ||
| 14 spectra, LVTLPVSFAQLK | 0.000 | 0.000 | 0.000 | 0.993 | 0.000 | 0.000 | 0.000 | 0.007 | ||
| 17 spectra, LQQLPADFGR | 0.011 | 0.000 | 0.001 | 0.988 | 0.000 | 0.000 | 0.000 | 0.000 | ||
| 20 spectra, LVNLQHLDLLNNR | 0.037 | 0.000 | 0.000 | 0.963 | 0.000 | 0.000 | 0.000 | 0.000 | ||
| 7 spectra, ATVLDLSCNK | 0.042 | 0.000 | 0.000 | 0.940 | 0.000 | 0.000 | 0.000 | 0.019 |
| Plot | Mito | Lyso or Perox | ER | Golgi | PM | Cytosol | Nucleus | ||||||
| Expt B |
9 peptides |
54 spectra |
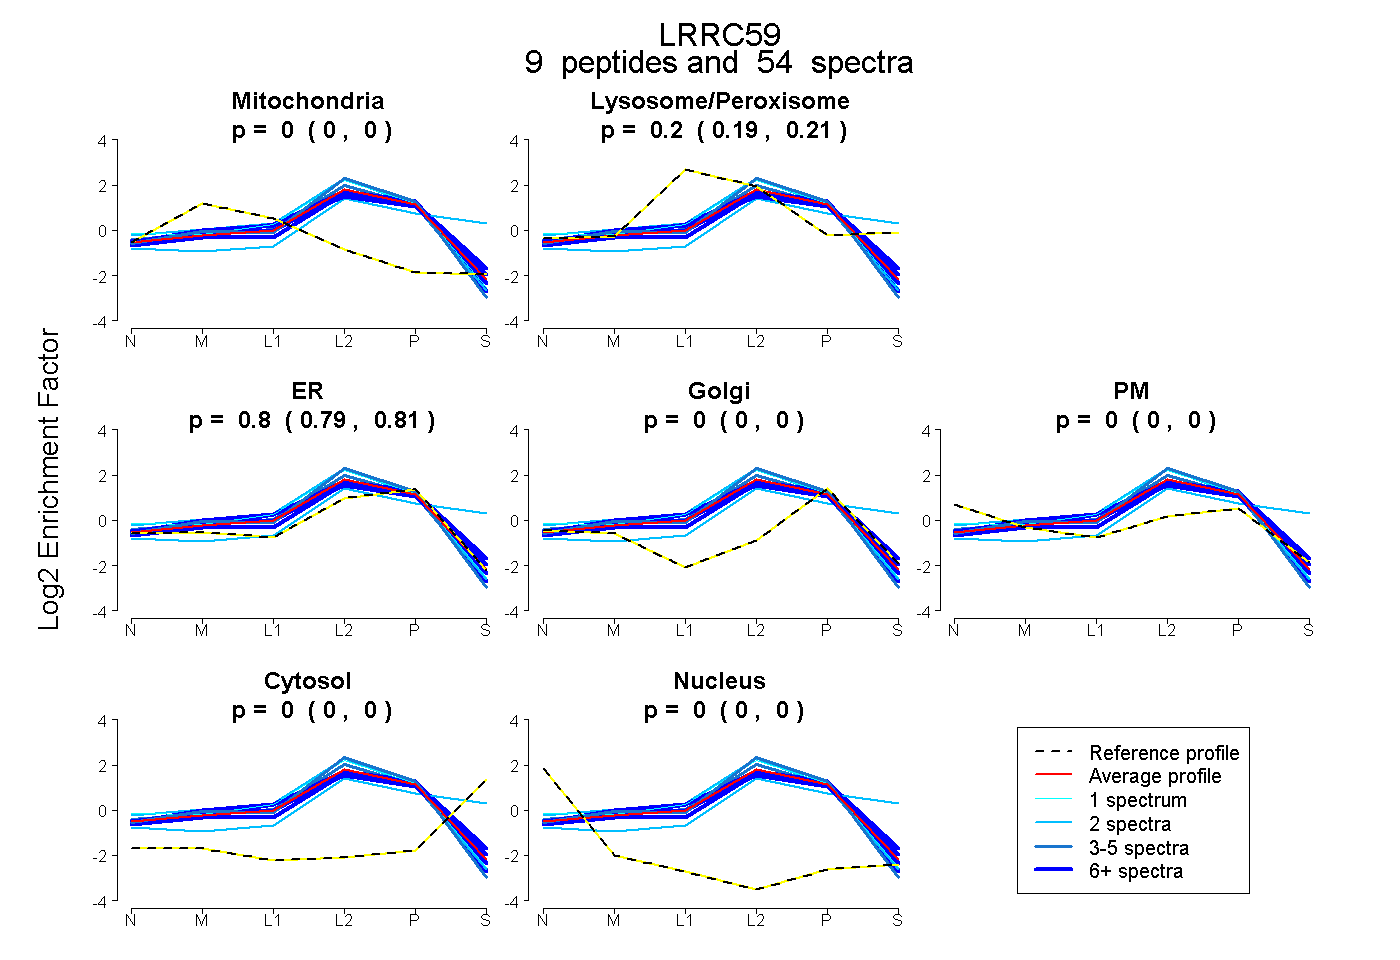 |
0.000 0.000 | 0.000 |
0.201 0.193 | 0.208 |
0.799 0.791 | 0.805 |
0.000 0.000 | 0.000 |
0.000 0.000 | 0.000 |
0.000 0.000 | 0.000 |
0.000 0.000 | 0.000 |
|||
| Plot | Lyso | Other | |||||||||||
| Expt C |
13 peptides |
272 spectra |
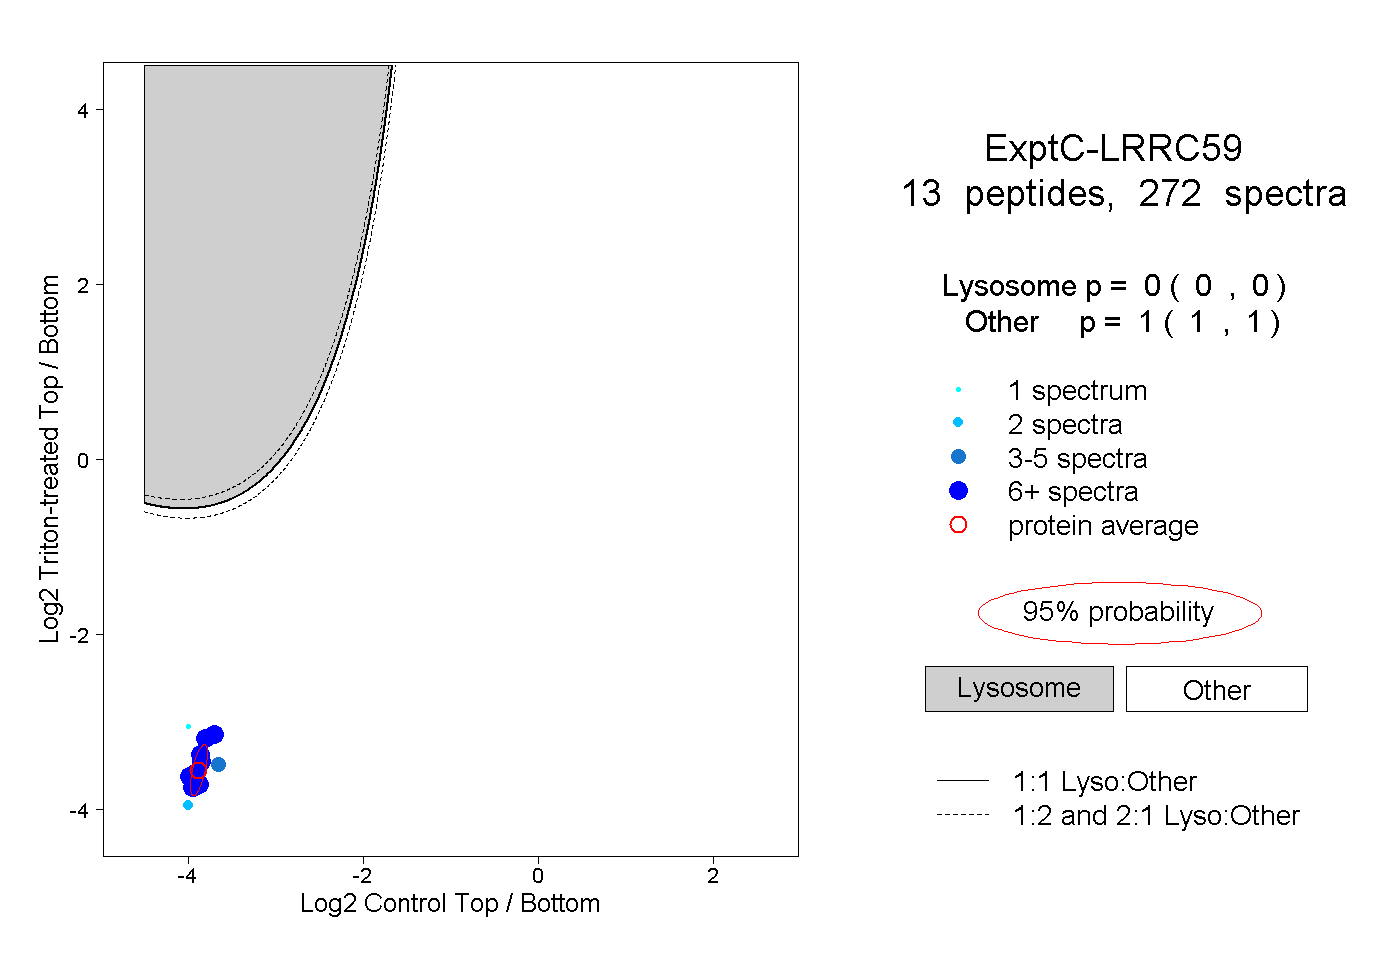 |
0.000 0.000 | 0.000 |
1.000 1.000 | 1.000 |
||||||||
| Plot | Lyso | Other | |||||||||||
| Expt D |
7 peptides |
21 spectra |
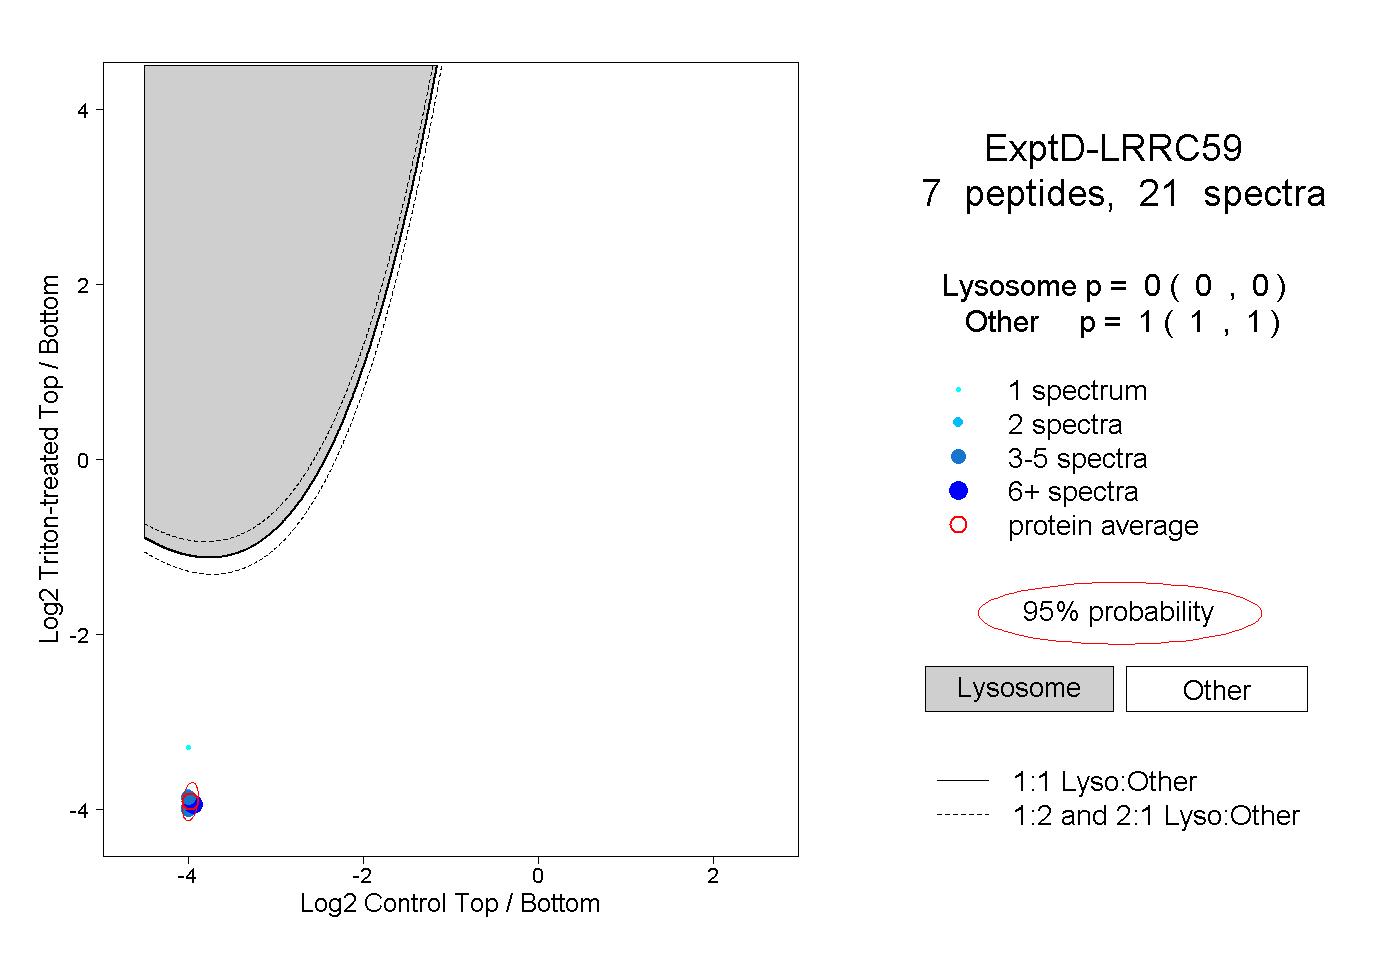 |
0.000 0.000 | 0.000 |
1.000 1.000 | 1.000 |