 7
7peptides
spectra
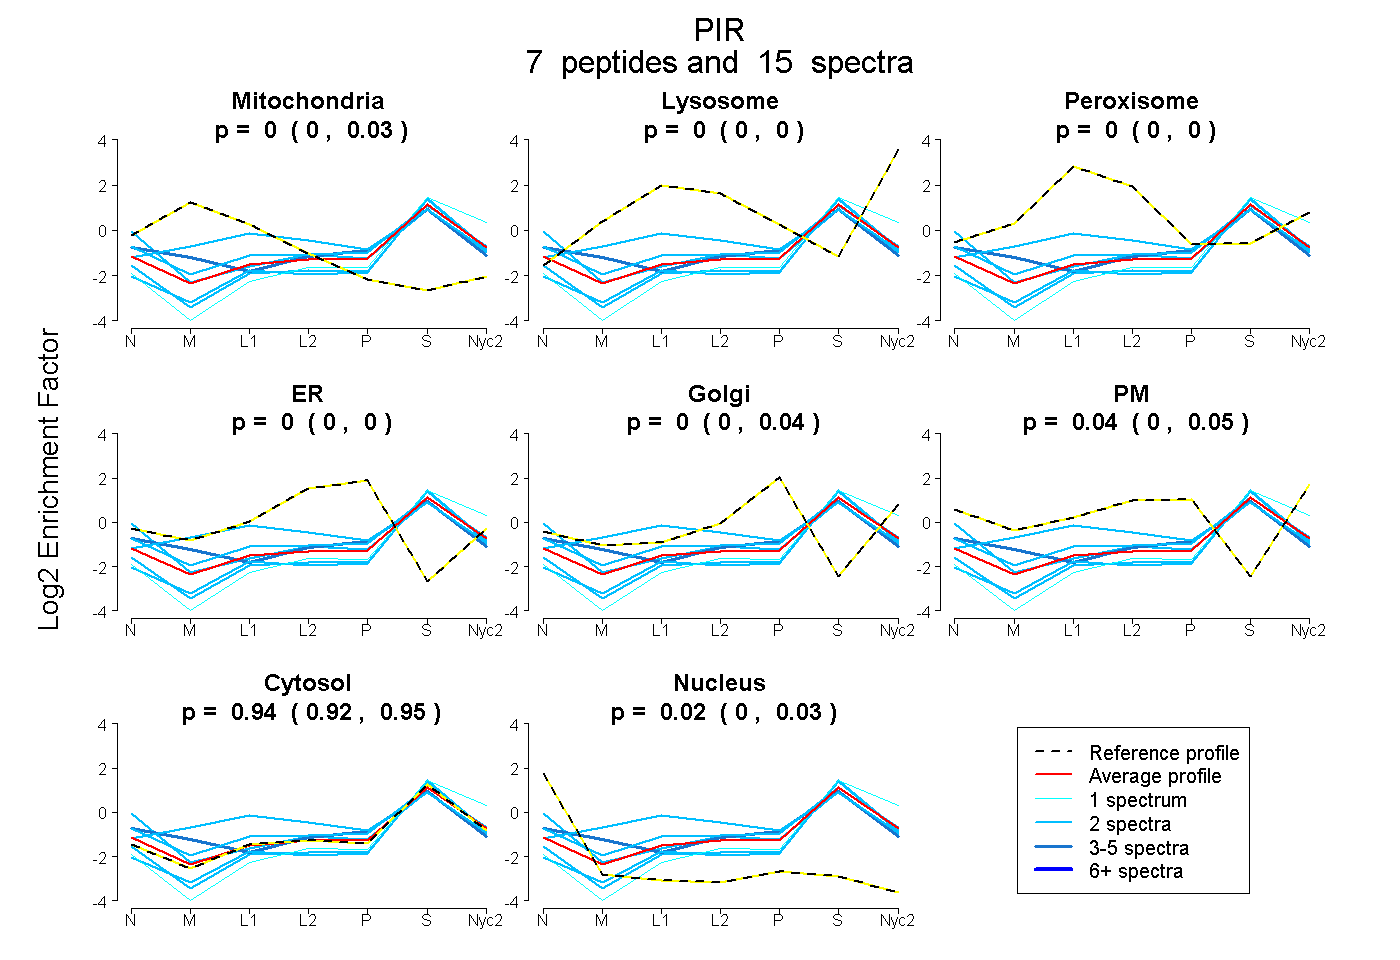
0.000 | 0.026
0.000 | 0.000
0.000 | 0.000
0.000 | 0.000
0.000 | 0.040
0.000 | 0.049
0.919 | 0.953
0.000 | 0.031
4peptides
spectra
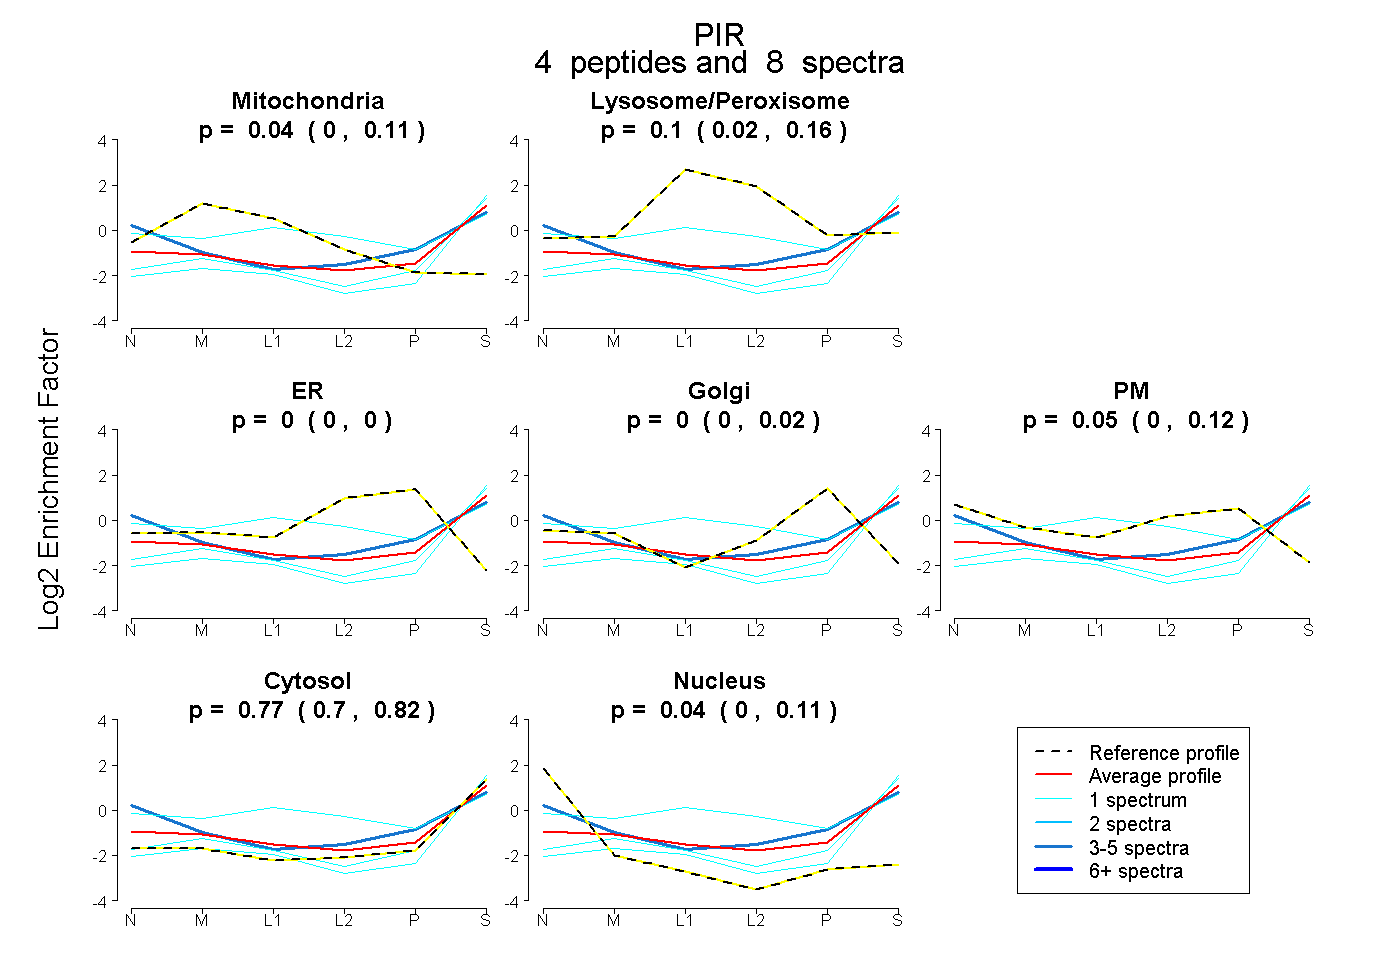
0.000 | 0.113
0.020 | 0.164
0.000 | 0.000
0.000 | 0.023
0.000 | 0.123
0.698 | 0.818
0.000 | 0.107
9peptides
spectra
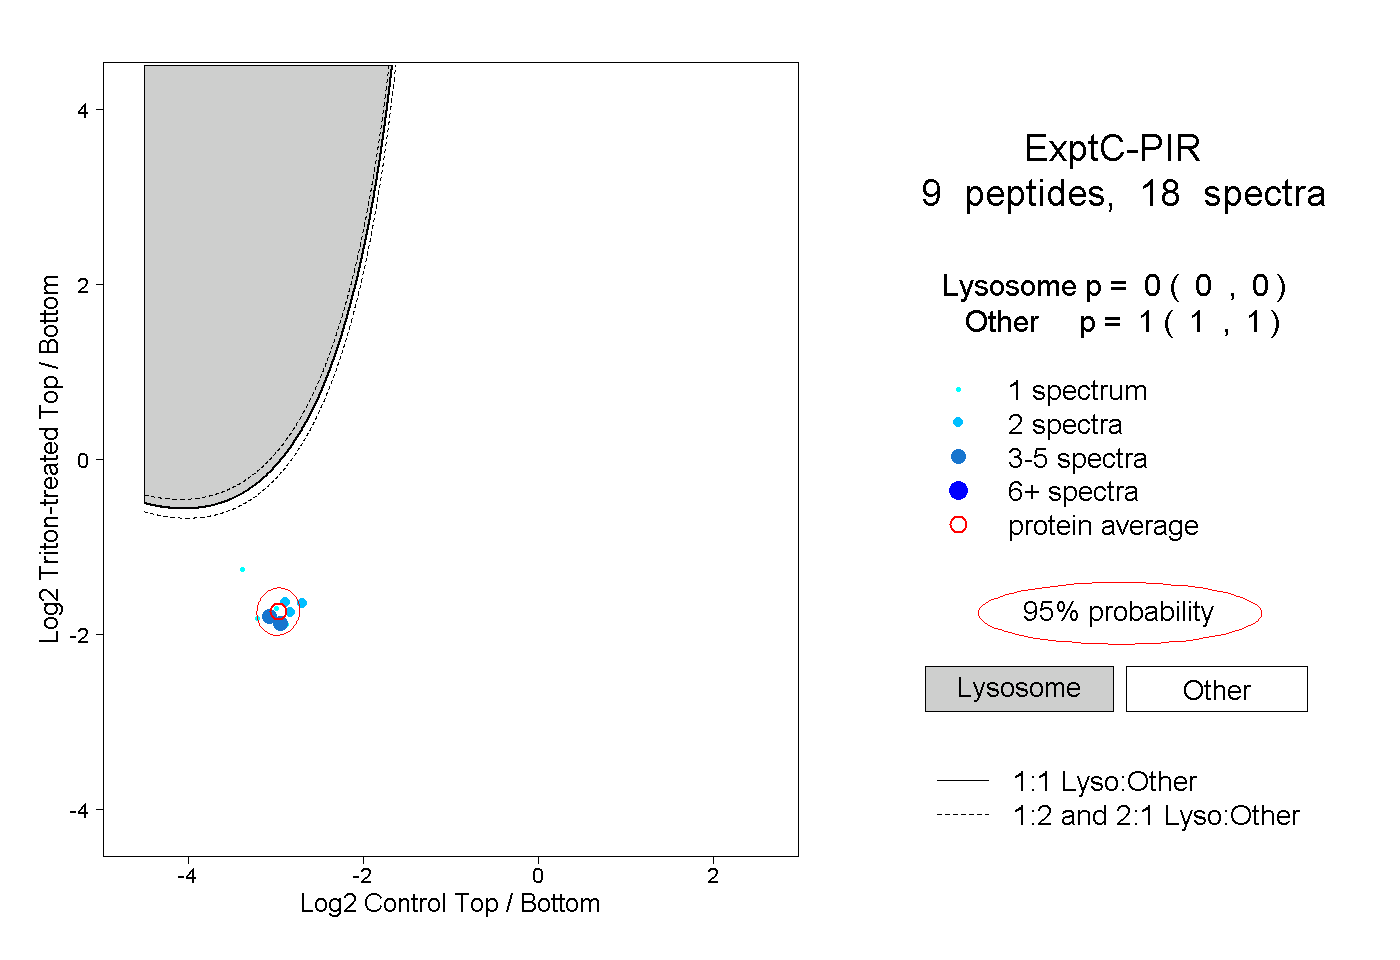
0.000 | 0.000
1.000 | 1.000