PIR
[ENSRNOP00000004884]
Main page
| | | Plot |
Mito |
Lyso |
|
Perox |
ER |
Golgi |
PM |
Cytosol |
Nucleus |
|
| Expt A |
 7
7
peptides |
15
spectra |
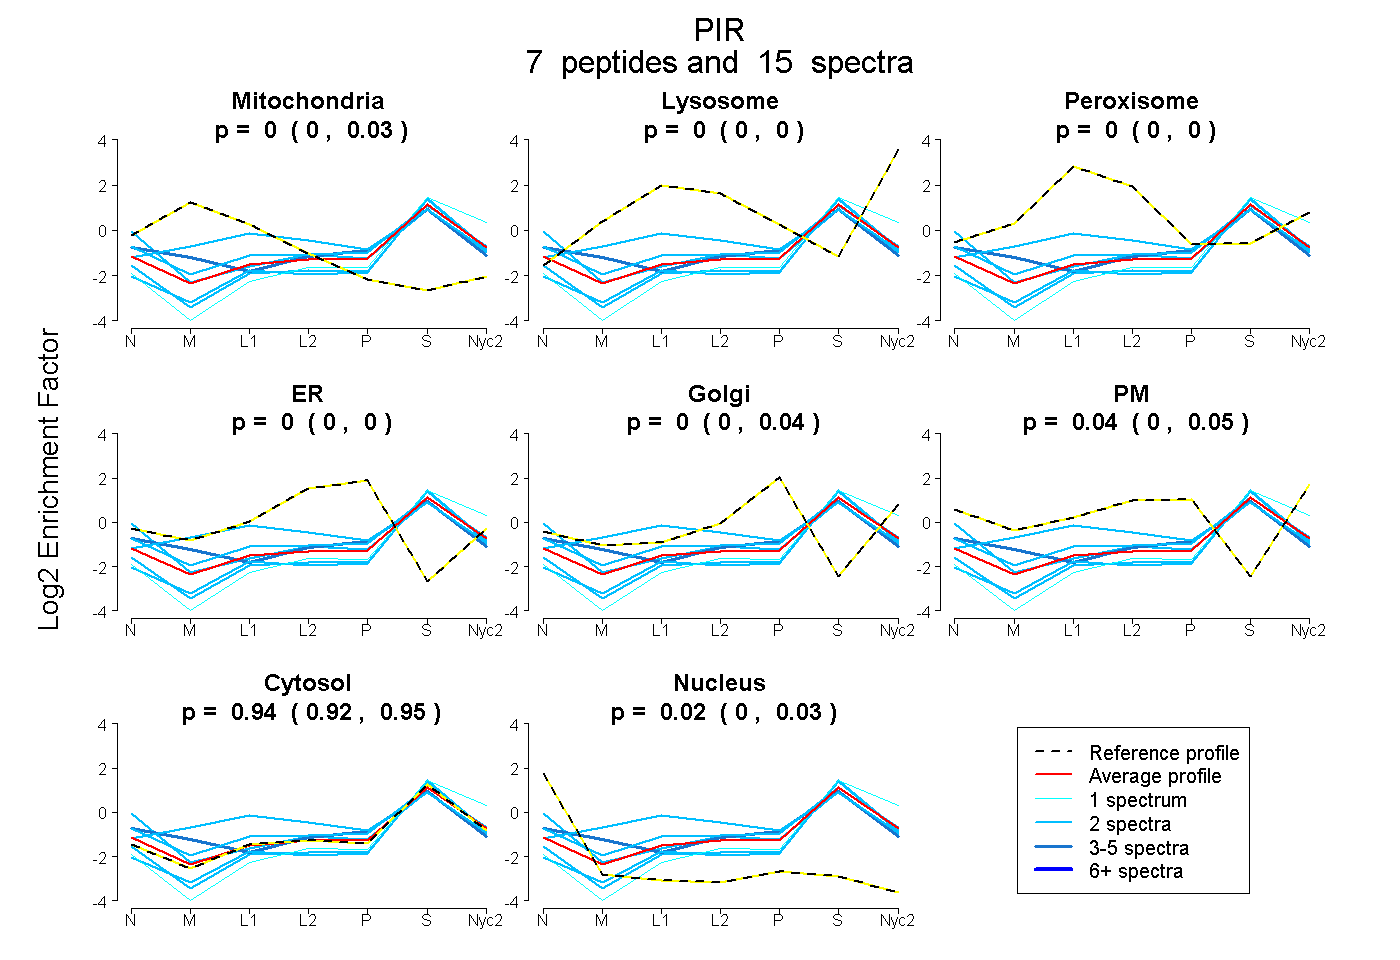 |
0.000
0.000 | 0.026 |
0.000
0.000 | 0.000 |
|
0.000
0.000 | 0.000 |
0.000
0.000 | 0.000 |
0.004
0.000 | 0.040 |
0.037
0.000 | 0.049 |
0.940
0.919 | 0.953 |
0.020
0.000 | 0.031 |
|
| | | Plot |
Mito |
|
Lyso or Perox |
|
ER |
Golgi |
PM |
Cytosol |
Nucleus |
|
| Expt B |
4
peptides |
8
spectra |
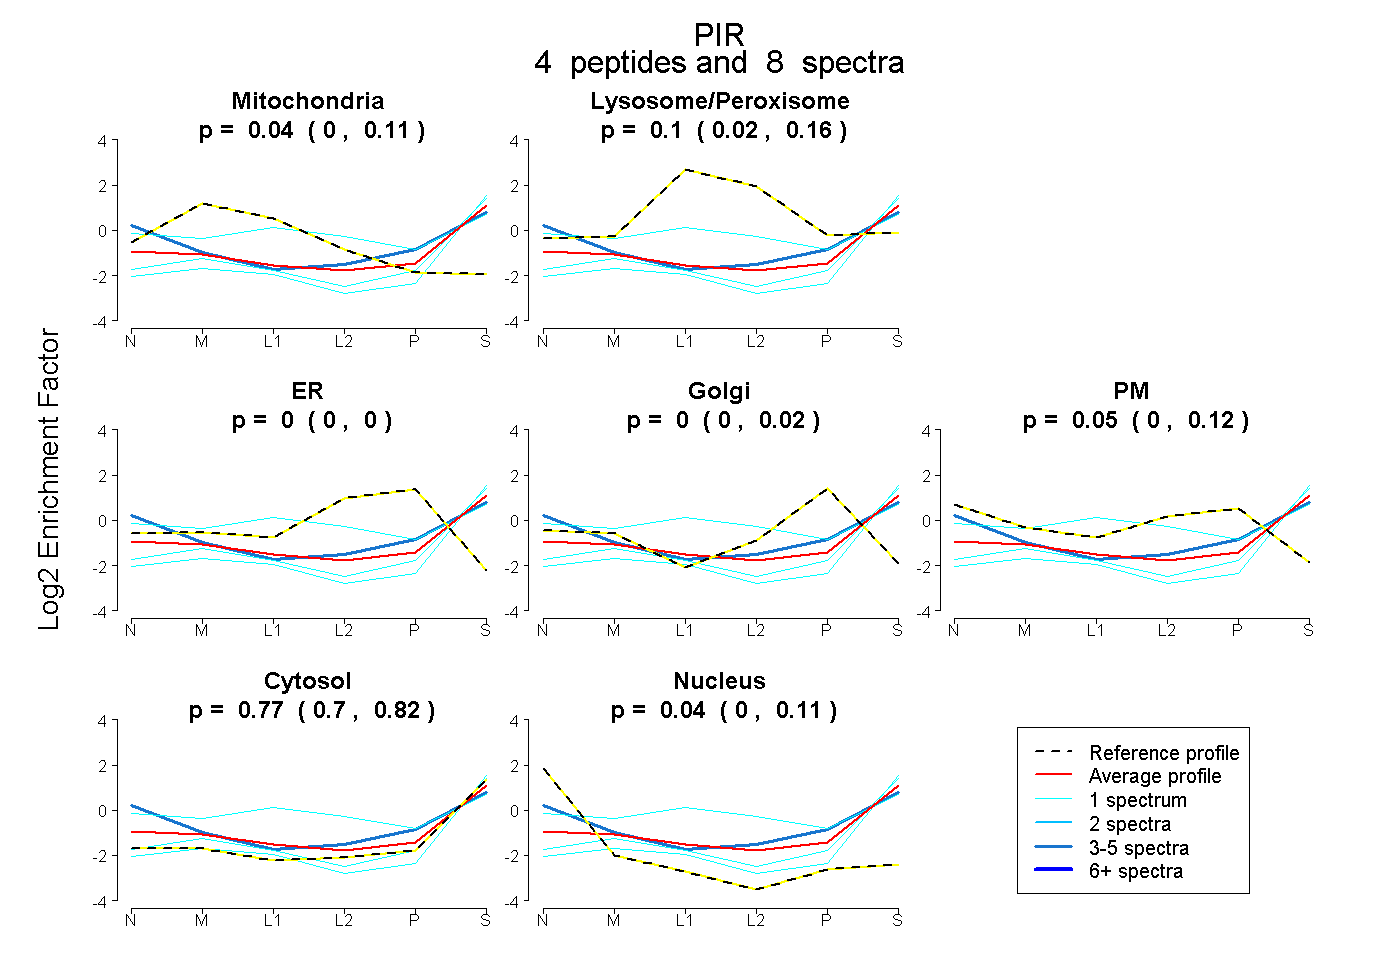 |
0.043
0.000 | 0.113 |
|
0.099
0.020 | 0.164 |
|
0.000
0.000 | 0.000 |
0.000
0.000 | 0.023 |
0.048
0.000 | 0.123 |
0.769
0.698 | 0.818 |
0.042
0.000 | 0.107 |
|
| 1 spectrum, VTLSVLSR |
0.064 |
|
0.000 |
|
0.000 |
0.000 |
0.000 |
0.936 |
0.000 |
|
| 1 spectrum, TPTLYLDFK |
0.000 |
|
0.000 |
|
0.000 |
0.000 |
0.000 |
1.000 |
0.000 |
|
| 5 spectra, GGRPGGFPDHPHR |
0.000 |
|
0.019 |
|
0.000 |
0.000 |
0.320 |
0.584 |
0.076 |
|
| 1 spectrum, HSQPIPK |
0.031 |
|
0.437 |
|
0.000 |
0.000 |
0.101 |
0.399 |
0.032 |
|
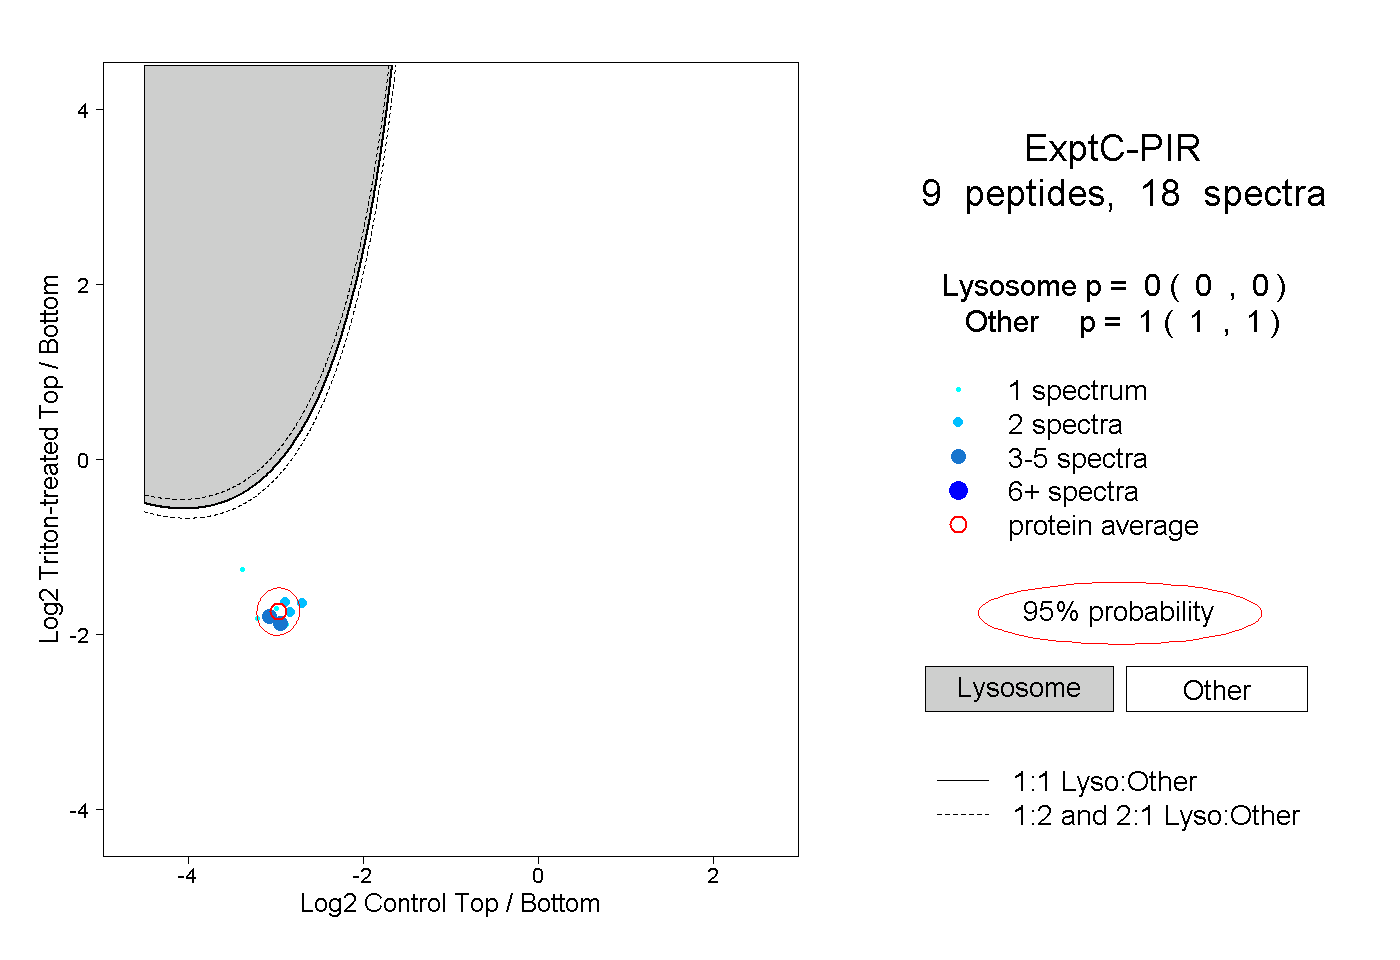
| | | Plot |
|
Lyso |
|
|
|
|
|
|
|
Other |
| Expt C |
9
peptides |
18
spectra |
 |
|
0.000
0.000 | 0.000 |
|
|
|
|
|
|
|
1.000
1.000 | 1.000 |