 23
23peptides
spectra
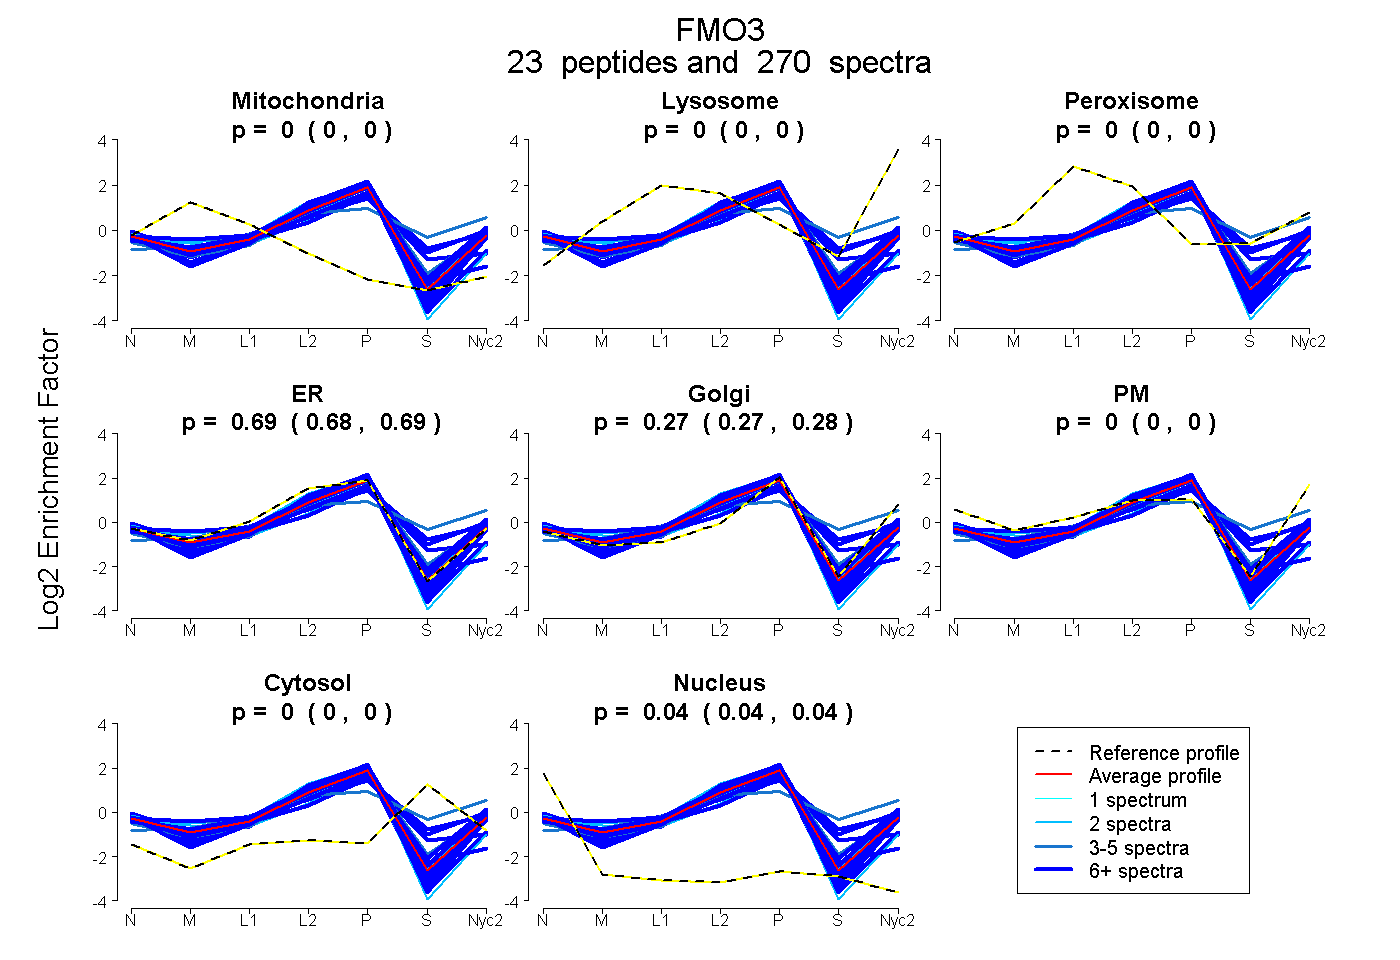
0.000 | 0.000
0.000 | 0.000
0.000 | 0.000
0.683 | 0.690
0.269 | 0.277
0.000 | 0.000
0.000 | 0.000
0.039 | 0.041
19peptides
spectra
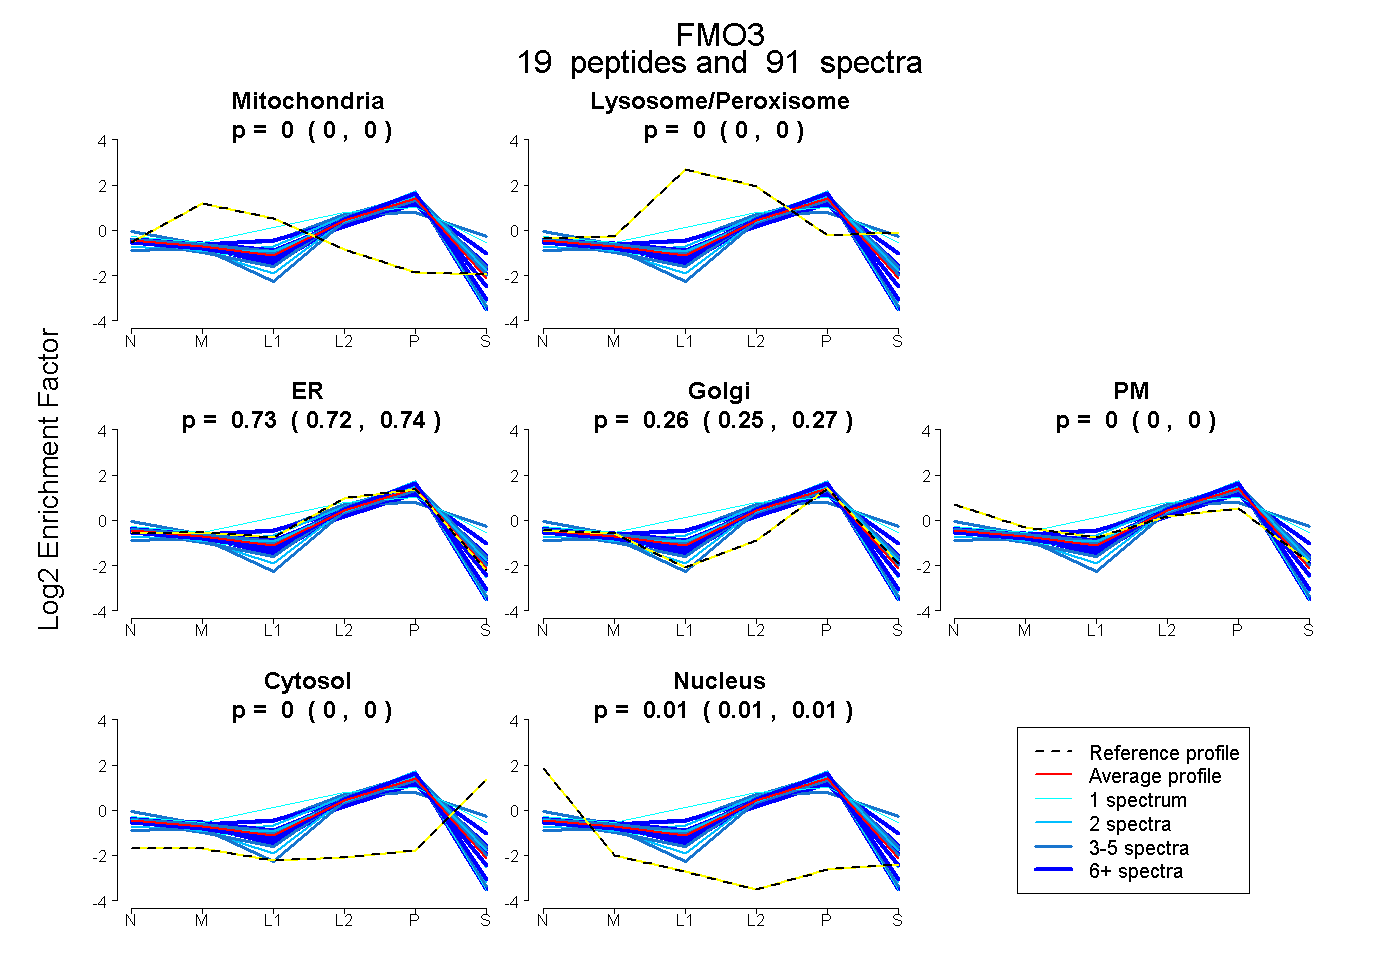
0.000 | 0.000
0.000 | 0.000
0.720 | 0.736
0.250 | 0.268
0.000 | 0.000
0.000 | 0.000
0.009 | 0.013
25peptides
spectra
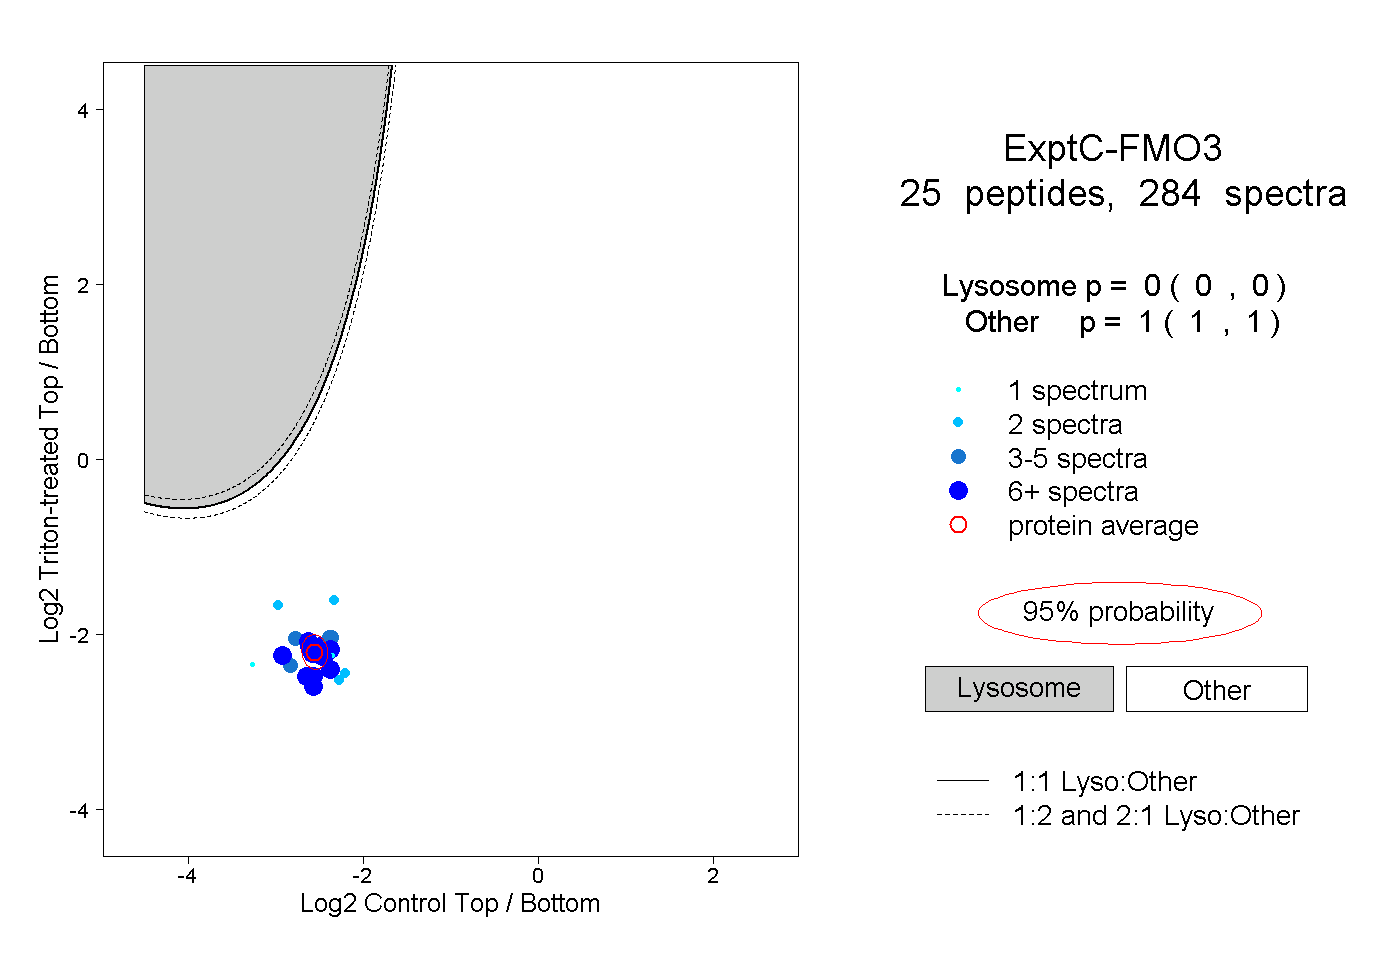
0.000 | 0.000
1.000 | 1.000
8peptides
spectra
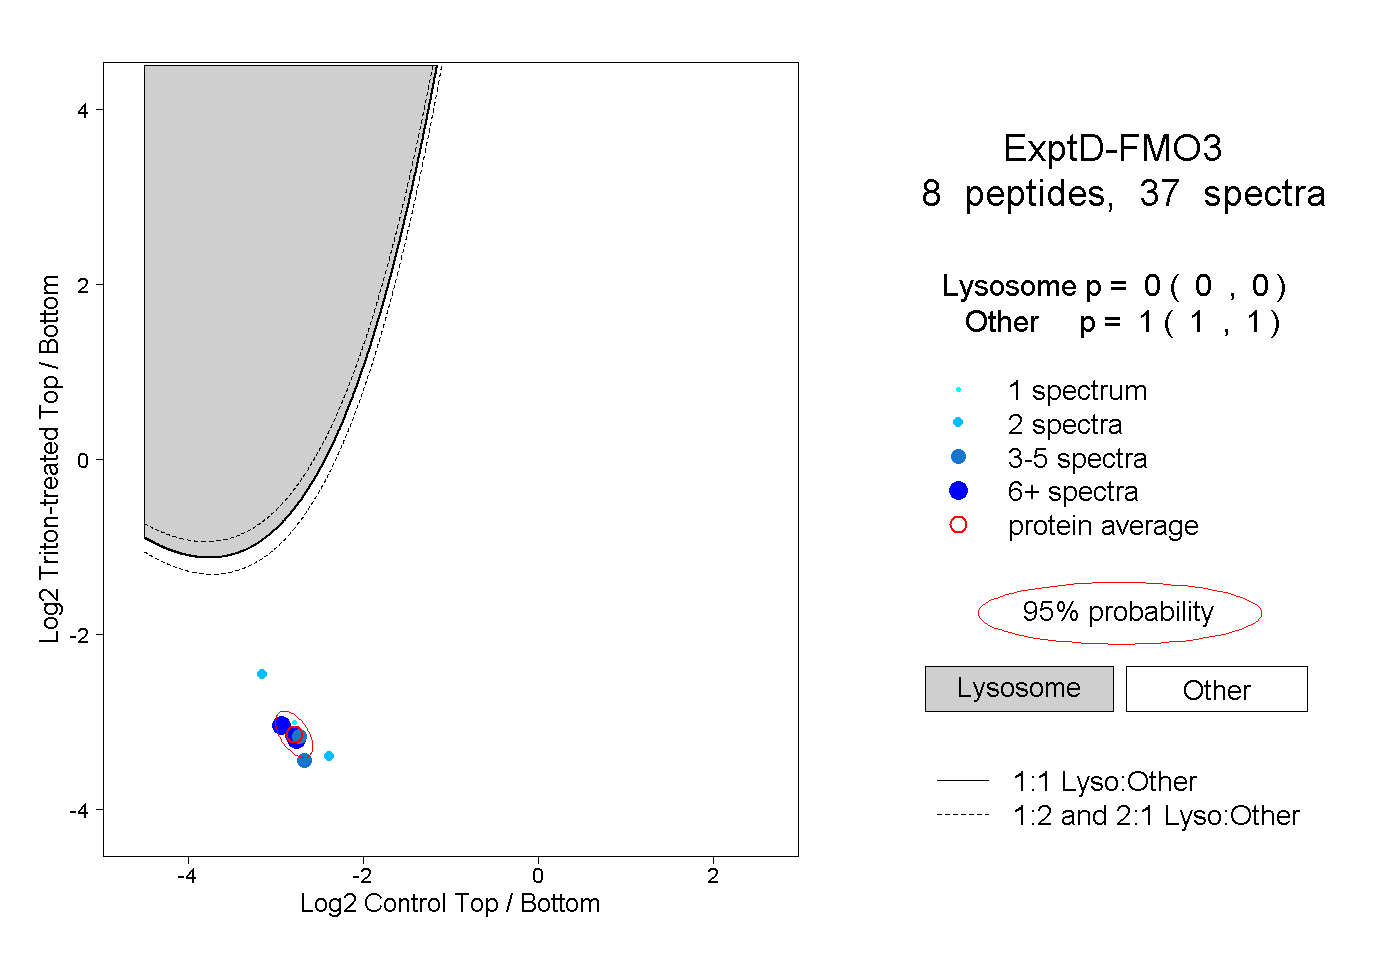
0.000 | 0.000
1.000 | 1.000